Simulation of DNS(Domain Name System) Using SimLib
Simulation of DNS(Domain Name System) Using SimLib
Simulation of DNS(Domain Name System) Using SimLib
- No tags were found...

Create successful ePaper yourself
Turn your PDF publications into a flip-book with our unique Google optimized e-Paper software.
<strong>Simulation</strong> <strong>of</strong> <strong>DNS</strong>(<strong>Domain</strong> <strong>Name</strong> <strong>System</strong>)<strong>Using</strong> <strong>SimLib</strong>Submitted byPrem TamangSubmitted toDr. Lawrence J. Osborne
Table <strong>of</strong> Contents1. Introduction ……………………………………………………………… 32. Motivation and Challenges………………………………………………. 53. Assumptions ……………………………………………………………… 54. Implementations ………………………………………………………….. 7• Event Graph• Selection <strong>of</strong> Input Probability Distribution for the Randomvariables existing in the Modeli) Assessment <strong>of</strong> Sample Independenceii) Hypothesizing Families <strong>of</strong> Distributionsiii) Estimation <strong>of</strong> Parametersiv) Determining How Representative the Fitted Distribution arev) Goodness-<strong>of</strong> Fits Tests5. <strong>Simulation</strong> Results ………………………………………………………………… 126. Analysis <strong>of</strong> results………………………………………………………………… 177. References………..………………………………………………………………… 18
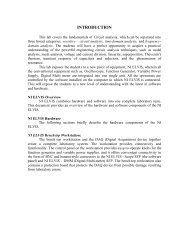
1. IntroductionThe <strong>Domain</strong> <strong>Name</strong> <strong>System</strong> (<strong>DNS</strong>) is a distributed database that allows local control <strong>of</strong>the segments <strong>of</strong> the overall database, yet data in each segment are available across the entirenetwork through a client-server scheme. This hierarchical naming system contains programscalled name servers which stores information about some segment <strong>of</strong> the database and make itavailable to clients, called resolvers. Resolvers are <strong>of</strong>ten just library routines that create queriesand send them across a network to a name server.This project simulates the behavior <strong>of</strong> the name servers which resolves domain namesmeaningful to humans into the numerical (binary) identifiers associated with networkingequipment for the purpose <strong>of</strong> locating and addressing these devices worldwide.Client1Client2Client3Client4Client5NS Queuries[e.g.google.com]QUEUENS Queuries[e.g.google.com]<strong>Name</strong>Server1<strong>Name</strong>Server 2Reply[COM:IP Address]RootGeneral Top Level DomaimCOM<strong>Name</strong> ServersEDUMicros<strong>of</strong>t.com 202.46.197.32Novell.com 130.57.5.30Google.com 74.125.157.147Query Resolved[e.g.google.com : 74.125.157.147]Model <strong>of</strong> the <strong>Simulation</strong> <strong>System</strong>Lamar.edu 148.158.64.247Tamu.edu 165.91.22.88Gatech.edu 130.207.244.244This simulation system consists <strong>of</strong> the name servers that receive requests one at a time from theset <strong>of</strong> clients within its network in a continuous manner. <strong>Name</strong> servers are present in three levels,the root level, the top level domains and the respective authoritive name servers. <strong>Name</strong> Servers
supports Iterative Queries or Non-Recursive Queries i.e. the requester must be capable <strong>of</strong>pursuing referrals. The requests from the clients are queued in the name server if the name serveris busy in processing the packet. Once the request packet is processed, the query will passed tothe Root level <strong>Domain</strong> which contains information regarding all the top level domains like com ,edu , info etc. Then the root level domain refers the respective top level domain (i.e. provides theIP Address) to the names server .The request will again be queued in the name server since thepackets needs to be processed. The request will be redirected to the top level domains whichagain sends the referrals(IP Address) <strong>of</strong> the respective <strong>Name</strong> Server. Finally the respectiveAuthoritive name servers provides the IP Address for the given domain name back and theresponse will be forwarded back to the Client.e.g. Client 1 sends the request www.google.com , to the <strong>Name</strong>Server1. There exist equal chances<strong>of</strong> selection <strong>of</strong> the <strong>Name</strong>Servers based on the equal probability. If NS1 is busy processing thepacket, it will be stored into the queue. Then the reqest is forwarded to the Root Level <strong>Domain</strong>[XX.XX.XX.XX]. It replies back with the IP Address <strong>of</strong> the Top Level <strong>Domain</strong>s - COM. Therequest are again queued on the NS1 server. Once its turns comes, again the request will beforwarded for resolving to the COM Top Level <strong>Domain</strong>. The COM Top level domains againreplies back with the IPAddress <strong>of</strong> the <strong>Name</strong>Server <strong>of</strong> Google.com. The request is againprocessed at NS1 and the redirected to the <strong>Name</strong>Server <strong>of</strong> the Google. Finally the Authoritive<strong>Name</strong>Server <strong>of</strong> google.com provides the IP Address <strong>of</strong> the WebServer in the <strong>DNS</strong> Reply to theNS1. The NS1 then replies back to the client with the valid IP Address <strong>of</strong> the requested domainwww.google.com.
2. Motivation and ChallengesIn the internet, <strong>DNS</strong> is one <strong>of</strong> the mostly used systems since for accessing any resourceon the internet, it requires the IP Address <strong>of</strong> that resource and <strong>DNS</strong> provides this. Every networkconsists <strong>of</strong> at least one <strong>DNS</strong> Server. The performance <strong>of</strong> the network is heavily dependent uponthe <strong>Name</strong> Servers. So it’s always important to know how well the <strong>DNS</strong> performs in the network.Various factors like the total number <strong>of</strong> queries, type <strong>of</strong> queries, the response time, and numbers<strong>of</strong> available master <strong>DNS</strong> Servers affects the performance <strong>of</strong> <strong>DNS</strong> Servers. So this projectprovides the simulation model <strong>of</strong> the <strong>DNS</strong> system to measure the arrival rate <strong>of</strong> the <strong>DNS</strong> queries,response time <strong>of</strong> the Queries , handling <strong>of</strong> various types <strong>of</strong> valid and invalid queries and loadbalancing depending upon the numbers <strong>of</strong> <strong>DNS</strong> Servers etc.The biggest challenge in this project was hypothesizing the probability distribution forthe random variable like Inter-arrival Time <strong>of</strong> <strong>DNS</strong> Queries, Service type for the packetprocessing, Round Trip time to the <strong>Domain</strong> <strong>Name</strong> Servers. Also, designing the work-flow modelfor representing the name servers and various zones was quite difficult.3. Assumptions:• The system consist <strong>of</strong> basic components only i.e. Client Machines, <strong>Name</strong> Servers . Thezone contains three levels, Root zone, general Top Level <strong>Domain</strong>(gTLD) and theauthoritive name servers. Currently the system implements only two types <strong>of</strong> gTLD ,COM and EDU. Each gTLD at least contains the name server information <strong>of</strong> 5authoritive name servers.• <strong>Name</strong>Server supports only Iterative Queries and doesn’t provide the caching.• Interarrival time <strong>of</strong> the <strong>DNS</strong> Queries are IID and arrives the system one at a time.• Data for estimating the Mean Value for Interarrival time has been obtained from theinternet sites [2][3]. .• The servers takes time ( though very less) for the packet processing and if the server isbusy processing the packet, the request from the client as well as the responses from theother root, gTLD and authoritive name servers has to wait in queue.
• Response time i.e. the total time when the client gets back the response for this <strong>DNS</strong>Queries is dependent upon the Service Time or Packet Processing Time <strong>of</strong> the <strong>DNS</strong>Server, Round Trip Time from the <strong>DNS</strong> Server to the zone servers.• The simulation is performed for length <strong>of</strong> 5 hrs.List Specifications:The simulation model measure the performance <strong>of</strong> the <strong>DNS</strong> on the basis <strong>of</strong> followingmeasures :• Average Response Time <strong>of</strong> the <strong>System</strong>• Average Delay in the Queue• Time Average No. <strong>of</strong> the Request and Responses in the Queue• Utilization <strong>of</strong> the <strong>Name</strong> Servers• Efficiency <strong>of</strong> the system depending upon the various numbers <strong>of</strong> name servers• Proportion <strong>of</strong> the <strong>DNS</strong> Queries for Invalid <strong>Domain</strong>s• Proportion <strong>of</strong> the NDS Queries for COM and EDU <strong>Domain</strong>s.
4. Implementation :This project uses the C programming language and SIMLIB package for simulation.ArrivalDepartureEnd<strong>Simulation</strong>Event Graph for <strong>DNS</strong> <strong>System</strong> Model.Selection <strong>of</strong> Input Probability Distribution :This simulation model basically consists <strong>of</strong> three Random Variables.i) Inter-arrival Timeii) Service Timeiii)Round Trip TimeAll the random variables are Identical- Independent Distribution. This project uses the standardtechniques <strong>of</strong> statistical inference to “fit” a theoretical distribution form to the data and toperform hypothesis tests to determine the goodness <strong>of</strong> fit. The following steps are performed onthe collected data by the help <strong>of</strong> Expertfit S<strong>of</strong>tware from Averill M.Law & Associates to selectthe Input Probability Distribution:
Data Summary from Expertfit S<strong>of</strong>tware.i) Inter-arrival Time :Hypothesized Probability Distribution : Weibull Probability Distributiona) Assessment <strong>of</strong> Sample Independence• Scatter Diagram :• Lag-Correlation Plot:
) Hypothesizing Families <strong>of</strong> Distributions:Histograms:c) Estimation <strong>of</strong> Parameters :The probability distribution hypothesized appears to be “Gamma” distribution which belongs tothe Heavy Tailed Distribution Family.Estimated Parameters :
Alpha = Shape Parameter = 62.19625Beta = Scale Parameter = 0.80464d) Determining How Representative the Fitted Distribution are :• Density-Histogram Plots :• Distribution-Function-Differences Plots :e) Goodness-<strong>of</strong> Fits Tests :H 0 : The X i ’s are IID random variables with Weibull Probability Distribution function
• Chi-Square Tests :• Kolmogorov-Smirnov Tests :Thus the null Hypothesis H 0 cannot be rejected.The random variates in this simulation model are generated from the probability distribution ,Weibull, using the following formula.X=B(-1n U) 1/αwhere U ~ U(0,1)
ii) Service Time or Packet Processing Time :Actual sets <strong>of</strong> data could not be achieved. However based on the interpreted data on site [4]the value considered for service time is 600-800 microseconds . So a uniform distributionU(0.0006-0.0008) is used to generate the Random Variates.iii) Round Trip Time :Actual sets <strong>of</strong> data could not be achieved. However, the gTLD Server [5] shows that the RTTtime varies about 200-400 ms.So a uniform distribution is considered U(0.2-0.4) to generate the Radom Variates.5. <strong>Simulation</strong> Results:The simulation is performed with the varying numbers <strong>of</strong> clients and servers.When the numbers <strong>of</strong> Servers = 2 and No. <strong>of</strong> Clients machines is varied from 5to 15<strong>DNS</strong> Server <strong>Simulation</strong>=====================Total Number <strong>of</strong> Server : 2Number <strong>of</strong> Client Machines : 5 to 15 by 10Shape Parameter(Alpha) for Weibull Distribution <strong>of</strong> Interarrival Time :62.19625 secondsScale Parameter(Beta) for Weibull Distribution <strong>of</strong> Interarrival Time :0.80464 secondsLower Limit for Uniform Distribution <strong>of</strong> Service Time :Upper Limit for Uniform Distribution <strong>of</strong> Service Time :Lower Limit for Uniform Distribution <strong>of</strong> Round Trip Time :Upper Limit for Uniform Distribution <strong>of</strong> Round Trip Time :Total Time for <strong>Simulation</strong> : 1.000 minutes0.00060 seconds0.00080 seconds0.20000 seconds0.40000 secondsNo. <strong>of</strong> Clients : 5Proportion <strong>of</strong> <strong>DNS</strong> Queries Related to COM <strong>Domain</strong> : (183/564) : 0.324468Proportion <strong>of</strong> <strong>DNS</strong> Queries Related to EDU <strong>Domain</strong> : (192/564) : 0.340426Proportion <strong>of</strong> Invalid Queries : (189/564) : 0.335106Response Times for Client Machines===================================
sampstNumbervariable<strong>of</strong>number Average values Maximum Minimum________________________________________________________________________1 27.1045 37.0000 58.9534 0.7240052 28.4987 40.0000 57.5436 1.023453 31.3211 32.0000 58.2869 2.486364 35.1893 35.0000 58.7487 3.303195 32.5062 37.0000 59.0197 0.879908________________________________________________________________________CPU Utilization=================File Timenumber average Maximum Minimum_______________________________________________________3 0.00713647 1.00000 0.000004 0.00799003 1.00000 0.00000______________________________________________________Time Average Number <strong>of</strong> Delay for Requests and Responses in Queue=================File Timenumber average Maximum Minimum_______________________________________________________1 3.21706E-05 1.00000 0.000002 4.27246E-05 1.00000 0.00000_______________________________________________________No. <strong>of</strong> Clients : 15Proportion <strong>of</strong> <strong>DNS</strong> Queries Related to COM <strong>Domain</strong> : (557/1676) : 0.332339Proportion <strong>of</strong> <strong>DNS</strong> Queries Related to EDU <strong>Domain</strong> : (565/1676) : 0.337112Proportion <strong>of</strong> Invalid Queries : (554/1676) :0.330549Response Times for Client Machines===================================sampstNumbervariable<strong>of</strong>number Average values Maximum Minimum________________________________________________________________________1 32.3719 39.0000 56.8068 1.770292 30.2344 40.0000 59.1481 0.9150143 30.3714 47.0000 57.6046 0.9317484 28.1619 38.0000 59.1190 1.759095 33.1265 35.0000 59.0617 0.9252816 30.0880 34.0000 57.3162 1.785007 28.4804 29.0000 57.3242 4.881228 30.5127 42.0000 59.1637 0.9041729 29.7878 38.0000 58.2726 0.995557
10 35.5800 39.0000 58.7033 1.7894811 28.2283 35.0000 58.5564 0.87873512 31.8850 30.0000 57.2434 4.1196513 30.6599 37.0000 56.7885 0.94760414 31.6593 37.0000 57.3897 5.6423615 29.6046 35.0000 59.0936 1.58028________________________________________________________________________CPU Utilization=================File Timenumber average Maximum Minimum_______________________________________________________3 0.0226064 1.00000 0.000004 0.0227799 1.00000 0.00000_______________________________________________________Time Average Number <strong>of</strong> Delay for Requests and Responses in Queue=================File Timenumber average Maximum Minimum_______________________________________________________1 0.000317542 2.00000 0.000002 0.000275157 1.00000 0.00000______________________________________________________When the numbers <strong>of</strong> Servers = 5 and No. <strong>of</strong> Clients machines is varied from 5to 15<strong>DNS</strong> Server <strong>Simulation</strong>=====================Total Number <strong>of</strong> Server : 5Number <strong>of</strong> Client Machines : 5 to 15 by 10Shape Parameter(Alpha) for Weibull Distribution <strong>of</strong> Interarrival Time : 62.19625 secondsScale Parameter(Beta) for Weibull Distribution <strong>of</strong> Interarrival Time : 0.80464 secondsLower Limit for Uniform Distribution <strong>of</strong> Service Time : 0.00060 secondsUpper Limit for Uniform Distribution <strong>of</strong> Service Time : 0.00080 secondsLower Limit for Uniform Distribution <strong>of</strong> Round Trip Time : 0.20000 secondsUpper Limit for Uniform Distribution <strong>of</strong> Round Trip Time : 0.40000 secondsTotal Time for <strong>Simulation</strong> : 1.000 minutesNo. <strong>of</strong> Clients : 5Proportion <strong>of</strong> <strong>DNS</strong> Queries Related to COM <strong>Domain</strong> : (183/564) : 0.324468Proportion <strong>of</strong> <strong>DNS</strong> Queries Related to EDU <strong>Domain</strong> : (192/564) : 0.340426Proportion <strong>of</strong> Invalid Queries : (189/564) : 0.335106Response Times for Client Machines===================================sampstNumbervariable<strong>of</strong>
number Average values Maximum Minimum________________________________________________________________________1 27.1143 37.0000 59.0959 0.7240052 28.5071 40.0000 57.5436 1.023453 31.3350 32.0000 58.5059 2.486364 35.1981 35.0000 58.9449 3.303195 32.4927 37.0000 58.9607 0.879908_______________________________________________________________________CPU Utilization=================File Timenumber average Maximum Minimum_______________________________________________________6 0.00284082 1.00000 0.000007 0.00285162 1.00000 0.000008 0.00291142 1.00000 0.000009 0.00318045 1.00000 0.0000010 0.00333871 1.00000 0.00000_______________________________________________________Time Average Number <strong>of</strong> Delay for Requests and Responses in Queue======================================================File Timenumber average Maximum Minimum_______________________________________________________1 0.00000 -1.00000E+30 1.00000E+302 0.00000 -1.00000E+30 1.00000E+303 0.00000 -1.00000E+30 1.00000E+304 6.42141E-06 1.00000 0.000005 0.00000 -1.00000E+30 1.00000E+30_______________________________________________________No. <strong>of</strong> Clients : 5Proportion <strong>of</strong> <strong>DNS</strong> Queries Related to COM <strong>Domain</strong> : (557/1676) : 0.332339Proportion <strong>of</strong> <strong>DNS</strong> Queries Related to EDU <strong>Domain</strong> : (565/1676) : 0.337112Proportion <strong>of</strong> Invalid Queries : (554/1676) : 0.330549Response Times for Client Machines============================sampstNumbervariable<strong>of</strong>number Average values Maximum Minimum________________________________________________________________________1 32.3825 39.0000 57.0152 1.786482 30.2167 40.0000 59.1481 0.9150143 30.3564 47.0000 57.6517 0.9317484 27.3149 37.0000 57.5751 1.562595 33.1145 35.0000 59.0618 0.925281
6 30.0895 34.0000 57.3960 1.688707 28.4713 29.0000 57.1220 4.935718 29.8303 41.0000 58.6793 0.9041729 29.8014 38.0000 58.2613 0.99555710 35.5758 39.0000 58.5802 1.8610311 28.2035 35.0000 58.6058 0.87873512 31.8920 30.0000 57.2678 4.0415413 30.6812 37.0000 56.6761 0.94760414 31.6435 37.0000 57.4134 5.6417515 29.6031 35.0000 59.0294 1.58028________________________________________________________________________CPU Utilization============File Timenumber average Maximum Minimum_______________________________________________________6 0.00843381 1.00000 0.000007 0.00975168 1.00000 0.000008 0.00865565 1.00000 0.000009 0.00976150 1.00000 0.0000010 0.00880374 1.00000 0.00000______________________________________________________Time Average Number <strong>of</strong> Delay for Requests and Responses in Queue======================================================File Timenumber average Maximum Minimum_______________________________________________________1 4.15603E-05 1.00000 0.000002 1.49131E-05 1.00000 0.000003 2.98977E-05 1.00000 0.000004 6.61135E-05 1.00000 0.000005 7.05481E-05 1.00000 0.00000_______________________________________________________
6. Analysis <strong>of</strong> ResultsThe results from the simulation model are obtained as expected. As we can seethat, keeping the number <strong>of</strong> servers constant (i.e. 2) in first case, when the no. <strong>of</strong> clients areincreased from 5 to 15 , CPU Utilization as well as the time average no. delay <strong>of</strong> requests andresponses in the Queue are also increased. As we can see the packet processing time by the<strong>Name</strong> Server in comparison to the Round Trip Time, is very small, so we don’t have manypackets in the queue which also explains the low utilization value <strong>of</strong> CPU. Server simplyprocesses the packets and redirects it to the other <strong>Domain</strong> Servers.Similarly, when the numbers <strong>of</strong> name servers are increased the load is dividedresulting into low CPU Utilization as well as low value <strong>of</strong> time average no. <strong>of</strong> delay <strong>of</strong> requestsand responses in the Queue.Due to the lack <strong>of</strong> the output data from the real system , the output <strong>of</strong> thissimulation could not be validated to the full extend. However, regarding the Interarrival time ,100 samples <strong>of</strong> data were taken from simulation and fed into the Expertfit S<strong>of</strong>tware , whichconfirms the Weibull Distribution <strong>of</strong> the Interarrival time.Further the Confidence-Interval Approach Based could have been applied forstatistical comparison <strong>of</strong> the real system observed data and simulation output data.
References:1) Jaeyeon Jung, Emil Sit, Hari Balakrishnan, Reobert Morris ,<strong>DNS</strong> performance and theeffectiveness <strong>of</strong> caching. IEEE/ACM Transactions on Networking (TON ) , pages , 589-603 ,20022) http://ita.ee.lbl.gov/html/contrib/DEC-PKT.html3) http://mawi.wide.ad.jp/mawi/dnsprobe/results/4) http://doolittle.icarus.com/ntpclient/README5)http://www.caida.org/cgibin/dns_perf/main.pl?metric=rtt&class=root&class=gTLD&site=ua&s-y=2010&s-m=7&sd=7&interval=1&type=Plot+&.cgifields=site&.cgifields=metric&.cgifields=class