Summer 2005 - Oklahoma Climatological Survey
Summer 2005 - Oklahoma Climatological Survey
Summer 2005 - Oklahoma Climatological Survey
- No tags were found...

Create successful ePaper yourself
Turn your PDF publications into a flip-book with our unique Google optimized e-Paper software.
<strong>Summer</strong> <strong>2005</strong>COVER STORY1980ALSO INSIDE: Blackwell Tornado of 1955 • Evapotranspiration: A New Way to Save Water
MESSAGE FROM THE EDITORMay 3rd. The Dust Bowl. The Woodward Tornado. These weather events havesurpassed their own notoriety and become celebrity, instantly recognizableby a single date or phrase. “The <strong>Summer</strong> of 1980” can be added to that list.Seemingly the summer that would not end, it defines the term “heat wave”for a generation of <strong>Oklahoma</strong>ns. I didn’t fully understand the implicationsof such long-lived heat while it was occurring. Being a kid, I was mostlyconcerned with the increasing scarcity of fishing holes down at the creek asthe 100-degree days accumulated. The toll on <strong>Oklahoma</strong>, and the nation asa whole, was actually quite staggering, however. In our historical feature, Iattempt to quantify just how tough that season really was on the people thatsuffered through it.The state of <strong>Oklahoma</strong> enjoys the best weather coverage anywhere on theglobe, thanks in large part to the efforts of the fine folks at the <strong>Oklahoma</strong>Mesonet, and that coverage just got better. Read about the Mesonet team’sefforts to get data to the state’s citizens and decision-makers even fasterthan before. Yet another reason why our fair state is the envy of the worldwhen it comes to weather networks! Acting State Climatologist Derek Arndtlooks back at yet another weather disaster from <strong>Oklahoma</strong>’s past, detailingthe Blackwell tornado of 1955 on this, the event’s 50th anniversary. Thistornado destroyed a large part of Blackwell, adding insult to injury by visitinga flood upon the shell-shocked town only two days later; a fascinating articlewith lots of great pictures.Following right along with the heat wave article is an explanation ofevapotranspiration and the <strong>Oklahoma</strong> <strong>Climatological</strong> <strong>Survey</strong>’s attempts tohelp rural and urban water users be more efficient stewards of the state’swater supply. Through data from the <strong>Oklahoma</strong> Mesonet, models allowfarmers to schedule irrigation for their crops, and at the same time tell us cityfolk when and how much to water our grass. Our photo section is burstingwith color this issue, featuring some amazing pictures of <strong>Oklahoma</strong> foliage.Also included in this issue are the regular features we provide in each editionof <strong>Oklahoma</strong> Climate: a weather summary of the spring <strong>2005</strong> season;horticulture tips for gardeners and urban farmers alike; a classroom activityfor teachers and students involving heatbursts; and safety tips on how toavoid sunburns, and the dangers of not doing so.We at the <strong>Oklahoma</strong> <strong>Climatological</strong> <strong>Survey</strong> hope you enjoy this 8th edition of“<strong>Oklahoma</strong> Climate.” If you have any comments or suggestions, please feelfree to contact me at gmcmanus@mesonet.org.<strong>Oklahoma</strong> Climate<strong>Summer</strong> - <strong>2005</strong>Gary McManus – EditorCover Photo: Photo by Jonathan Benge. If youhave a photo that you would like to be consideredfor the cover of <strong>Oklahoma</strong> Climate, please contactGary McManus at gmcmanus@ou.edu.Table of ContentsThe Heat Wave of 1980..................................3When 15 Minutes Just Isn’t Good Enough.....6Photos From the Field....................................8Blackwell Tornado of 1955..............................10Spring <strong>2005</strong> Climate Summary.....................14Agricultural Weather Watch............................19Urban Farmer..................................................20Evapotranspiration:Another Way to Save Water...........................21Heatbursts....................................................24Classroom Activity..........................................25<strong>Summer</strong> UV Safety.........................................28The <strong>Oklahoma</strong> <strong>Climatological</strong> <strong>Survey</strong> is theState Climate Office for <strong>Oklahoma</strong>Dr. Renee McPherson, Acting DirectorDerek Arndt, Acting State ClimatologistEditorGary McManus, ClimatologistContributorsDerek ArndtChris FiebrichLoren IllstonGary McManusDr. Renee McPhersonAndrea MelvinAlbert SutherlandAndrew ReaderMike WolfinbargerDesignStdrovia BlackburnJohn HumphreyRyan DavisEditorial BoardDerek ArndtStdrovia Blackburn (advisor)Brad IllstonCerry LefflerGary McManusDr. Renee A. McPhersonAndrea MelvinAlbert Sutherland<strong>Oklahoma</strong><strong>Climatological</strong> <strong>Survey</strong> OKLAHOMA CLIMATE SUMMER © Copyright <strong>2005</strong> Board of Regents of the University of <strong>Oklahoma</strong>. All Rights Reserved.
HISTORICAL PERSPECTIVEhe earth, baked for days on end by triple-digit temperatures, becamehard and cracked, while topsoil turned as fine as gossamer. Rain wasfleeting, and <strong>Oklahoma</strong>ns became weary. Beaten upon day after dayby the oppressive sun, crops withered and failed, ponds disappeared,and lakes receded. These are not historical accounts from the Dust Bowl, orof the devastating droughts and heat of the 1950s. This is a chronicle of thesummer heat wave of 1980, remembered by contemporary <strong>Oklahoma</strong>ns as thesummer that would not end.Heat AboundsBy Gary McManus - ClimatologistThe summer of 1980 was not the state’s hottest – the Dust Bowl years of 1934and 1936 were warmer. Nor was it the state’s driest – 1936 and 1954 have thatdubious honor. Just being placed in the same sentence with those summers isindicative of the insufferable conditions faced by the state that year, however.The problem did not lay with the heat itself; <strong>Oklahoma</strong>ns are fully accustomed tosweltering in the summer, biding time until those first cool fronts of fall make theirway down from the north. The defining characteristic of the summer of 1980 wasthe relentlessness of the heat. Healdton reached the century mark 83 times fromJune through September, an astounding 68 percent of the possible days duringthose months. In comparison, the Dust Bowl year of 1934 saw Jefferson hit 100degrees only 70 times, while Hollis did the same 80 times in 1936. For Healdton,the temperature readings first went to triple digits on June 18th, and stayed thatway for a couple of days. After a brief respite, high temperatures skyrocketedinto the 100s again on June 23rd, staying that way for 42 consecutive days untilAugust 3rd. The heat did not end there, unfortunately. Across the state, hightemperatures soared into the 100s as late as September 22nd. At that point,temperatures slowly drifted to more seasonable environs. Finally, a strong coldfront late that month put the final nail in the coffin of the memorable heat wave,the triple-digit temperatures but a memory as <strong>Oklahoma</strong>ns basked in autumn-like50s and 60s for high temperatures.The sea of asphalt that pervades <strong>Oklahoma</strong> City intensified the heat. Recordhigh temperatures for <strong>Oklahoma</strong>’s capital were tied or broken 18 times during1980, and the third-highest temperature ever recorded for <strong>Oklahoma</strong> City wasOKLAHOMA CLIMATE SUMMER <strong>2005</strong>
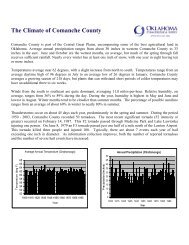
HISTORICAL PERSPECTIVEA map showing typical high temperaturesduring the summer of 1980, from August2nd. On this day, <strong>Oklahoma</strong> City reached itsthird-highest all-time maximum temperatureof 110 degrees.set on August 2nd with a reading of 110 degrees (113 remains<strong>Oklahoma</strong> City’s highest recorded temperature, from July 11,1936). High temperatures of greater than 90 degrees occurredon 71 consecutive days, from June 23rd until September 1st (itshould be noted that after this one day respite, temperatureselevated above 90 degrees once again for 14 consecutivedays).The State WithersAlthough nearly impossible to measure accurately, deaths dueto extreme temperatures were the largest impact of the 1980heat wave. Estimates of up to 80 lives were considered lostdue to heat-related causes. That figure might be conservative,since many brain strokes and heart failures are also due toextreme heat, yet not labeled so. Nationwide, the 1980 heatwave is blamed for 1,250 deaths.As an agricultural state, the impacts on <strong>Oklahoma</strong> wereobviously far-reaching. Poultry producers reported massivelosses as millions of birds were lost, their inability to sweatalong with the added insulation of feathers signing their deathwarrants. The impact to the cattle industry was similar. Asponds dried up and feed fields withered, ranchers were forcedto sell their cattle. The increased volumes of cattle for saledrove prices down, which further exacerbated the cattlemen’scash flow problems.Crops also felt the double-whammy of heat and drought. Thewheat crop, which relies on the weather from September-May more so than the summer months, was the secondlargeston record at that time. It was the row crops, such aspeanuts and cotton, which bore the brunt of the devastation.Enough precipitation fell during spring for the peanut crop tobe planted, but the lack of rain through summer doomed muchof the crop. Many farmers had relied on irrigation in the past tosurvive drought, but even irrigation supplies dwindled by midsummer.Excessive water use quickly became problematic for<strong>Oklahoma</strong> communities. At the height of the summer heat,water shortages struck 273 water systems, which served over350 communities. Theft of water started to have a severeimpact on reserves. A loss of 324,000 gallons to thieves was OKLAHOMA CLIMATE SUMMER <strong>2005</strong>
HISTORICAL PERSPECTIVEThe number of days with hightemperatures of at least 100 degreesfor <strong>Oklahoma</strong> communities duringthe summer of 1980.reported by one community alone. As if the shortages werenot bad enough, the water supply infrastructure had begun todeteriorate as the ground dried out and shifted, breaking pipesand mains. Tulsa was forced to implement water rationing forthe first time in several decades due to diminishing supplies inNot all industries were negatively impacted, however. The saleof air conditions units hit an all-time high in 1980, as orders fornew and refurbished units often met with delays for days onend as supply struggled to keep up with demand.An Author’s ReminiscenceAs a young boy growing up in the small, almost-Panhandletown of Buffalo, I waited impatiently through the coldweather months for the long, hot days of summer. I cancertainly understand that the enjoyment of a perfectly lovely100-degree day is purely in the eye of the beholder. Afterall, there are plenty of misguided souls that think winteris a fabulous time of the year. In the dry environs of thefar northwest, however, the air at sunset always seemedwarmly inviting to me.For all my professed love of <strong>Oklahoma</strong> heat, however, I willnever forget the summer of 1980, when even my enthusiasm fordesert-like conditions dwindled. I was but a boy, of course, andlike most summers of my youth, my bicycle logged many milesbetween my house and the creek. But the fishing expeditionsbecame far less frequent as June became July, and even moreso when July became August. By the time September rolledaround, I was anxious for school to start, where I would beforced to spend my days encased in the deliciously cool airconditioned halls of the Buffalo public school system.OKLAHOMA CLIMATE SUMMER <strong>2005</strong>
WHEN FIFTEEN MINUTES JUST ISN’T GOOD ENOUGHBy Dr. Renee McPherson, Chris Fiebrich, and Mike Wolfinbarger -Completed by the <strong>Oklahoma</strong> Mesonet TeamAt the beginningof the year, the<strong>Oklahoma</strong> Mesonetwon a special awardfrom the AmericanMeteorological Societyfor “serving <strong>Oklahoma</strong>and the meteorological communityby providing high-quality data andinformation used to protect lives, reducecosts, facilitate cutting-edge research,and educate the next generation.” Thisaward and others were earned throughhard work, long hours, and dedicationfrom a team of state employees andtheir partners throughout <strong>Oklahoma</strong>. Itdemonstrated that <strong>Oklahoma</strong> values,knowledge, and experience indeedlead to cutting-edge solutions to issuesaffecting every <strong>Oklahoma</strong>n.Even as this award was beingannounced, the <strong>Oklahoma</strong> Mesonetteam continued to strive toward newgoals, new innovations, and newservices for <strong>Oklahoma</strong>ns. The largestnew target for the Mesonet team wasto provide our customers, especiallythose who protect the public, with moredata even faster than before.It is not a trivial task to reduce thetime it takes to collect, quality assure,and distribute more than 1 millionobservations per day from every cornerof the state. First, through funding fromthe <strong>Oklahoma</strong> State Regents for HigherEducation, the Mesonet techniciansupgraded more than 250 radios acrossthe state. These radios were foundin fields near the end of dirt roads, insheriff’s offices of towns that mostpeople don’t know exist, and on tallrepeaters that are visited regularly onlyby birds. If you live in <strong>Oklahoma</strong>, there’sa Mesonet radio that was upgradedwithin 10 miles of your house.With the upgrade of the radios, theMesonet could receive observationsfrom the measurement stations faster.Before, computers could ‘overhear’both radios from southwest <strong>Oklahoma</strong>and radios from western <strong>Oklahoma</strong> OKLAHOMA CLIMATE SUMMER <strong>2005</strong>
OCS FEATURE ARTICLEwhen they ‘spoke’ at the same time.The computers couldn’t understandboth conversations, so the radioswould have to take turns, slowing downthe communication process. Now theradios in neighboring regions of thestate can communicate at the sametime without confusing the computers.As a result, data now arrive twice asfast as before –– in about 3 minutesfrom all 117 Mesonet sites.Because the data could be sent inless than 5 minutes, the original, 15-minute transfer of Mesonet data wasscrapped after 11 years in operation.Now the measurements are sent every5 minutes –– all through the <strong>Oklahoma</strong>Law Enforcement TelecommunicationsSystem without any negative impact.After the data arrived at the centralcollection point in Norman every5 minutes, then the data neededto be processed faster to arrive atgovernment agencies before the next5-minute observation was sent. Fastercomputers were purchased, softwarewas optimized for speed, and a new,simpler database was implemented. Asa result, the process to quality-assurethe incoming data was reduced from7–10 minutes to about 2 minutes.Almost as exciting as this fantasticupgrade was that it occurred withoutbringing the system down or disruptingthe flow of data. And at the same time,regular Mesonet operations continued:sensors were calibrated, maintenancewas conducted, and products wereprovided to both government agenciesand individuals alike.Hey, it’s 4:40 PM! You should go towww.mesonet.org and view the 4:35PM air temperature for your county. Youlive in the only place in the world wheresomeone can do that today.ANSWERS TO CLASSROOM ACTIVITY (pg 25):1. Approx. 11:15 p.m. Mangum2. Cheyenne (Pulse 2) - 70°F – 62°F = 8°F,Hobart - 68°F – 64°F = 4°F, Mangum – 68°F – 59°F = 9°F,3. Cheyenne (Pulse 1) - 58°F – 47°F = 11°F4. Hobart 68mph gust with 55 mph sustained5. Hobart with 5 pulses6. 3:30 a.m. at CheyenneOKLAHOMA CLIMATE SUMMER <strong>2005</strong>
PHOTOS FROM THE FIELDPHOTOS FROM THE FIELDTop Photo:Adult Carolina Mantis on a Purple Coneflower(photo courtesy of Lauren Illston)Left Photo:Purple Prairie Clover and Yellow Gaillardia(photo courtesy of Lauren Illston)Bottom Photo:Orange Poppy(photo courtesy of Lauren Illston) OKLAHOMA CLIMATE SUMMER <strong>2005</strong>
Top Photo:PHOTOS FROM THE FIELDSaucer Magnolia(photo courtesy of Lauren Illston)Bottom Left Photo:Grass of some kind(photo courtesy of Lauren Illston)Bottom Right Photo:Nymph preying mantis on a sunflower(photo courtesy of Lauren Illston)OKLAHOMA CLIMATE CLIMATE SUMMER <strong>2005</strong> <strong>2005</strong>
BlackwellTornado of 1 955SBy: Derek ArndtActing State Climatologisthortly after 9 o’clock the evening of May 25th, 1955, Alma Hutton washed clothes in her home on the south side ofBlackwell, keeping up with the never-ending demands placed on a mother of five children. The lightning and thunderthat Wednesday night was all-too-familiar, for it had been a stormy week in Blackwell. Just that afternoon, a windand-hailstorm claimed the plate-glass storefront windows of the J.C. Penney’s and Central National Bank. As yet anotherstorm shot northward toward Blackwell, few knew that it had produced a tornado just north of Tonkawa, about ninemiles away.Within minutes, huge hailstones fell all around the Huttons’ house. Softball-sized meteors crashed from the skythroughout town, escorted by violent winds. Then Mrs. Hutton heard an unmistakable roar, and knew exactlywhat it was. She shepherded her kids into the dining room. “I grabbed Betty [the youngest] and we all heldon to the table and each other for what seemed like forever,” she recalls. Chaos reigned just outside theirwalls for the next few minutes.When the violence had stopped, the family peered outside. An old and mighty cottonwood tree thatonce shaded their front yard now lay sideways in it. Their house still stood, but it was obviousthat something terrible had happened just blocks to their east. Broken trees and broken houseslittered the streets. A fire burned here and there, but the rest of the town had gone dark. In theconfusion, one thing was clear: many of their neighbors had lost their homes and neededhelp.Thursday morning’s sun gave scope to Wednesday night’s confusion. The east side oftown was gone.10 OKLAHOMA CLIMATE SUMMER <strong>2005</strong>
OCS FEATURE ARTICLEThe tornado took with it much of Blackwell’s past,and some of its future, as it roared northwardacross the Chikaskia River and into the countryside.Twenty-one people lost their lives in and around thetown, and more than forty city blocks were completelyleveled. Just as many homes were heavily damaged.The storm’s worst was spent in the eastern portionsof town, particularly the Riverside district, where entirehouses were gone. A Daily <strong>Oklahoma</strong>n report from thescene described the eastern half of Blackwell as “a massof kindling wood, mattresses and springs” where housesonce stood. Trees, lumber and debris piled ten feet highon some streets.The storm destroyed nearly 200 homes and ten businessesin Blackwell, plus a handful of homes in Tonkawa and nearBraman. Almost 150 additional homes and 18 businessessuffered irreparable damage. Nearly 500 more buildings werein need of repair. Three hundred people in Blackwell sufferedserious injuries. The death toll of 21, while horrific, seemedimpossibly small to any who witnessed the destruction first-hand.Most of the fatalities occurred in a three-block area just east ofD Street. Years later, based on photos and damage assessment,the tornado was classified as F5 in this part of town.One of the storm’s final casualties in Blackwell was the Hazel-Atlasglass plant, near the Chickaskia River on the northeast side of town.The plant was a large, round-the-clock operation most of the year,and more than 70 workers were in the building when it took on thetornado. The building was heavily damaged by the storm; amazingly,nobody at the plant was seriously injured. However, fire from the largekilns spread quickly through building and the plant burned until only thesmokestack stood over the charred rubble. Many Blackwell residentsreported seeing fire within the tornado, presumably from the Hazel-Atlasovens.Fig. 1Gene Holcomb, local Red Cross volunteer, and two Red Crossnurses from <strong>Oklahoma</strong> City stand in front of Holcomb_s stormdamagedgrocery store on East Bridge Avenue in Blackwell.Photo courtesy of the Blackwell Journal-Tribune.Fig. 2Steve Lambert of Blackwell made a delivery to Bramanin this Singer Sewing Machine Co. van just hours beforethe tornado struck the Lambert home in Blackwell.Photo courtesy of the Blackwell Journal-Tribune.Fig. 3One of the casualties of the 1955 tornado in Blackwellwas Riverside School. After the tornado, a new school,Parkside Center, was built. Photo courtesy of theBlackwell Journal-Tribune.OKLAHOMA CLIMATE SUMMER <strong>2005</strong> <strong>2005</strong> 11 11
The heavily damaged Riverside Hospital’s abilityto accommodate new patients was severelylimited, despite heroic efforts from doctorsand nurses there. Blackwell General Hospitalsoon overflowed with patients. Triage centersand shelters at the First Baptist Church and theArmory provided services and housing to dozens ofresidents. The Riverside school lost its roof and wasdemolished that summer. Rescue workers from allover <strong>Oklahoma</strong> used tractors and heavy equipmentto clear roads and lots in the hunt for victims. NationalGuardsmen patrolled the streets, issuing passes tocurtail looting and rubbernecking.Two days after the storm, Mother Nature added insult toinjury when heavy rains just across the Kansas borderswelled the Chikaskia River. The river engulfed manyblocks of the devastated Riverside district, and chasedaway rescuers, residents and most of what little remainedafter the storm.The economic impact on Blackwell was staggering. Thetornado, fires, and flood caused more than $8,000,000 (1955dollars) in damage within the city’s borders, twenty times theamount of the previous “big tornado” that struck the town inApril 1929. The Hazel-Atlas plant, which had expanded over theyears to fill two city blocks, was a total loss. It never reopened,and hundred of jobs slipped away. The Acme Foundry sufferedheavy damage, but its operators rebuilt, sparing 175 jobs.Fig. 5This two-story home on East Furguson Avenue inBlackwell was damaged by the tornado that devastatedeastern portions of the city. Photo courtesy of theBlackwell Journal-Tribune.Fig. 4A mangled car testifies to the destructive power of an F5 tornado.Photo courtesy of the Blackwell Journal-Tribune.12 OKLAHOMA CLIMATE SUMMER <strong>2005</strong>
Fig. 6Blackwell Red Cross volunteer Gene Holcomb celebrates his birthdayin the midst of the destruction. Photo courtesy of the Blackwell Journal-Tribune.The Blackwell storm was just one of dozens of tornadoes in oneof the century’s biggest severe weather outbreaks in the SouthernPlains. Three separate waves of severe weather carried a 36-hourrampage from west Texas, across <strong>Oklahoma</strong> and the SouthernPlains. Hours before the catastrophe in Blackwell, a tornadicthunderstorm near Sterling City, Texas, knocked a U.S. Air Force B-37 out of the sky. The plane, on a training mission out of Walker AirForce Base in Roswell, New Mexico, went down in flames. All 15 airmenwere killed, and the planes four engines were found 25 miles from thescene of the crash. A few hours later, an <strong>Oklahoma</strong> husband and wife losttheir lives when a long-track tornado crossed the state line from Shamrock,Texas, and into their farm home near Cheyenne. A woman and her child wereinjured by a tornadic storm the next afternoon in Sallisaw. Nebraska, Missouriand Arkansas each saw three tornadoes on the second day of the outbreak.But the worst of the entire outbreak occurred in tiny Udall, Kansas. The samestorm that leveled eastern Blackwell generated a new long-track tornado as itcrossed the <strong>Oklahoma</strong>-Kansas border. It killed a family of five in a farmhouse nearOxford, Kansas, before engulfing the entire town of Udall within its mile-wide funnel.Seventy-seven of the town’s 500 residents were killed, and just about every survivorsuffered injuries of some sort. Only three businesses were left standing. This tornadowas also retroactively rated an F5. Less than one out of a hundred tornadoes receive anF5 rating. For the same storm to generate two of these top-end tornadoes is exceedinglyrare.The towns of Udall and Blackwell recently commemorated the 50-year anniversary of theirtornadoes. Survivors and their descendants dedicated a memorial marker in Blackwell’sMemorial Park. Udall residents read the names of each of their 77 victims from a memorial inUdall City Park.Special thanks to Korina Atchley of the Blackwell-Tribune-Review for her generous help.OKLAHOMA CLIMATE SUMMER <strong>2005</strong> <strong>2005</strong> 13 13
SPRING <strong>2005</strong> SUMMARYBy: Gary McManusSignificant drought conditions found their beginnings during the springof <strong>2005</strong>, which ranked as the 2nd driest such period since 1895 forthe state of <strong>Oklahoma</strong>. The lack of rain was most severe in a northsouthcorridor though the center of the state, but virtually all areaswere overwhelmingly dry during the season. Precipitation was not theonly weather attribute that was lacking; for the first time since accuratetornado statistics began in 1950, the state of <strong>Oklahoma</strong> went withouta confirmed tornado touchdown during the month of May. The total forthe season as a whole ended at 15, well below the average tornadocount of 35.PrecipitationA deficit of well over six inches plagued the state during the springmonths. Without question, the hardest hit areas centered on central<strong>Oklahoma</strong> and radiated outwards from there. The final tallies aredepressingly meager, with south central and central areas beingmore than eight inches below normal for the three-month period,ranking as the 1st and 3rd driest springs on record for those twoareas, respectively. In actuality, however, all of <strong>Oklahoma</strong> suffereda significantly dry spring, save for the far western reaches of thePanhandle. The dry weather actually began in late February, gaineda foothold in a relatively dry March, and plunged ahead full steam inApril and May. Only three of 116 <strong>Oklahoma</strong> Mesonet stations activeduring all three spring months approached double-digit precipitationtotals during spring – Cookson, Mt. Herman and Sallisaw, the latter ofwhich failed to actually break the ten-inch barrier. A swath of the statefrom Woods County northeastward through Alfalfa County were limitedto approximately two inches.TemperatureThe statewide-averaged temperature finished near normal for thespring. Generally, central and western <strong>Oklahoma</strong> were a bit warmerthan normal, and eastern <strong>Oklahoma</strong> and the Panhandle were a bitcooler than normal. As it works out, those areas with low precipitationwere warmer, and the areas with more precipitation were a bit cooler.The year’s first significant bout with heat occurred in late May, whennearly 50 records were broken throughout the state. The season’s lastfreeze occurred in northwestern <strong>Oklahoma</strong> on May 4th. The lowesttemperature of the spring, 11 degrees, was recorded at Boise City onthe 11th, and the highest temperature, 103 degrees, occurred at Altusand Grandfield on May 22nd.March Daily HighlightsMarch 1-6: The month’s first six days found the state enjoyingrather uneventful weather. Temperatures were seasonable, forthe most part. There were a few instances of precipitation, butany organized rainfall stayed on the periphery of the state’sborders. The winds picked up on the 6th with the approach ofan upper-level disturbance from the west. Gusts of over 30 mphwere reported in western sections of the state.March 7-12: A cold front entered the state on the 7th, generatinga thin band of light rain. Rainfall amounts were light, with theMesonet site at Sallisaw leading the way at a paltry 0.32 inches.Temperatures did not fall far after the frontal passage, but thewinds charged in from the north at over 30 mph, with gustsreported in the northern half of the state of 50 mph. The weatherbecame much more pleasant the proceeding days, culminating ina very pleasant day on the 12th.March 13-17: The main highlight of this period was the surprisesnowstorm that buried parts of extreme western <strong>Oklahoma</strong>under a half of a foot of snow on the 15th. An accumulation ofseven inches was reported in Durham, and a six inch amountwas reported in Reydon. Lesser amounts were reported fanningoutward from there. Ground temperatures of up to 50 degreesmade quick work of the snow, and light rain was the ruleelsewhere.March 18-21: Spring arrived with a flourish on the 20th, assevere thunderstorms plagued the state for the last two days ofthis period. Locations in Hughes, Seminole, and PottawatomieCounties reported rain between one and two inches, and the<strong>Oklahoma</strong> Meosnet site at Bowlegs recorded nearly three inchesof rain. Those same storms spawned two tornadoes, althoughboth were of the “weak” variety. Two more weak tornadoes werereported in Alfalfa County near Amorita and Byron, respectively.March 22-27: The exit of the upper-level low pressure systemto the east preceded improving weather conditions. Low clouds,cool temperatures and drizzle on the 22nd gave way to highsin the 70s by the 24th. Unfortunately, the warmer weather wasaccompanied by more severe thunderstorms, although nothingto the extent of what occurred on the 21st. Large hail was themain severe threat with these storms, with quarter-sized hailreported near Garber in Garfield County. Cooler weather tookhold for the next three days, a bit unseasonable with highs in the50s and 60s.March 28-31: The month’s final four days were much morespring-like than the preceding few days. Highs in the 70s and80s on the 28th, along with low humidity and strong southerlywinds, prompted fire danger warnings across the state. Windsgusted to over 40 mph on the 29th as well. A cold front enteredthe state on the month’s final day, bringing with it a few scatteredthunderstorms and wind gusts over 40 mph in the northwest. Theheaviest rainfall was reported from far southeastern <strong>Oklahoma</strong>;the <strong>Oklahoma</strong> Mesonet site at Wilburton recorded just underthree-quarters of an inch.April Daily HighlightsApril 1-4: A bit of rain generated from an upper-level stormstarted the month off on the right foot. Eastern <strong>Oklahoma</strong> was themain target of these wayward showers in a month that ended sodry. Even so, the precipitation totals failed to reach three-quartersof an inch. Pleasant weather was in store throughout this periodotherwise, if not a bit windy. By the 4th, surface low pressurein the Panhandle kicked up winds from the south with gusts ofover 30 mph. Dangerous fire conditions were exacerbated byunusually high temperatures.April 5-6: Rain and cooler weather descended on the statefor the next two days, in addition to some fairly stout severeweather. Showers and storms formed along a dryline in eastcentral <strong>Oklahoma</strong> on the 5th, with some of those storms quicklybecoming severe. Three weak tornadoes touched down in Latimerand Sequoyah counties, with no official reports of damage.Teacup size hail was reported in Tulsa, and winds of over 80 mphdamaged out buildings in the Kinta area.April 7-11: A ridge of high pressure built in after the previous coldfront’s passage. Temperatures remained seasonable, however,with highs in the 70s. The weather remained nice through the10th, when an upper-level storm returned winds from thesouth, ushering in abundant moisture from the Gulf of Mexico.With added fuel, thunderstorms fired along a dryline in central14 OKLAHOMA CLIMATE SUMMER <strong>2005</strong>
SPRING <strong>2005</strong> SUMMARY<strong>Oklahoma</strong> that evening. A weak tornado touched down brieflyfour miles southwest of Harrah in <strong>Oklahoma</strong> County, damagingutility lines.April 12-19: The period stated clear and cool. Lows on the 12thfell into the 30s and 40s, but clear skies and abundant sunshineduring the afternoon allowed temperatures to climb into the 70sand 80s. The weather remained in that mode for the main bodyof the state, with a few bouts of storms occurring in the <strong>Oklahoma</strong>panhandle on the 15th and 17th. An upper-level storm traveledover the state on that day, triggering a round of showers andthunderstorms for southwestern <strong>Oklahoma</strong>.April 20-21: A return of warm, humid air signaled a return ofstorminess to the area. The storms began that afternoon insouthwestern <strong>Oklahoma</strong>, with damaging winds and large hail.Jackson County was particularly hard hit, with winds of over70 mph being reported, and hail to the size of golfballs. Stormsstruck the northeast corner of the state on the 21st as a cold frontmoved through the state. Once again, damaging winds and largehail were on tap. Two weak tornadoes were reported to havetouched down in Rogers and Wagoner counties with no officialreports of damage.April 22-24: With the cold front’s arrival, cool and dry air replacedthe humid airmass of the previous two days. A rainless period,temperatures remained below normal throughout the state. Lowson the 24th were in the 30s, and several locations experienceda late freeze. The Mesonet sites at Oilton and Jay reached arelatively bone-chilling 28 degrees. Highs on the 24th struggledto reach 60 degrees for much of the state.April 25-30: The month’s final six days were cool, with somemoisture falling in parts of the state. Storms struck eastern<strong>Oklahoma</strong> on the 25th, and temperatures remained cool withlows in the 30s and 40s. Highs that day managed to climb intothe 70s in central <strong>Oklahoma</strong>, but remained in the 50s and 60sin the northern sections of the state. Once again, large hail andstrong winds were the main hazards associated with the storms.Reports of half-dollar size hail were made in McAlester, and winddamage was reported in LeFlore County.. The month’s final fewdays were cool and mostly cloudy. Highs in northern <strong>Oklahoma</strong>were unseasonably cool, some 15-25 degrees below normal.May Daily HighlightsMay 1-5: Cloudy and cool conditions dominated the month’sfirst five days. The heaviest rain was concentrated in the weston the 2nd,. The month’s last freezing temperatures occurred inthe northwest on the 4th; Buffalo fell to 31 degrees and severalother <strong>Oklahoma</strong> Mesonet stations recorded 32 degrees. Hightemperatures were unseasonably cool throughout this period,struggling to reach 70 degrees. Antlers recorded the highesttemperature of the period at 75 degrees on the 1st.May 6-11: Temperatures became more spring-like during thisperiod, and at times approached early-summer levels. Rainfallwas spotty, other than a well-organized system of storms on the8th. Temperatures had reached a muggy 90 degrees and beyondby the 8th, staying that way throughout the end of the period.Prompted by an upper-level storm system to the west, southerlywinds kicked up to near 40 mph in western <strong>Oklahoma</strong>.May 12-15: A cold front entered northwestern <strong>Oklahoma</strong> on the12th, stalling out and providing a chance for rain the next threedays. Hail up to two inches in diameter fell in Harper County nearLaverne on the 12th, and a 90 mph wind gust was reported westof Martha in Jackson County the following day. After that stormyperiod, the state enjoyed tranquil weather for a couple of days.Surface high pressure dominated, with highs in primarily in the70s and 80s.May 16-22: The ridge of high pressure lingered across the stateon the 16th and 17th, providing the state with pleasant spring-likeconditions. An upper-level storm approached overnight on the18th, bringing thick cloud cover along with it. Showers and stormson the 19th brought beneficial rainfall to north central <strong>Oklahoma</strong>.The May 20th-22nd amounted to the hottest weather seen in thestate since September, 2004. Fifty records for heat were eithertied or broken at various locations around <strong>Oklahoma</strong> according toNational Weather Service data. Temperatures climbed into tripledigitterritory across a significant portion of the state all threedays. The state’s highest temperature of the month, 103 degrees,occurred at both Altus and Grandfield on the 22nd.May 23-25: A stationary front generated showers andthunderstorms in north central <strong>Oklahoma</strong> on the morning of the23rd. More severe weather was in store on the 24th, as stormsfired up in the high plains of Kansas and Colorado and madetheir way southeast into the state. The hardest hit area was thenortheast, where flooding due to heavy rainfall was exacerbatedby tennis ball size hail and winds of at least 70 mph. Localesnorth of the front had highs in the 80s, while south of the fronttemperatures soared into the upper 90s and 100s. On the 25th,however, highs across nearly the entire state remained in the80s.May 26-31: The month’s final 6 days were similar to the firstfive; cloudy, below normal temperatures and plenty of rain forselect portions of the state. A cool front which passed through thestate early morning on the 26th triggered showers and stormsin northwestern <strong>Oklahoma</strong>, which later moved into central andsouthwestern parts of the state. Heavy storms finished off themonth with a nice soaking rain the southwestern <strong>Oklahoma</strong>.Daytime highs behind the front on the 31st remained in the 60sand 70s, 10-20 degrees below normal for that time of the year.Spring <strong>2005</strong> Statewide ExtremesDescription Extreme Station DateHigh Temperature 103ºF Altus,GrandfieldSpring <strong>2005</strong> Statewide StatisticsMay 22ndLow Temperature 11ºF Boise City March 16thHigh Precipitation 11.14 in. CooksonLow Precipitation 1.93 in. CherokeeAverage Depart. Rank (1892-<strong>2005</strong>)Temperature 58.8ºF -0.3ºF 52nd WarmestTotal Depart. Rank (1892-<strong>2005</strong>)Precipitation 5.20 in. -0.63 in. 2nd DriestOKLAHOMA CLIMATE SUMMER <strong>2005</strong> 15
SPRING <strong>2005</strong> SUMMARYObserved RainfallRainfall Departure from Normal16 OKLAHOMA CLIMATE SUMMER <strong>2005</strong>
SPRING <strong>2005</strong> SUMMARYAverage TemperatureTemperature Departure from NormalOKLAHOMA CLIMATE SUMMER <strong>2005</strong> 17
SPRING <strong>2005</strong> SUMMARYSpring <strong>2005</strong> Mesonet Precipitation ComparisonClimate DivisionPrecipitation(inches)Departure fromNormal (inches) Rank since 1895Wettest onRecord (Year)Driest on Record(Year) 2004Panhandle 4.56 -2.29 34th Driest 13.27 (1957) 1.15 (1966) 5.12North Central 3.38 -6.98 3rd Driest 21.31 (1957) 1.77 (1895) 9.50Northeast 6.50 -6.65 6th Driest 25.15 (1957) 3.12 (1895) 14.75West Central 4.87 -5.03 11th Driest 19.30 (1957) 1.86 (1971) 8.18Central 3.99 -8.41 3rd Driest 22.89 (1957) 3.74 (1932) 9.05East Central 7.48 -6.83 4th Driest 30.36 (1990) 4.49 (1936) 12.69Southwest 4.71 -5.19 7th Driest 20.48 (1957) 3.28 (1971) 6.81South Central 4.48 -8.43 1st Driest 27.30 (1957) 5.07 (1896) 8.16Southeast 7.80 -7.53 3rd Driest 30.18 (1990) 7.12 (1936) 10.81Statewide 5.20 -6.48 2nd Driest (1957) 4.89 (1895) 9.47Spring <strong>2005</strong> Mesonet Temperature ComparisonClimate DivisionAverage Temp(F)Departure fromNormal (F) Rank since 1895Hottest onRecord (Year)Coldest onRecord (Year) 2004Panhandle 54.8 -0.5 49th Warmest 59.5 (1963) 49.4 (1915) 59.1North Central 58.2 0.5 40th Warmest 61.6 (1963) 52.8 (1924) 60.4Northeast 58.2 -0.4 51st Warmest 61.7 (1977) 53.5 (1924) 60.8West Central 58.3 0.3 48th Warmest 61.9 (1963) 52.9 (1915) 61.4Central 59.5 0.0 42nd Warmest 63.1 (1974) 54.5 (1924) 62.1East Central 59.0 -1.0 41st Coolest 63.7 (1974) 55.1 (1931) 62.9Southwest 60.1 -0.4 51st Warmest 64.4 (1963) 55.1 (1915) 63.5South Central 61.2 -0.2 55th Warmest 65.0 (1974) 56.5 (1931) 63.8Southeast 59.9 -0.8 34th Coolest 64.3 (1938) 56.8 (1924) 62.1Statewide 58.8 -0.3 52nd Warmest 62.5 (1974) 54.3 (1924) 61.8Spring <strong>2005</strong> Mesonet ExtremesClimateDivisionHighTemp Day StationLowTemp Day StationHighMonthlyRainfallStationHighDailyRainfall Day StationPanhandle 101 May 21st Hooker 11 Mar 16th Boise City 5.72 Buffalo 1.49 May 29th Boise CityNorth Central 101 May 22nd Fairview 19 Mar 1st Blackwell 5.27 May Ranch 1.77 May 19th NewkirkNortheast 94 May 21st Pawnee 17 Mar 1st Foraker 8.97 Copan 3.76 May 19th BurbankWest Central 99 May 22nd Weatherford 23 Mar 2nd Butler 6.02 Cheyenne 1.93 May 13th WatongaCentral 101 May 22nd Kingfisher 18 Mar 1st Oilton 6.19 Bristow 3.17 May 13th StillwaterEast Central 95 May 22nd Calvin 20 Mar 1st Westville 11.04 Cookson 2.89 May 24th SallisawSouthwest 103 May 22nd Grandfield 22 Mar 17th Mangum 6.98 Hollis 1.86 May 13th WaltersSouth Central 100 May 22nd Burneyville 22 Mar 17th Sulphur 8.09 Lane 3.14 May 31st RinglingSoutheast 96 May 22nd Antlers 22 Mar 17th Antlers 10.21 Mt Herman 2.08 May 29th Broken BowStatewide 103 May 22nd Grandfield 11 Mar 16th Boise City 11.04 Cookson 3.76 May 19th Burbank18 OKLAHOMA CLIMATE SUMMER <strong>2005</strong>
Farming in <strong>Oklahoma</strong> is like acontinuous ride on a rollercoaster. Just when a farmerthinks it is time to relax, the weathercrests at the top of one trend anddives down into another.Keeping to the <strong>Oklahoma</strong> normal ofseldom being normal, wheat plantswent from a winter of water plenty toa spring of water stress. Farmersanxiously checked weather forecaststhis spring, only to be disappointedover and over again as sparse rain fellin much of the <strong>Oklahoma</strong> and otherstates in the Great Plains wheat belt.From a distance, the ripening wheatfields in late May were a beautifulsight with the rich promise of a lushharvest. Unfortunately once out inmost wheat fields, it was easy to seethe wheat heads were filled withshriveled wheat kernels. This willlead to lower kernel quality andwheat with low test weights. Toomany <strong>Oklahoma</strong> farmers will seelower yields and less than normalquality, leaving them feeling likethey’re hurtling down the track withno upturn in sight.Farmers to the east fared a littlebetter, with a few more rains to helpsustain pastures as the spring rolledalong. Still even for eastern<strong>Oklahoma</strong> farmers, over the last 90days much of eastern <strong>Oklahoma</strong> hashad only 60% or less of their normalrainfall.The downturn for <strong>Oklahoma</strong>farmers looks like it will beshared by farmers in other majorUSA crop regions. Cold, wetweather across the corn belt hasmade for a lot of replanting. Thenorthwestern USA is in a severedrought situation. Over much ofthe central USA rain has been inshort supply, raising concernsthat there will be a lack ofsufficient rainfall for crop growthin this major agriculturalproduction region in <strong>2005</strong>.By Albert Sutherland, CPH, CCAMesonet Assistant Extension Specialist<strong>Oklahoma</strong> State UniversityAs of late May, row crop plantingand emergence was running about aweek behind a more typical year.Just when warm weather looked likeit was pushing the crop ahead inmid-May, the weather turned cooland rainy delaying crop planting andslowing seedling emergence.While it is easy to be overlypessimistic when the roller coasteris heading downward, it looks likefarm gross receipts and thus, netfarm income will be down this yearfor <strong>Oklahoma</strong> farmers. Growers arelikely to be hit with the doublejeopardy of lower grain yields andhigher energy costs. We can onlyhope the cattle market continues toremain strong and that other cropscan offset some of the early <strong>2005</strong>crop losses. We may yet see theroller coaster climbing to newheights, just when it is leastexpected.Please, check out the <strong>Oklahoma</strong>Mesonet agricultural website,<strong>Oklahoma</strong> AgWeather athttp://agweather.mesonet.org. Ifyou have any questions orcomments about the <strong>Oklahoma</strong>AgWeather site, please, contactAlbert Sutherland by phone at405-224-2216 or by email atalbert.sutherland@okstate.edu.OKLAHOMA CLIMATE SUMMER <strong>2005</strong> 19
AGRICULTUREJune• Fertilize turfgrass areas. Apply fertilizerahead of a good rain or before wateringlawn areas.• Control broadleaf lawn weeds with aproduct containing 2,4-D type herbicideson days when the air temperature staysbelow 90°F and the wind will not causedrift to nearby landscape plants. For bestresults, apply on days following a goodrain or watering.• Control young crabgrass plants witha MSMA product when daytime airtemperatures are above 80°F and below90°F.• During times of high humidity and warmnights, apply an approved fungicide on tallfescue to control brown patch disease.• Mulch flower and shrub beds. Use finermulches around flowers and coarser barkmulches for shrubs and trees. Leave agap between a plant’s main stem or trunkand the mulch.• Keep an eye out for powdery mildew onornamental plants and treat as needed.• Control rose black spot with an approvedfungicide.• Take out weeds while they are still small.The larger the weed the more work itcauses the gardener.• Apply an approved fungicide for thepine needle blight disease, DothistromaNeedle Blight.• Check plants for sucking insect pests andtreat as needed.July• Spray dormant oil to control insect pestson ornamentals and fruit trees. Applywhen the daytime temperature is above50∞F and the nighttime temperaturesabove freezing for 3-4 days. Use thesummer rate for evergreen shrubs.• Roundup can be applied to dormantbermudagrass areas to control greenwinter weeds. For best results, apply ona day when the air temperature will be inthe upper 40s or higher.• Prune trees that are prone to excessivesap flow. These include pines, willows,elms, and maples. Do NOT apply pruningpaint. It will not stop excessive sap flowand will slow callous growth over branchcuts.• Plan spring landscape projects.• Peruse plant and seed catalogs orwebsites. These colorful catalogs andwebsites will provide you many ideas forlandscape projects and brighten a coldweekend.• Collect seed trays, media, and seeds tostart transplants. Start seeds for hardyherbs (cilantro, dill, parsley) and hardyvegetables (broccoli, cabbage, onion) tobe transplanted after mid-March.• Water, water, water.• Control lawn white grubs with an approvedinsect growth hormone or systemicinsecticide product.• If needed, light pruning of ornamentaltrees and pines can be done. The heat ofJuly will help reduce sap flow from branchcuts. Make your pruning cuts on thebranch side of the branch collar to hastencallus growth over the cut surface.• Continue treatments for rose black spotwith an approved fungicide.• Check plants for spider mites and treatbefore populations get too high.• Divide and replant hybrid iris.• Harvest garden vegetables in themorning.• Prepare and plant the fall vegetablegarden. This is the month to plantfrost sensitive vegetables, such assweet corn, cilantro, pepper, andsummer squash.August• Keep up with water demand. Consider thewhether you want to add a drip or sprinklerirrigation systems for the garden or lawnwatering.• If you missed white grub control in Julyand you still need to treat for grubs, itis better to use an approved fast actinginsecticide when treating in August.• Plan for new plantings with water efficiencyin mind. Plan to group plants with similarwater needs together. Consider reservingareas closer to the water valve for highwater demand plants.• With children returning to school, trimshrubs or trees as needed to improvedriver visibility.• Continue control of rose black spot withan approved fungicide.• Add plants to the fall vegetable garden.You can plant cucumber, beet, broccoli,cabbage, Chinese cabbage, carrotscauliflower, collards, Irish potatoes, leaflettuce, parsnip, green peas, radish, Swisschard, and turnip.• Prepare new garden areas by watering,spraying weeds with glyphosate, waiting7-10 days, and then tilling the area.• If a moderate to heavy rain event occurs,check pecan trees for emerging pecanweevil.20 OKLAHOMA CLIMATE SUMMER <strong>2005</strong>
B y A l b e r t S u t h e r l a n dA N ew Wa y t o S a ve Wa t e rs we know in <strong>Oklahoma</strong>, water is aprecious resource. It is sometimes easyto fall into complacency about water with<strong>Oklahoma</strong>’s dependable urban and ruraldelivery systems. But when water is in shortsupply, it can have dramatic consequences onmunicipal use and crop production.OKLAHOMA CLIMATE SUMMER <strong>2005</strong> 21
FEATURE ARTICLEThe <strong>Oklahoma</strong> Mesonet has a new set of tools to help ruraland urban water users be more efficient. This set of tools isknown as the <strong>Oklahoma</strong> Mesonet Evapotranspiration Models.Farmers now have models for alfalfa, corn, cotton, grass hay,peanut, sorghum, soybean and wheat. Horticultural producerscan use the models to schedule irrigations for grape, peach,pecan, tomato or watermelon. For urban use, there are modelsfor cool or warm season turfgrasses.Evapotranspiration, now that’s a mouthful of a word.Evapotranspiration is the term used for the combined waterloss from the soil surface and plant leaves. The “evapo” inevapotranspiration is for water evaporation from a soil surface.The “transpiration” ending is for the water that a plant takes upby its roots and loses through its leaves.Once you get comfortable with evapotranspiration, you’ll findit offers a whole new way to consider watering. <strong>Oklahoma</strong>evapotranspiration water loss is calculated from air temperature,relative humidity, wind, and sunlight values from the nearest<strong>Oklahoma</strong> Mesonet tower. So as the weather changes, sodoes the evapotranspiration rate. Evapotranspiration rates arealso adjusted to best estimate water loss for each agronomicor horticultural commodity.By irrigating based on evapotranspiration, water can be suppliedin the right quantity just as the plant needs it. Additionally, waterusers move from a calendar or guess approach to a weatherbasedwatering method. This means water is replaced whenand in the amount needed by the plant to maintain healthygrowth. This avoids water waste from over-watering and waterstress from mistiming or under-applying the water needed.Access to all the new Evapotranspiration Models is FREEvia the Internet. Simply go to the <strong>Oklahoma</strong> AgWeatherwebsite at http://agweather.mesonet.org. Click on “CROPS”for agronomic commodities or choose “HORTICULTURE”for consumer and commercial horticulture use. Under eachcommodity, select “Evapotranspiration.”Once you’re on the evapotranspiration page for the cropdesired, select the closest <strong>Oklahoma</strong> Mesonet tower,commodity type or maturity, the “Relative Maturity Days,” ifknown, and “Planting Date or Season Start Date.” There aredefault settings for relative maturity and planting dates thatcan be used if exact crop information is not known. Lastly, clickon the “Get commodity Data” button. A table will appear withvalues calculated from the information entered for the cropand field.The Evapotranspiration Model table has eight columns. Thesecolumns are:StationDateNumber of DaysEvapotranspirationAccumulatedEvapotranspirationRainfallAccumulatedRainfallWater BalanceMesonet tower codeCalendar date going backwards in timeCount of days going backwards in timeWater loss for each day in inches of waterCumulative water loss in inches of waterInches of rainfall recorded at the <strong>Oklahoma</strong>Mesonet tower selectedCumulative rainfall in inches of waterAccumulated Rainfall subtracted fromAccumulated Evapotranspiration in inchesof waterPhoto courtesy of Al Sutherland22 OKLAHOMA CLIMATE SUMMER <strong>2005</strong>
FEATURE ARTICLEEvapotranspiration for turf for NormanStationDateNumberof DaysEvapotranspiration (inch)AccumulatedEvapotranspiration(inch)Rainfall (inch)AccumulatedRainfall (inch)NRMN <strong>2005</strong>-06-01 1 0.14 0.14 0.00 0.00 -0.14NRMN <strong>2005</strong>-05-31 2 0.08 0.22 0.36 0.36 0.14NRMN <strong>2005</strong>-05-30 3 0.10 0.33 0.00 0.36 0.03NRMN <strong>2005</strong>-05-29 4 0.10 0.43 0.00 0.36 -0.07NRMN <strong>2005</strong>-05-28 5 0.10 0.53 0.00 0.36 -0.17NRMN <strong>2005</strong>-05-27 6 0.05 0.58 0.21 0.57 -0.01NRMN <strong>2005</strong>-05-26 7 0.11 0.69 0.05 0.62 -0.07NRMN <strong>2005</strong>-05-25 8 0.07 0.76 0.02 0.64 -0.12NRMN <strong>2005</strong>-05-24 9 0.17 0.94 0.11 0.75 -0.19Water Balance (inch)The Water Balance, showing inches of water loss, is similar to acheckbook balance. (Refer to the example table.) When morewater is lost by the plant than replaced by rainfall, the numberis a red colored, negative value. When there has been morewater from rainfall than water lost by the plant, the number is ablue colored, positive value. By going down the Water Balancecolumn until you reach the date of the last irrigation or of thelast major rain event, you can see how much water the cropused. When the negative value of the Water Balance is equalto the amount of water that can be lost by your crop, it is timeto irrigate.How much water can be lost before you water again should bebased on the crop’s rooting depth and field soil type. Soils varyin water holding capacity from a low of 0.96 inches of water perfoot of soil for sand to a high of 2.16 inches of water per footof soil for loam.For most crops, the recommendation is to irrigate when 50%of the water holding capacity of the soil is still in the soil profile.For example, if the crop was growing in a clay loam with awater holding capacity of 1.80 inches per foot and had arooting depth of 3 feet there would be a total 5.4 inches of wateravailable for use by the crop. When the evapotranspirationwater balance reached -2.7, then 50% of the available waterwould be have been lost and 50% would remain. This wouldbe the time to irrigate to be sure the water in the soil profiledid not get too low. For a more water sensitive crop, a personmight choose to water when 70% of the water holding capacitylevel was reached. For the soil and crop example above, thecrop would be watered when the evapotranspiration waterbalance reached -1.62.For consumers interested in watering their lawn, here aresome general guidelines that apply to all but the most extreme<strong>Oklahoma</strong> soils.GrassHighMaintenanceModerateMaintenanceBermuda -0.5 -1.0 -1.5Zoysia -0.5 -0.75 -1.0Tall Fescue -0.5 -0.75 -1.0KentuckyGrass-0.5 -0.75 -1.0Perennial Rye -0.5 -0.5 -0.75LowMaintenanceWhen you water turfgrass, apply enough water to wetthe soil at least 6 inches deep. This is the typical rootingzone for <strong>Oklahoma</strong> turfgrasses. You may choose to waterdeeper to supply the same amount of water lost throughevapotranspiration. To do this run the sprinklers long enoughto equal the evapotranspiration water balance loss. It may benecessary to run your sprinklers, turn them off, wait until thewater soaks in, and run them again, to supply the right amountof water and avoid water runoff.When there is a large rainfall discrepancy between yourlocation and the <strong>Oklahoma</strong> Mesonet tower adjust the waterbalance accordingly.Using the <strong>Oklahoma</strong> Mesonet Evapotranspiration Modelsto water or irrigate allows all <strong>Oklahoma</strong>ns to be better waterstewards.Another consideration when scheduling irrigation is the abilityof the irrigation system to replace the water lost. If the systemcannot replace all of the water lost by evapotranspiration atone time, it may be better to use a more conservative waterbalance value, such as -1.0 or -1.25 given the example fromthe previous paragraph.OKLAHOMA CLIMATE SUMMER <strong>2005</strong> 23
INTERPRETATION ARTICLEHEATBURSTS by Andrea MelvinThe concept of a heatburst was introduced by Cline in 1909after an unusual event in Cherokee, <strong>Oklahoma</strong>. For eighty-fiveyears, heatbursts were considered rare events. But in 1994,scientists gained a tool that resulted in new research. Loyalreaders will recognize this date as the launch of the <strong>Oklahoma</strong>Mesonet.Scientists quickly realized that their lack of knowledge aboutheatbursts wasn’t due to the rarity of the events but becausethey are small-scaled and short-lived. The National WeatherService weather monitoring stations are spaced several tensof kilometers apart. A heatburst would have to occur directlyover an NWS station for scientists to notice it. The stationsare so far apart that it is nearly impossible for more than onestation to record the event. Additionally, the NWS stations takehourly measurements. The hour interval is too large to record aheatburst event unless the event occurred at the top of the hour.The NWS network would record only one measurement spike.Most heatburst events contain a series of spikes. Heatbursts,generally, last anywhere from 15 minutes to several hours.In the first five years of operations, the <strong>Oklahoma</strong> Mesonetdetected 51 separate heatburst events. Only 10 events hadbeen documented in the scientific literature between 1909 and1994. The 30 km station spacing and 15-minute observationsof the <strong>Oklahoma</strong> Mesonet make it much easier to record theseevents. Now that the <strong>Oklahoma</strong> Mesonet takes 5-minuteobservations, we may see another increase in the number ofheatburst events.Current Accepted Causes for HeatburstsResearchers are working to gather enough data to determine thecause of these intense downdrafts. The most common sourceof downdrafts is a supercell thunderstorm. When these stormssuddenly collapse all the molecules suspended in the updraftfall quickly to the earth. The updraft reverses to a downdraft.However, there have been cases of heatbursts occurring in thedowndraft region of a rear inflow jet, in mesoscale convectivesystems along with several other theories.Effect on Vegetation and TreesThe intense temperature spike and plummeting dew pointsresult in major damage to vegetation and trees. Just like ona hot summer day, the lack of moisture in the air forces theplants to increase their rate of transpiration. The water lost bythe plants can be so severe that the plant will wilt and lose itsleaves. This process is similar to the effect of heat stroke ona person. The internal systems of the body/plant are stuck inoverdrive. The duration and intensity of the heatburst eventdamages the internal systems of flowers and vegetablesbeyond repair.Temperature and dew point are not the only problems for plantsduring a heatburst event. Strong heatburst winds knock downtrees, power poles and sever plants at the stem.ReferencesLane, Justin D. (2000) A Climatology of Heatbursts as Detectedby the <strong>Oklahoma</strong> Mesonet: October 1993 Through September1998, M.S. Thesis, The University of <strong>Oklahoma</strong>, 141 pp.Heatbursts occur when a downdraft of air rushes to the surface.As the air is compressed it warms and dries out. The windsincrease in speed as they move toward the ground. When theair reaches the surface it is forced outward in all directions.24 OKLAHOMA CLIMATE SUMMER <strong>2005</strong>
OCS CLASSROOM FEATURE ACTIVITYARTICLEClassroom ActivityA heatburst event occurred on April 19, <strong>2005</strong>. Several <strong>Oklahoma</strong> Mesonet stations were effected including Cheyenne, Hobart andMangum. The location of these stations are shown in Figure 1. This particular event lasted several hours. Use the meteogramsprovided (pg. 26-27) from each of the three stations to answer the following questions.1. What time did the heatburst event begin? Which station recorded the event first?2. For each station, how much did the temperature increase?3. What was the lowest dewpoint temperature observed? At which station?4. Which station experienced the most extreme winds? What was the maximum wind gust?5. Which station experienced the most number of pulses (Note: Pulses refer to the number of temperature increases accompaniedby dew point decreases.)?6. What time did the heatburst event end? Which station recorded the last pulse?FIGURE 1 - <strong>Oklahoma</strong> MapAnswers (See page 7)OKLAHOMA CLIMATE SUMMER <strong>2005</strong> 25
CLASSROOM ACTIVITYFIGURE 2 - Radar ImageFIGURE 3 - Cheyenne Meteogram26 OKLAHOMA CLIMATE SUMMER <strong>2005</strong>
CLASSROOM ACTIVITYFIGURE 4 - Hobart MeteogramFIGURE 5 - Magnum MeteogramOKLAHOMA CLIMATE SUMMER <strong>2005</strong> 27
How to protect yourself from UV rays:UV information can be found at:Protection from sun exposure is importantall year round, not just during the summer.Any time the sun’s ultraviolet (UV)rays are able to reach the surface of theearth, you need to protect yourself fromexcessive sun exposure. UV rays cancause skin damage during any season ortemperature.Relatively speaking, the hours between 10a.m. and 4 p.m. are the most hazardousfor UV exposure in the United States. UVrays reach you on cloudy and hazy days,as well as on bright and sunny days. UVrays will also reflect off any surface likewater, cement, sand, and snow.Center for Disease Control and Prevention (CDC)http://www.cdc.gov/http://www.cdc.gov/ChooseYourCover/qanda.htmEnvironmental Protection Agency (EPA)http://www.epa.gov/sunwise/by Andrew ReaderAvoid outdoor activities during midday, when the sun’s raysare strongest. This usually means the hours between 10 a.m.and 4 p.m. You can also wear protective clothing, such as awide-brimmed hat, long-sleeved shirt, and long pants. For eyeprotection, wear wraparound sunglasses that provide 100 percentUV ray protection. Always wear a broad-spectrum (protectionagainst both UVA and UVB rays) sunscreen and lipscreenwith at least SPF 15. Sunscreens come in a variety offorms such as lotions, gels, and sprays, so there are plenty ofdifferent options. There are also sunscreens made for specificpurposes, such as the scalp, sensitive skin, and for use onbabies. Regardless of the type of sunscreen you choose, besure that you use one that blocks both UVA and UVB rays andthat it offers at least SPF 15.What does tanned skin mean?The penetration of UV rays to the skin’s inner layer resultsin the production of more melanin. That melanin eventuallymoves toward the outer layers of the skin and becomes visibleas a tan.A suntan is not an indicator of good health. Some physiciansconsider the skin’s tanning a response to injury because it appearsafter the sun’s UV rays have killed some cells and damagedothers.<strong>Oklahoma</strong> <strong>Climatological</strong> <strong>Survey</strong>100 East Boyd, Suite 1210Norman, OK 73019-1012phone 405.325.2541fax 405.325.2550http://www.ocs.ou.eduemail ocs@ou.edu28 OKLAHOMA CLIMATE SUMMER <strong>2005</strong>