Credit risk assessment using Multilayer Neural Network Models ...
Credit risk assessment using Multilayer Neural Network Models ...
Credit risk assessment using Multilayer Neural Network Models ...

You also want an ePaper? Increase the reach of your titles
YUMPU automatically turns print PDFs into web optimized ePapers that Google loves.
<strong>Credit</strong> <strong>risk</strong> <strong>assessment</strong> <strong>using</strong> <strong>Multilayer</strong> <strong>Neural</strong> <strong>Network</strong><strong>Models</strong>Case of a Tunisian bankHamadi Matoussi 1 and Aida Krichene 2AbstractDeciding whether or not to grant a loan is a key decision financial institutions haveto make every day, especially for short-term commercial loans that are frequentlysubject to renewal. In effect, bank’s credit decision gains in efficiency if it canprevent significant losses by obtaining a solid understanding of who will default ona credit. Determining the symptoms that lead to bad loans can be an effective way ofreducing credit <strong>risk</strong>, by pointing out high-<strong>risk</strong> applicants who should be avoidedMany classification methods have been suggested in the literature to tackle thisproblem. <strong>Neural</strong> networks, especially, have received a lot of attention because oftheir universal approximation property. This paper addresses the question of defaultprediction of short term loans for a Tunisian commercial bank. We use a multilayerneural network model to predict if a particular applicant can be classified as solventor bankrupt. The results show that the best information set is the one combiningaccrual, cash-flow and collateral variables. Moreover, our investigation shows thatthe bank could have reduced the percentage of loss (failure on short term credits)from 18.7% to 12% during 2007.Keywords: <strong>Credit</strong> <strong>risk</strong> evaluation; Default <strong>risk</strong>; financial ratios; multilayer networks; Banking sector, <strong>Neural</strong>network <strong>Models</strong>.Field research: banking : Loan Default ; Finance: corporate finance1 Professor of FinanceDepartment of Accounting and FinanceUniversity of Manouba (Tunisia)E-mail: hmato_isc@yahoo.cahamadi.matoussi@iscae.rnu.tn2 Assistant professor of accountingDepartment of AccountingUniversity of Carthage (Tunisia)E-mail aidakrichene@yahoo.fraida.krichene@iscae.rnu.tn1
1. IntroductionIn recent years, credit <strong>risk</strong> evaluation and credit default prediction have attracted a greatdeal of interests from practitioners, theorists and regulators in the financial industry.According to Basel Committee on Banking Supervision, credit <strong>risk</strong> is most simply definedas the potential that a bank borrower or counterparty will fail to meet its obligations inaccordance with agreed terms Okan Veli Şafakli (2007).Until recently, in developing countries, the credit decision used to be based on thetraditional approach, which takes into account various quantitative as well as subjectivefactors, such as liquidity, leverage, earnings, reputation, etc. According to this informationand by merely inspecting the application form details, the credit expert uses a judgmentalapproach to decide upon the creditworthiness of the applicant.In February 2006, the Basel Committee on Banking Supervision issued a consultativedocument for comment. This document was intended to provide banks and supervisorswith guidance on sound credit <strong>risk</strong> <strong>assessment</strong> and valuation policies and practices forloans regardless of the accounting framework applied. The principle 3 states that “A bank’spolicies should appropriately address validation of any internal credit <strong>risk</strong> <strong>assessment</strong>models » 1 .The implementation of this principle turns out to be a daily decision based on a binaryclassification problem distinguishing good payers from bad payers. Certainly, assessingthe insolvency plays an important role since a good estimate (related to a borrower) canhelp to decide whether granting the requested loans or not. The Basel Committeeproposes a choice between two broad methodologies for calculating their capitalrequirements for credit <strong>risk</strong>, either external mapping approach or internal rating system.Although the external mapping approach is difficult to apply because of the unavailability ofexternal rating grades, the internal rating is easy to implement since numerous methodshave been proposed in the literature to develop credit-<strong>risk</strong> evaluation models 2 . Thesemodels include traditional statistical methods (e.g., logistic regression, Steenackers andGoovaerts 1989), nonparametric statistical models (e.g., k-nearest neighbor, Henley andHand 1997, and classification trees, Davis et al. 1992) and neural network (NNs) models(Desai et al. 1996). NNs have served as versatile tools for data analysis in a variety ofcomplex environments. In finance, they have been successfully applied to bankruptcy andloan-default prediction and credit evaluation (see West 2000, Wu and Wang 2000, Atiya2001 and Pang, Wang and Bai 2002). One of their first applications to the bankruptcyprediction problem was those of Odom and Sharda (1990). These authors show that NNsoutperform the Altman’s multivariate discriminant analysis (MDA) by more than 10% 3 .Furthermore, Compared to other prediction models, NNs present at least three significantadvantages. The first is their ability to model complex relationships an analyst might not beaware of. For example, when the banker believes that the likelihood of a loan repaymentcan be explained by variables, without insufficient foundation theory, the NNs can providethe additional intelligence for successful modelling. The second is, no matter whatanalytical tool is best in an application, NNs can often be used as a benchmark of whatmight be possible <strong>using</strong> another method. The third one is that, as organizations areincreasingly pressed to make credit decisions that are both quick and accurate, NNs canassist in speeding up the decision process while maintaining or improving the success rateof credit decisions 4 . That’s why we choose to use them in this study.Our research question is how banks in Tunisia can develop fairly accurate quantitativeprediction models that can serve as very early warning signals for counterparty defaults.Previous work looks at Business failure prediction from the mid-term and long-term2
prospects (failure vs non failure). In our paper, we look at the short-term prospect(payment vs non payment of the short term credit at maturity). We also consider the caseof a bank who wants to use prediction model to assess its credit <strong>risk</strong> 5 .Specifically, we use a multilayer neural network model to help the credit–<strong>risk</strong> manager inexplaining why a particular applicant is classified as either bad or good. The neural netsparameters will be set <strong>using</strong> an optimization procedure analogous to the gradient –in theclassical topology– and a feed forward neural network with ad hoc connections.The remainder of this paper is organized as follow. In section 2 we provide the theoreticalbackground supporting our research question our research design respectively. In section3, we describe data and methodology. In Section 4, we present our results and theirinterpretations. Finally, Section 5 concludes the paper and presents some limits.2. <strong>Credit</strong> Risk Evaluation of Banks: Theory and Empirical Modelling2.1. The Roots of the <strong>Credit</strong> Risk Problem: Agency TheoryThe problem: One of the most fundamental applications of agency theory to the lenderborrowerproblem is the derivation of the optimal form of the lending contract. In debtmarket, the borrower usually has better information about the project to be financed and itspotential returns and <strong>risk</strong>. The lender, however, doesn’t have sufficient and reliableinformation concerning the project to be financed. This lack of information in quantity andquality creates problems before and after the transaction takes place. The presence ofasymmetric information normally leads to moral hazard and adverse selection problems.This situation illustrates a classical principal-agent problem.The principal-agent models of the agency theory may be divided into three classesaccording to the nature of information asymmetry. First, there are moral hazard models,where agent receives some private information after signing the contract. Moral hazardrefers to a situation in which the asymmetric information problem is created after thetransaction occurs. Since the borrower has relevant information about the project thelender doesn’t have, the lender runs the <strong>risk</strong> that the borrower will engage in activities thatare undesirable from the lender’s point of view because they make it less likely that theloan will be paid back. These models are qualified as models with ex-post asymmetricinformation.Second, we find adverse selection models, where agent has private information alreadybefore signing the contract. Adverse Selection refers to a situation in which the borrowerhave relevant information that the lender lack (or vice versa) about the quality of theproject before the transaction occurs. This happens when the potential borrowers who arethe most likely to produce an undesirable (adverse) outcome (bad credit <strong>risk</strong>s) are theones who are most active to get a loan and are thus most likely to be selected. In thesimplest case, lenders’ price cannot discriminate between good and bad borrowers,because the <strong>risk</strong>iness of projects is unobservable. These models are known as modelswith ex-ante asymmetric information. Finally, signalling models, in which the informedagent may reveal his private information through the signal which he sends to theprincipal.The solution: This problem is traditionally considered in the framework of costly stateverification, introduced by Townsend (1979). The essence of the model is that the agent,3
who has no endowment, borrows money from the principal to run a one-shot investmentproject. The agent is faced with a moral hazard problem. Should he announce the truevalue or should he lower the outcome of the project? This situation describes ex-postmoral hazard. We can also face a situation of ex-ante moral hazard, where theunobservable effort by agent during the project realization may influence the result of theproject. Townsend (1979) showed that the optimal contract which solves this problem isthe so called standard (or simple) debt contract. This standard debt contract ischaracterized by its face value, which should be repaid by the agent when the project isfinished. As another theoretical justification for simple debt contract was considered byDiamond (1984), where the costly state verification was replaced by a costly punishment.Hellwig (2000, 2001) showed that the two models are equivalent only under the <strong>risk</strong>neutrality assumption. However, when we consider the introduction of <strong>risk</strong> aversion, thecostly state verification model still working, but the costly punishment model does notsurvive.To overcome the asymmetric information problem and its consequences on credit <strong>risk</strong><strong>assessment</strong> in the real world, banks use either collateral or bankruptcy predictionmodelling or both. The next subsection will deal with this aspect.2.2. <strong>Credit</strong> Risk Evaluation: Empirical ModellingAfter the high number of profile bank failures in Asia, the research activity on credit <strong>risk</strong>took a step further. As a result, the regulators recognize the need and urge banks to utilizecutting edge technology to assess the credit <strong>risk</strong> in their portfolios. Measuring the credit<strong>risk</strong> accurately also allows banks to engineer future lending transactions, so as to achievetargeted return/<strong>risk</strong> characteristics. The <strong>assessment</strong> of credit <strong>risk</strong> requires thedevelopment of fairly accurate quantitative prediction models that can serve as very earlywarning signals for counterparty defaults 6 .There are two main approaches commonly addressed in the literature. In the firstapproach, the structural or market based models, the default probability derivation isbased on modelling the underlying dynamics of interest rates and firm characteristics. Thisapproach is based on the asset value model originally proposed by Merton (1974), wherethe default process is endogenous, and relates to the capital structure of the firm. Defaultoccurs when the value of the firm’s assets falls below some critical level. In the secondapproach, the empirical or accounting based models, instead of modelling the relationshipof default with the characteristics of a firm, this relationship is learned from the data. Sincethe work of Beaver (1966) and Altman (1968), bankruptcy prediction has been studiedactively by academics and practitioners. Many models have been proposed and testedempirically. Altman’s popular Z-Score (Altman, 1968) is an example based on lineardiscriminant analysis, and was used to predict the probability of default of firms. OhlsonsO-Score (Ohlson, 1980) is based on generalized linear models. Generalized linear modelsor multiple logistic regression models have been used either to identify the bestdeterminants of bankruptcy and the predictive accuracy rate of their occurrence. <strong>Neural</strong>network models were adapted and used in bankruptcy prediction. Their high power ofprediction makes them a popular alternative with the ability to incorporate a very largenumber of features in an adaptive nonlinear model (Kay and Titterington, 2000).4
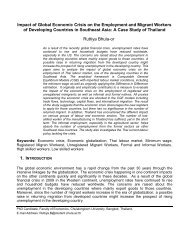
2.3. Empirical Research DesignThe prediction of financial distress is an important studied topic since it can havesignificant impact on bank lending decisions and profitability. Several methods andtechniques have been suggested in the literature to tackle these decisions. The earlyempirical approaches are those of Beaver (1966), Altman (1968), and Ohlson (1980).However, these approaches are either very simple (Beaver 1963) or essentially linearmodels (Altman 1968 and Ohlson 1980). NNs approach started to be used for bankruptcyprediction in 1990 and they are still active now 7 . The reason why they received a lot ofattention is their universal approximation property and their excellent ability to classify data(especially loan applications) 8 . <strong>Neural</strong> networks grew out of research in ArtificialIntelligence; specifically, attempts to mimic the fault-tolerance and capacity to learn ofbiological neural systems by modelling the low-level structure of the brain (see Patterson,1996) 9 .The majority of the NN approaches to default prediction use multilayer networks. ‘Feedforward’NNs are perhaps the most popular network architecture in use today, dueoriginally to Rumelhart and McClelland (1986). They are sometimes also referred to as‘back-propagation NNs’ or ‘multi-layer perceptrons’ (Ripley, 1996).The feedforward network architecture is composed of an input layer, one or more hiddenlayers and an output layer. More precisely, feed-forward NNs have units with one-wayconnections, such that these units can always be arranged in layers so that connectionsgo from one layer to another. This is best seen graphically, see Figure 1.Figure 1: A generic feed-forward network with a single hidden layer.Source: Daniel Berg (2005, 11)A network such as Figure 1 represents a function from inputs to outputs (equation 1). Eachunit sums its inputs and adds a constant (the ‘bias’) to form a total input x j and applies afunction f j to x j to give output y j . The links have weights w ij which multiply the signalstraveling along them by that factor.fkNMx f α u x v f β w x , (1)0kiki1ij1Here N, M and K are the number of input nodes (i.e. the number of explanatory variables),the number of nodes in the hidden layer (s) and the number of output nodes (i.e. thenumber of possible classes), respectively (Aas et al., 1999).jkhjNi1iji 5
3. MethodologyNNs have enjoyed widespread adoption in finance due partly to their excellent ability toclassify data. A prime example of a finance application is classifying loans. Analysing whowill default on a loan is a big business for financial institutions. In effect, if the banksucceeds to classify potential borrowers either healthy or doubtful, it can have a goodappraisal and <strong>assessment</strong> of its credit <strong>risk</strong>. In this section, we show how NN methodologycan do this job. Moreover, we identify which indicators (financial and non financial) performbetter in the case of a Tunisian bank.In our experiment we split our sample of the bank credit files into two sub samples. Thefirst sub-sample is composed of 924 files of short term loan granted to Tunisian companiesin 2003, 2004, 2005 and 2006. The data of this sub-sample are used as a training set (thein-sample set) to construct the prediction NNs models. The second one is composed of510 files and is used for validation (the out-of sample set). Our experiment relied on thesupervised learning paradigm 10 .We build up three types of NNs. The first NN uses data on financial ratios (cash-flowsexcluded). It will be referred as ‘Non cash-flow NN model’. The second NN uses data onall ratios indicators (cash-flows included). It will be referred as ‘Cash-flow NN model’. Thethird NN uses all financial and non financial indicators.We use in our analysis supervised learning algorithms (of which the best known exampleis back propagation, devised by Rumelhart et. al., 1986). This algorithm uses the data toadjust the net's weights and thresholds so as to minimize the error in its predictions on thetraining set. If the net is properly trained, it has then learned to model the (unknown)function that relates the input variables to the output variables, and can subsequently beused to make predictions where the output is not known.3.1. Sample and DataLet’s recall that our objective is to use neural network methodology for default prediction ofbank’s commercial loans. But, in order to solve a problem <strong>using</strong> neural networks, we needto gather data for training purposes. The training data set includes a number of cases,each containing values for a range of input and output variables. The first decision weneed to make is which variables to use. The second one concerns the subjects we want topredict their behaviour. Four our case the variables are indicators of default <strong>risk</strong> and thesubjects are borrowers. The data collected for our investigation came from a large privatecommercial bank (BIAT). We choose a private bank in order to avoid the potentialinefficiency of public banking sector, whose decision is sometimes dictated by governmentchoices. We also choose to work with short-term commercial loans because theyrepresent the largest part of loans and are subject to renewal every year 11 .We use a database of 1434 files granted to industrial Tunisian companies by a commercialbank in 2003, 2004, 2005 and 2006. This period was chosen because it corresponds to acentral bank instruction, in which it asks bank to provide credit <strong>risk</strong> classes for theirborrowers. For the case the BIAT, by the end of every quarter, it classifies these files intofive clusters, each one corresponding to a <strong>risk</strong> class. Files without delay of payment6
correspond to the healthy firms. The four remaining classes correspond to four <strong>risk</strong>ierclasses of three, six, nine and one year (or more) delay of payment respectively. We groupthese four classes in one class (<strong>risk</strong>y companies). Table 1 classifies our sample by <strong>risk</strong>classes.Table 1: Sample subsets characteristics2003 2004 2005 2006HealthycompaniesRiskycompaniesTotalsampleNumberof firmsPercentage Numberof firmsPercentage Numberof firmsPercentage Numberof firmsPercentage176 47.44% 206 52.68% 195 51.58% 150 50.85%195 52.56% 185 47.32% 183 48.42% 145 49.15%371 100% 391 100% 378 100% 295 100%3.2. Variables measurement3.2.1. Dependent VariableOur dependant variable is the probability of default. We use dummy variable, which equals0 if the classified as healthy and 1 otherwise. Hence:Y = 0 if no delay of paymentY = 1 if more there is more than 3 month delay3.2.2. Independent VariablesDefault <strong>risk</strong> prediction relies in general on a good appraisal of the couple <strong>risk</strong>-return of acompany. Financial ratios drawn from financial statements (balance sheet, income andcash flow statement) are usually used. Financial ratio analysis groups the ratios intocategories which tell us about different facets of a company's finances and operations(liquidity, activity or operational, leverage and profitability).In our experiment we retain 24 financial and non financial indicators, 22 of them arefinancial ratios and 2 are not. The financial indicators are inspired from Altman’s popular Z-Score and recommended textbooks in financial statement analysis and valuation (Bersteinand Wild 1998; Revsine, Collins and Johnson 1999; and Palepu, Healy and Bernard 2000).The financial indicators measure liquidity (working capital, operating activity and cashflow), Leverage, long term solvency and Profitability. The Non financial variables usedin this research are firm size and collateral.7
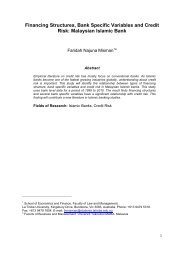
4. Empirical results4.1. Results of the in-sample setPanels 1, 2 and 3 of Table 3 show the results for the type one and two NN models (withoutand with cash flow ratios). Figures 2, 3 and 4 display the curves of the Mean Square Error(training) for the three types of NN models retained. These figures show the power curvesof the three best networks.Table 3: Results for Non cash-flow and cash-flow NNs models(In and out-of-sample)Panel 1: Non cash-flow NNs modelsArchitectureMSE(%)(In-sample training)1-MSEGoodclassificationrate(Out-of-sample validation)Goodclassification1-MSErateMSENet_00 [21 2] 13.38 86.62 81.5 14.56 85.44 71.8Net_01 [21 10 2] 12.73 87.27 84 13.35 86.65 73.38Net_02[21 12 12 2] 2.9 97.1 97 2.7 97.3 73Net_03 [21 15 15 15 2] 5.2 94.8 95.5 5.3 94.7 81Net_03 [21 14 14 8 2] 2.7 97.3 97.5 2.65 97.35 84.9Net_03 [21 10 10 8 2] 3.4 96.6 96.7 3.90 96.1 81.9Net_03 [21 12 12 10 2] 7.9 92.1 91.55 8 92 81.8Net_03 [21 10 10 10 2] 5 95 95.4 4.8 95.2 83.75Net_03 [21 13 13 13 2] 2.3 97.7 97.8 2.26 97.74 85.9Panel 2: Cash-flow NNs modelsArchitectureMSE(In-sample training)1-MSEGoodclassificationrate(Out-of-sample validation)Goodclassification1-MSErateMSENet_00 |23 2] 11.64 88.36 85.38 12.75 87.25 83Net_01 [23.8 2 ] 2.11 97.89 98 3.2 96.8 71.4Net_02 [23 10 8 2] 1.3 98.7 96 1.35 98.65 79.84Net_02 [23 15 15 2 ] 1.8 98.2 96 2.03 97.97 82.38Net_02 [23 15 10 2] 2.8 97.2 97 3.24 96.76 83.36Net_02 [23 12 12 2] 2 98 98 2.14 97.86 84.34Net_03[23 15 15 15 2] 1 99 99 1.10 98.9 88.45Net_03 [23 12 12 12 2 ] 1 99 99 1.30 98.7 87.089
Panel 3: Full information NN modelsArchitectureMSE(In-sample training)1-MSEGoodclassificationrate(Out-of-sample validation)Goodclassification1-MSErateMSENet_00 [24 2] 9.6 90.4 89.9 20.6 79.4 74.5Net_01 [24 12 2] 3.7 96.3 96.4 4.54 95.46 82.5Net_02 [24 12 10 2] 1 99 95.35 2.64 97.36 86.8Net_02 [24 15 15 2] 0.3 99.7 96.8 2.6 97.4 82.1Net_02 [24 12 12 2] 1 99 97.6 2 98 79.6Net_03 [24 21 15 10 2] 0.5 99.5 97 0.9 99.1 90.2Net_03[24 12 12 12 2] 1.5 98.5 95.5 2.8 97.2 80.6Net_03 [24 15 15 15 2] 0.6 99.4 97 1.38 98.62 87.7Figure 2: Curve of the MSE for the Non cash-flow NNs model10
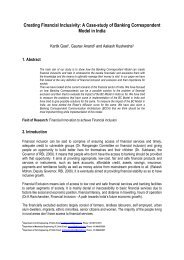
Figure 3: Curve of the MSE for the Cash-flow NNs models11
Figure 4: Curve of the M S E for the Full information NN modelsWe can see from these results (panel 1) that the introduction of hidden layers improves theperformance of the model. The MSE drops from 13.38% (Net 00) to 2.3% for the bestthree hidden layers NN (Net_03 [21 13 13 13 2]). The classification rate is improved from81.5% to 97.8%. The introduction of cash-flow variables (panel 2) improves theperformance since the type 2 model gives a better MSE (11.64 % for the no hidden layerand 1% for the three hidden layers) 12 . The classification rate is improved from 85.38% to99% Panel 3 of table 3 shows that the type three outperforms the two previous modelssince the MSE is lower and the classification is higher for all versions (without and withhidden layers). The collateral variable has the best contribution. The best version (Net 03[24 21 15 10 2]) has the lowest mean square error (0.5%) and allow us the classificationrate of 97% 13 .4.2. Out-of- sample validationTable 3 presents the results of the validation test for the three types of NN modelsobtained from the training set. We can see form panel 1 that the best model in traininggives also the best performance (with a MSE of 2.26%) in the out-of-sample. Thecorresponding classification rate is 85.9%. The introduction of cash-flow indicators (panel2) improves the performance of the model in term of classification rate (with a 88.45% ofgood classification rate). The classification rate jumped to 90.2% (panel 3) when weintroduced the whole set of indicators. We can notice here that the best network (Net 0312
[24 21 15 10 2]) in the training sample is also the best one in the validation with the lowestMSE.4.3. Potential benefits of prediction modelsWe gathered some information about credits granted and credits loss of the bank duringyear 2007. Table 4 shows these data.Table 4: credits and credit losses of the bankShort term credit granted by the bankin 2007Total credits2 014.123MD<strong>Credit</strong>losses% ofcreditfailureTotalcredits376.371MD 18,68% 472.189MDShort term credit for our sampleTotal loss of predictedbad credits by theNNs% ofcreditfailure56.806 MD 12.03%We can see from the table that this bank could reduce the percentage of its losses from18.7% to 12.03% if it uses NNs to decide whether to grant or refuse a credit demand.5. ConclusionBanks need to evaluate the credit <strong>risk</strong> inherent in the entire portfolio as well as the <strong>risk</strong> inindividual credits or transactions. Generally, credit <strong>risk</strong> is associated with the traditionallending activity of banks and it is simply described as the <strong>risk</strong> of a loan not being repaidpartly or in full Okan Veli Şafakli (2007).The field of credit <strong>risk</strong> and corporate bankruptcy prediction also gained considerablemomentum (e.g., Bharath and Shumway 2008, Davydenko 2008 and Korteweg andPolson 2008, Korteweg, 2010).In this article we tried to assess the credit <strong>risk</strong> for a Tunisian bank through modeling thedefault <strong>risk</strong> of its commercial loans. We used a data base of 1434 credit files during 2003and 2004, 2005 and 2006. Inputs variables were classified in three categories: non cashflowratios, cash-flow ratios and non financial variables.The main results show that the introduction of cash-flow variables improves the predictionquality, and the classification rates passed to 99% and 88.45% respectively in the insampleand out-of-sample sets. Moreover, collateral played an important role in default<strong>risk</strong> prediction. Its introduction in the model improves the prediction capacity to 99.5% inthe training data set and to 90.2% in the validation data set.Using the same data, our study confirms the superiority of NN models to linear logisticregression Matoussi &Krichène Abdelmoula (2010). The prediction performances of theneural network models (all versions) outperform the linear logistic model by 12.92% for thein-sample (model with full information) and by 11.3% in the out-of-sample.These findings are encouraging and militate in favour of a quick adoption of IRB in Tunisia.Our study can be helpful either for banks or authority regulation. It may help banks to13
identify the best financial predictor for default <strong>risk</strong>. It may also help authorities to implementan internal based <strong>risk</strong> method for <strong>assessment</strong> of credit <strong>risk</strong> evaluation.Our study is, however, incomplete in the sense that it didn’t show how one can use theseresults in the implementation of the Basel II or III accord in Tunisia.ReferencesAas, K., Huseby, R. B. and Thune, M. 1999, ‘Data mining: A survey’, Report, NorwegianComputing Center. ISBN 82-539-0426-6.Abid, F. and A. Zouari 2000, “Financial Distress Prediction Using <strong>Neural</strong> <strong>Network</strong>s”,http://ssrn.com/abstract=355980 or DOI: 10.2139/ssrn.355980.Altman, E. I. 1968, ‘Financial ratios, discriminant analysis and the prediction of corporatebankruptcy’, Journal of Finance 23: 589–609.Atiya, A.F., 2001, Bankruptcy Prediction for <strong>Credit</strong> Risk Using <strong>Neural</strong> Nets: A survey andNew Results. IEEE Transactions on <strong>Neural</strong> Nets, 12 (4): 929-935.Beaver, W. 1966, ‘Financial ratios as predictors of failure. Empirical research inaccounting: Selected studies’, Journal of Accounting Research 5: 71–111.Berg, D. 2005, ‘Bankruptcy Prediction by Generalized Additive <strong>Models</strong>’, StatisticalResearch Report No. 1, University of Oslo.Berstein, L. A. and J.J. Wild 1998, “Financial Statement Analysis: Theory, Application, andInterpretation”, sixth Edition, McGraw-Hill.Bharath, S. and T. Shumway, 2008, « Forecasting Default with the Merton Distance toDefault Model, Review of Financial Studies » 21, 1339-1369.Davis R.H. Davis, D.B. Edelman, and A.J. Gammerman. 1992. “Machine learningalgorithms for credit-card applications”. IMA Journal of Management Mathematics,4:43;51,Davutyan, N. and S. Özar 2006, A <strong>Credit</strong> Scoring Model for Turkey’s Micro & SmallEnterprises (MSE’s), 13 th Annual ERF Conference, Kuwait, 16 – 18 December 2006.Davydenko, S., 2008, « When do Firms Default? A Study of the DefaultBoundary, »Working Paper, University of Toronto.Desai, V. S., Crook, J. N., & Overstreet, G. A. (1996). A comparison of neural networksand linear scoring models in the credit union environment. European Journal ofOperational Research, 95(1), 24–37.Diamond, D. W. 1984 “Financial intermediationand delegated monitoring”, Review of Economic Studies, 51(3): 393–414.El-Shazly, A. 2002, “Financial Distress and Early Warning Signals: A Non-ParametricApproach with Application to Egypt, 9th Annual ERF Conference, Emirates, October2002.Hellwig M. 2000, ‘Financial intermediation with <strong>risk</strong> aversion’, Review of Economic Studies,67(4): 719–742.Hellwig M. 2001 ‘Risk aversion and incentive compatibility with ex post informationAsymmetry’, Economic Theory, 18(2):415–438.Henley W.E, and Hand D.J 1997: “statistical classification methods in consumer creditscoring: a review” journal of the royal statistical society. Series A (statistics insociety), vol 160, issue 3 523; 541.Kay, J. and Titterington, M., eds 2000, Statistics and <strong>Neural</strong> Nets, Advances at theInterface, Oxford University Press.Korteweg, A, and Polson,N. 2008, “Volatility, Liquidity, <strong>Credit</strong> Spreads and BankruptcyPrediction,” Working paper.14
Korteweg, A., 2010, The net benefits to leverage, Journal of Finance , vol 65 issue 6 pp2137,2170Matoussi H., A.Krichène Abdelmoula 2010 “credit <strong>risk</strong> evaluation of a Tunisian commercial: Bank: logistic regression versus <strong>Neural</strong> <strong>Network</strong> Modelling” “the journal ofaccounting and management information systems,vol 9, number 1 2010Matoussi H., R. Mouelhi & S. Salah 1999, “La prédiction de faillite des entreprisestunisiennes par la régression logistique”, Revue Tunisienne des Sciences deGestion, (1): 90-106.Merton, R. 1974 “On the pricing of corporate debt: The <strong>risk</strong> structure of interest rates,”Journal of Finance, (29): 449–470.Odom M. and R. Sharda, 1990 “A neural net model for bankruptcy prediction,” in Proc. Int.Joint Conf. <strong>Neural</strong> Nets, San Diego, CA.Ohlson, J. A. 1980, “Financial ratios and the probabilistic prediction of bankruptcy”, Journalof Accounting Research, (18): 109–131.Okan veli şafakli 2007, «<strong>Credit</strong> <strong>risk</strong> <strong>assessment</strong> for the banking sector of northerncyprus », Banks and bank systems / volume 2, issue 1, 2007Palepu K. G., P. M. Healy et V. L. Bernard 2000, “Business Analysis & valuation <strong>using</strong>financial Statements”, second Edition South – Western College Publishing.Pang, S.L., Y.M. Wang and Y.H. Bai, 2002, “<strong>Credit</strong> scoring model based on neuralnetwork”, Proc. of the First International Conference on Machine Learning andCybernetics, Beijing, 4-5 November 2002.Revsine, L., D.W. Collins and W.B. Johnson 1999, “Financial Statement and Analysis”,Prentice Hall, New Jersey.Ripley, B. D. 1996, “Pattern Recognition and <strong>Neural</strong> Nets”, Cambridge University Press,New York.Rumelhart, D.E., G.E. Hinton et J.L. McClelland 1986: « Ageneral framework for paralleldistributed processing.» In Rumelhart, D.E. J.C. McClelland and the PDP researchGroup. Parallel Distributed Processing: explorations in the microstructure ofcognition: vol. 1: foundations: the MIT Press, 1986. P45-75.Steenackers,A. and Goovaerts, M.J. 1989. « A credit scoring model for personal loans.Insurance: Mathematics and Economics, 8:31–34, 1989.Townsend, R. M. 1979 ‘Optimal contracts and competitive markets with costly stateverification’, Journal of Economic Theory, 21(2):265–293.Udo Schmidt-Mohr, 1997, “Rationing versus collateralization in competitive andmonopolistic credit markets with asymmetric information”, European EconomicReview, (41): 1321–1342.West, D, 2000, “<strong>Neural</strong> network credit scoring”, Computer & Operations Research, 27 (11):1131-1152.Wong, Bodnovitch and Selvi, 1995, “A bibliography of neural networks businessapplications research”, Expert Systems, 12 (3): 253-262.Wu, C. and X.M. Wang, 2000, “A <strong>Neural</strong> <strong>Network</strong> approach for analyzing small businesslending decisions”, Review of Quantitative Finance and Accounting, 15 (3): 259-27615
ENDNOTES1 “Sound <strong>Credit</strong> Risk Assessment and Valuation for Loans », Consultative Document, Bankfor International Settlements Press & Communications, Basel (November 2005).2 Moreover, the sub prime crisis, which shakes down the American and Europeancountries and shows the fragility of banking sector and throw some doubt on the accuracyand usefulness of agency ratings.3 The NN achieved a Type I correct classification accuracy in the range of 77.8% to 81.5%(depending on the training setup), and a Type II accuracy in the range of 78.6% to 85.7%.The corresponding results for MDA were in the range of 59.3% to 70.4% for Type Iaccuracy, and in the range of 78.6% to 85.7% for Type II accuracy.4 The advent of data storage technology has facilitated financial institutions’ ability to storeall information regarding the characteristics and repayment behaviour of credit applicantselectronically. This has motivated the need to automate the credit granting decision by<strong>using</strong> statistical or machine learning algorithms.5 See failure prediction in Tunisia by Matoussi & al. 1999, financial distress prediction <strong>using</strong><strong>Neural</strong> <strong>Network</strong>s by Abid & Zouari 2000, financial distress in Egypt by El-Shazly 2002,credit scoring model for Turkey’s micro & small enterprises by Davutyan 2006.6 “To get an idea about the potential impact of the bankruptcy prediction problem, we notethat the volume of outstanding debt to corporations in the United States is about $5 trillion.An improvement in default prediction accuracy of just a few percentage points can lead tosavings of tens of billions of dollars” (Atiya 2001, 929).7 The use of artificial neural networks began in the 40’s, but their applications in financeare more recent. According to the bibliography research by Wong, Bodnovitch and Selvi(1995), the early experimentations started in 1988 and the first paper on bankruptcyprediction was published in 1990.8 “NNs have generally outperformed the other existing methods. Currently, several of themajor commercial loan default prediction products are based on NNs. For example,Moody’s Public Firm Risk Model is based on NNs as the main technology. Many bankshave also developed and are <strong>using</strong> proprietary NN default prediction models.”(Atiya 2001,930).9 <strong>Neural</strong> networks are applicable in virtually every situation in which a relationship betweenthe predictor variables (independents, inputs) and predicted variables (dependents,outputs) exists, even when that relationship is very complex and not easy to articulate inthe usual terms of "correlations" or "differences between groups.".10 In supervised learning, the network user assembles a set of training data. The trainingdata contains examples of inputs together with the corresponding outputs, and the networklearns to infer the relationship between the two. Training data is usually taken fromhistorical records.11 Loans with maturities of one year or less comprise more than half of all commercial bankloans (Revsine and al. 1999). For the case of the BIAT this ratio was around 40% during2006 and 2007.12 We note that until now Tunisian bankers do not use cash-flow measures in theiranalysis.13 This network is dominated by the two hidden layers network (Net_02 [24 15 15 2]) interm of MSE. In spite of performance improvement of this network, the global classificationrate has decreased. This can be explained by the over-fitting problem. This problemusually occurs when we have a good performance in the training step in term of MSE, butthe model doesn’t have a good discrimination power16