
Create successful ePaper yourself
Turn your PDF publications into a flip-book with our unique Google optimized e-Paper software.
<strong>Topocad</strong>
Table Of ContentsContents ..................................................................................................................... 1<strong>Topocad</strong> 10.0 help system .................................................................................. 1General installation ..................................................................................................... 3General functions .................................................................................................... 5Installation ............................................................................................................... 6Select object ........................................................................................................... 7Shortcut keys ........................................................................................................ 10Snap...................................................................................................................... 12To start .................................................................................................................. 14File info ..................................................................................................................... 15New document ...................................................................................................... 16Open .................................................................................................................. 18Close ................................................................................................................. 18Save .................................................................................................................. 18Save as... .......................................................................................................... 18Return to saved ..................................................................................................... 19Select project ........................................................................................................ 20Registration ........................................................................................................... 22Print out ................................................................................................................. 24Printer settings ...................................................................................................... 26Exit ........................................................................................................................ 27Settings..................................................................................................................... 29Angles ................................................................................................................... 31Axis ....................................................................................................................... 33iii
<strong>Topocad</strong>Decimals ............................................................................................................... 35Co-ordinates ......................................................................................................... 37Display .................................................................................................................. 38Drawing ................................................................................................................. 40Folders .................................................................................................................. 41Import/Export ........................................................................................................ 42Language .............................................................................................................. 43Point info ............................................................................................................... 44Snap...................................................................................................................... 46Map ....................................................................................................................... 48Database ............................................................................................................... 50Instrument ............................................................................................................. 52Tolerances ............................................................................................................ 53Railway ................................................................................................................. 54ArcSDE settings .................................................................................................... 55Roadline ................................................................................................................ 59Survey ................................................................................................................... 60System files ........................................................................................................... 62Toolbars ................................................................................................................ 63Plot ........................................................................................................................ 64View .......................................................................................................................... 65Zoom ..................................................................................................................... 66Toolbox ................................................................................................................. 69Selection ............................................................................................................ 69Filter .................................................................................................................. 69iv
<strong>Topocad</strong>Export to Psion .................................................................................................... 101Export to Leica .................................................................................................... 102Export to Trimble ................................................................................................. 103Leica configuration .............................................................................................. 104Geodimeter label configuration ........................................................................... 106Export roadline to instrument .............................................................................. 108Import map sheet ................................................................................................ 109Import points from database ............................................................................... 110Leica, port settings .............................................................................................. 111Importing and exporting .dwg files ...................................................................... 112Import from Toptrans (Topcon) ........................................................................... 114Survey .................................................................................................................... 115Presentation of the survey data window.............................................................. 116Survey data - Settings, calculation ...................................................................... 120Traverse .......................................................................................................... 126Create traverse ................................................................................................ 126Traverse document.......................................................................................... 127Traverse settings ............................................................................................. 128Information about stations in traverse .............................................................. 129Calculate traverse............................................................................................ 130Construction ........................................................................................................... 133Draw polyline ...................................................................................................... 135Draw point ........................................................................................................... 138Draw Circle ......................................................................................................... 139Draw arc .............................................................................................................. 141vi
Table Of ContentsClothoid/spiral ..................................................................................................... 143Construct text ...................................................................................................... 144Insert raster image .............................................................................................. 145Insert symbol ....................................................................................................... 146Fill area (with symbol) ......................................................................................... 148Slope hatches ..................................................................................................... 149Copy object ......................................................................................................... 150Offset .................................................................................................................. 151Fillet .................................................................................................................... 152Divide line ........................................................................................................... 153Mirror ................................................................................................................... 154Create symbol ..................................................................................................... 155Create line type ................................................................................................... 158Attribute definition ............................................................................................... 160Convert symbols to points ................................................................................... 162Convert point attributes to object attributes ......................................................... 163Sheet/Drawing sheet ........................................................................................... 164View/Drawing view .............................................................................................. 165Co-ordinates grid ................................................................................................ 166Draw profile form ................................................................................................. 168Create section drawing ....................................................................................... 169Method selection ............................................................................................. 173Layout .............................................................................................................. 174Text ................................................................................................................. 175Field ................................................................................................................. 176vii
<strong>Topocad</strong>Sections ........................................................................................................... 176Form method ................................................................................................... 177Layout .............................................................................................................. 178Text ................................................................................................................. 178Field ................................................................................................................. 178Selecting layers ............................................................................................... 179Sections ........................................................................................................... 180Polar stake out (set out) ...................................................................................... 182Dimension ........................................................................................................... 183Group .................................................................................................................. 185Point differences ................................................................................................. 186Subdivide area .................................................................................................... 188Modify ..................................................................................................................... 189Delete object ....................................................................................................... 190Move object ......................................................................................................... 191Rotate object ....................................................................................................... 193Scale ................................................................................................................... 195Transform ............................................................................................................ 197Join ..................................................................................................................... 199Break ................................................................................................................... 201Explode ............................................................................................................... 202Extend ................................................................................................................. 203Trim ..................................................................................................................... 204Lengthen ............................................................................................................. 205Stretch ................................................................................................................. 206viii
<strong>Topocad</strong>Roadline manager ............................................................................................... 254Point code toolbars ............................................................................................. 255Add-on modules ..................................................................................................... 259Statistics .......................................................................................................... 259Edit DTM ............................................................................................................. 261Create DTM ........................................................................................................ 265Create contours .................................................................................................. 267Height on contours... ........................................................................................... 270Heights from DTM... ............................................................................................ 271Volume model... .................................................................................................. 272Volume from cross sections ................................................................................ 276Extract DTM ........................................................................................................ 277Update DTM ........................................................................................................ 278Add DTM ............................................................................................................. 279Move DTM .......................................................................................................... 280External references in DTM ................................................................................ 281Import and export DTM ....................................................................................... 282Railway ................................................................................................................... 283Slew/lift ................................................................................................................... 284Overlap measurement......................................................................................... 287Calculate section from point ................................................................................ 288Roadline ................................................................................................................. 289............................................................................................................................... 289Road line editor ................................................................................................... 290Save roadline ...................................................................................................... 292x
Table Of ContentsRoadline - Sections ............................................................................................. 293Roadline - calculate points .................................................................................. 295Road line - section/offset ..................................................................................... 296Surface check ..................................................................................................... 297Quick profile ........................................................................................................ 298Roadline document ............................................................................................. 301Tunnel ................................................................................................................. 304Create tunnel terrain model ................................................................................. 305Create tunnel sections ........................................................................................ 306Theoretical tunnel section ................................................................................... 307Calculated tunnel section .................................................................................... 309Design .................................................................................................................... 313Road profile ......................................................................................................... 314Road profile - import/export ................................................................................. 317Profile form .......................................................................................................... 318Area component .............................................................................................. 326Create camber diagram ...................................................................................... 332Section template - TST ....................................................................................... 333Cross section calculation .................................................................................... 343Construct ............................................................................................................. 343Create sections ............................................................................................... 343Delete sections ................................................................................................ 347Substitute sections .......................................................................................... 347Recalculate/update .......................................................................................... 347Create lines in plan .......................................................................................... 348xi
<strong>Topocad</strong>Create multiple lines ........................................................................................ 349Create slope edge ........................................................................................... 349Create sections in drawing .............................................................................. 350Create DTM from sections ............................................................................... 351Modify menu .................................................................................................... 351Edit/Interpolate ................................................................................................ 351Delete point in cross section ............................................................................ 352Edit layers ........................................................................................................ 352Edit side lines (TCS)........................................................................................ 353Edit outer slopes .............................................................................................. 353View in sections ............................................................................................... 354Print volumes ...................................................................................................... 356Net adjustment ....................................................................................................... 357Correction data ................................................................................................ 361Detailed settings: (active for the speed setting Open Settings) ....................... 362Use centering error for new points .................................................................. 362Explanations for Observations ......................................................................... 362Points .............................................................................................................. 365Instruments ...................................................................................................... 366Calculating of net ............................................................................................. 367View screen settings ........................................................................................ 367Tests ................................................................................................................ 368Search for gross errors .................................................................................... 368Connection error .............................................................................................. 369Double measured distances ............................................................................ 369xii
Table Of ContentsDouble measured heights ................................................................................ 369Connection error between known heights ....................................................... 369Automatic test of height loops ......................................................................... 369Post checking of calculated heights ................................................................ 369Point numbering .............................................................................................. 370Measurements ................................................................................................. 370Known points ................................................................................................... 370Summary ......................................................................................................... 374Results ............................................................................................................ 374Report .............................................................................................................. 374Total ................................................................................................................ 374Statistics .......................................................................................................... 375Known points ................................................................................................... 375New points ....................................................................................................... 376Observations ................................................................................................... 376Save polygon points ........................................................................................ 377Lock all calculated heights ............................................................................... 378Save net adjustment to drawing ...................................................................... 378Simulation of net adjustment ............................................................................... 379Import known points ........................................................................................ 379New points ....................................................................................................... 379Observations ................................................................................................... 380Database connector for ArcGIS .............................................................................. 381Open map ........................................................................................................ 381Disconnect ....................................................................................................... 382xiii
<strong>Topocad</strong>Add data .......................................................................................................... 383Save data ........................................................................................................ 383Refresh data .................................................................................................... 384Reconcile and Post.......................................................................................... 385Version manager ............................................................................................. 385Edit Attributes .................................................................................................. 385Group object .................................................................................................... 386Generate Subtype layers ................................................................................. 386ISM adapter ............................................................................................................ 387Index ....................................................................................................................... 389Glossary ................................................................................................................. 409xiv
Contents<strong>Topocad</strong> 10.0 help systemFunctionInstallationRegistrationGetting startedWhat is <strong>Topocad</strong>?Shortcut keysGeneral commandsSnap commandsSelect objectSettingsCommunicationFile menuView menuConstruct menuModify menuDrawing menuSystem menuDesign menuNet AdjustmentTunnel moduleOther modules:Railway moduleISM database connectorArcGIS databaseconnectorDescriptionHow to install.Registering your license.Starting to use <strong>Topocad</strong>What is <strong>Topocad</strong> and what does it do?Shortcut keys - Useful informationGeneral commands - Useful informationThe snap commands!How to select objects in a drawingProject and general settingsHow to communicate with instruments andimport/export files.Open, New document, Print etcZoom, Toolboxes, Area etc.All functions for creating new objects.All functions used to modify an object.Layers, Symbols, Sine types, External referencesetc.Code table, Attributes, Control codes, Symbols etc.Volumes, Profiles, Earthworks etcThe Net Adjustment add-on module.The Tunnel module.The module for railway measurement.The module for saving data to the oracle Spatialdatabase via the ISM adapter.The module for saving data to the ESRI ArcGISenvironment either via the ArcSDE database or thepersonal geo database.1
General installationTo get you started in <strong>Topocad</strong> there are a few things that are useful to know.Right mouse buttonA right click can be used at all times. This is an intelligent feature and it knowswhether or not you have selected objects, whether you are currently executing acommand etc and will always try to provide the most appropriate commands for thesituation.If there are no objects selected and you make a right click you will see: Repeat (thelatest used command), Select, Zoom, Pan, Drag, Redraw, Regen (regenerate), andthe most common construct commands; Polyline, Point, Circle, Arc, Text and Cancel,which cancels current command and also clears all selected objects.When you have selected an object and click on the right mouse button a differentmenu appears. Commands connected to the screen are still here; Zoom, Drag,Redraw and Regen, but also the most common Modify commands like Copy, Move,Rotate, Scale and Erase.When selecting a command we will see a further menu when clicking the right mousebutton. First and foremost the Snap function appeared here and also as an icon inthe menu to the left. The snap function follows by the most common screencommands and after that the most common commands of the Modify command youselected.Some general function commandsStart pointIn most of the modify commands you need a start point. This is what the commandwill relate to.Select objectThere are several ways to select an object and it can be done before or during thecommand.Escape, releaseYou can quit the operation with the Escape button. You can quit the selection withthe Escape button.Toolbox/Dialogue boxYou can close the toolbox but still continue working with the command.3
<strong>Topocad</strong>See alsoShortcut keysSelect objectSnap4
General installationGeneral functions<strong>Topocad</strong> is a CAD application for surveys, calculations, designing and mapping. It is used in graphicmode while working on drawings or in other graphic windows. Some documents are in text mode, e.g.roadline, road profile, camber diagram etc.5
<strong>Topocad</strong>InstallationWindowsInstallation of <strong>Topocad</strong> requires Windows NT 3.5, 4.0, Windows 98, Windows 2000 or Windows XP.Disk storage space<strong>Topocad</strong> requires about 100 MB of hard disk space.MemoryAt least 64 MB RAM memory. We recommend 256 MB.To install <strong>Topocad</strong>See special instructions. These can be downloaded from our Internet site.See alsoRegistration6
General installationSelect objectThere are several ways to select objects.You can select them one at a time by clicking on each one individually. To select allthe objects that are completely inside an area, click to the left of them and drag themouse to the right. Click again. All the objects that were completely inside therectangle are now selected.To select all objects that are partly inside the rectangle, click on the right-hand sidefirst and drag the rectangle to the left. All the objects that were partly inside therectangle are now selected.Objects can be deselected by pressing the Ctrl key when selecting one or moreobjects. You can deselect objects individually, using the window or cross command.Selection possibilitiesPoint at a surface to select it. If there are several surfaces or point (points on polyline)a list will appear where you can select the correct object.7
<strong>Topocad</strong>Select by polygonYou can select objects inside, partly inside (crossing), outside or partly outside apolygon. This is done by right clicking.Select by entityEntities for selection are point, line, circle, clothoid and roadline.SelectionCrossing: Objects that are crossing selected area will be selected.Inside: Objects that are inside/outside selected area will be selected.Point8
General installationRadius sets which radius around the point that shall be used for selection.Line, roadline and chlotoideOffset left sets distance to the left of the line.Offset right sets distance to the right of the line.ArcInside sets the distance from the arc towards the middle.Outside sets the distance from the arc and outwards.See alsoToolbox - Selected objects.9
<strong>Topocad</strong>Shortcut keysThe following shortcut keys are used in <strong>Topocad</strong>:File commands:Ctrl + SSaveCtrl + OOpenCtrl + NNew documentCtrl + F4Close current documentAlt + F4ExitEnter, space bar Repeat last commandEscapeAborts current command, exits selectionF2DoneF12Save as...Zoom or similarCtrl + DDragCtrl + WZoom windowCtrl + PZoom previousCtrl + AMax. zoomHomeZoom in everythingCtrl + Page UpZoom scale 4xCtrl + Page Down Zoom scale 0.25xPage UpZoom scale 2xPage Down Zoom scale 0.5xCtrl + RRedrawShift + F5RegenerateCtrl + IPoint infoCView co-ordinatesShift + UEdit as textDMeasurementCtrl + FFilterEdit command (texts)Ctrl + CCopyCtrl + VPaste (text)Ctrl + XCut (text)DelDelete (text)Ctrl + DelDelete all, delete row (text)Ctrl + InsAdd, add rowConstruct & ModifyCtrl + L Draw line (right click )PDraw point (right click)KCreate spiral (clothoid)TWrite text (right click)10
General installationHDCtrl + CCtrl + QOSFCtrl + TZDeleteCtrl + MCtrl + RCtrl + JCtrl + BShift + EShift + XCtrl + XCtrl + EShift + OShift + GShift + AShift + TShift + DShift + LMisc.Ctrl + ZShift + Ctrl + ZLSlope hatchingDimensionCopyFillet(OffsetInsert symbolFill areaCreate DTMCreate contour linesDeleteMoveRotateJoinBreakExtendExplodeTrimChange propertiesChange object orderChange groupEdit attributeEdit textEdit DTMEdit lineUndoRedoLayer manager11
<strong>Topocad</strong>SnapSnapIf the command you are using supports snap mode you can access the snap menuby right clicking, e.g. all construction and modifying commands. There are also iconsfor snap commands in the toolbar for easy access.CentreSnaps to the centre point in a circle or radius.End pointSnaps to the end point of a polyline or radius.Insertion pointSnaps to the insertion point in a text, attribute or symbol.Intersection pointSnaps to the intersection point of two polylines or radii.Mid pointSnaps to the mid point of a polyline or radius. Note that mid point between two pointsis not the complete polyline.PerpendicularSnaps to a perpendicular angle to a line at the last point you clicked it.NearSnaps to the nearest point.NodeSnaps to the node point in a polyline, point or radius.NoneNo snap at all.Snap lockLocks the snap until another snap command is selected. Be aware that the snapfeature may be locked for some commands where snap commands are not available.For example if you are using the Offset command and need to click on one side.Orthogonal snapSnap using orthogonal settings. See Settings and Baseline for more details.12
General installationPerpendicular snapSnap using perpendicular settings. See Settings for more details.Length snapSnap by length.The settings are created in Settings (for example you can set thelength snap to every 0.1m).Snap settingsThe settings for the snap can be accessed using the relevant buttons.Snap in profile formIn the profile form you are able to snap on the terrain models, and on insertedprofiles. Implemented snap functions are snap nearest, snap endpoint, snapmidpoint, snap length and polar tracking. You find the functions in the toolbar.13
<strong>Topocad</strong>To startThe easiest way to start is to attend a <strong>Topocad</strong> training course. It is also possible topurchase training materials.14
File infoFileFunctionNew documentOpenCloseSaveSave as...Return to savedImportExportSettingsSelect projectRegister programPreviewPrint outPrinter settingsExitDescriptionCreates a new document.Opens an existing document (drawing, survey file, etc)Closes the current document.Saves the current document.Allows you to save the current document under adifferent name.Returns to the last saved drawing.See separate menuSee separate menuSee separate menuProject selectionRegister or re-register <strong>Topocad</strong>.Preview your printout.Exits the application.15
<strong>Topocad</strong>New documentFile|NewCreates a new document in a new window. The following types of document can becreated:Drawing (.top)Creates a new drawing - this is the most important component of <strong>Topocad</strong>. It is agraphic view of the map and drawing. You can change to the text edit view from thegraphic view. See also Default drawingCo-ordinate files (.pxy)This is a window for entering co-ordinate files in .pxy format. It is possible to import.pxy files into .top format, and export .top file to .pxy format, but other than this thetwo file types are not compatible.Survey data (.sur)A survey data document contains all of the survey data. This file type can be used toimport files from different overall stations and to edit new survey data. Whencalculating survey data for co-ordinates, a drawing document will be needed and thiscan be created from the survey document.16
File infoTraverse document (.trv)The traverse document contains all values relating to the traverse. The traverse canautomatically load data from the Survey data file (.sur) or the data can be enteredmanually.<strong>Topocad</strong> Roadlines (.trl)<strong>Topocad</strong> Roadlines is the format for roadlines and they are created in this format. It isalso possible to import the .trl format into <strong>Topocad</strong> drawings.Text files (*.*)This is a simple word processor. You can edit your drawing text here before copyingit into the drawing.PP files (.pp)This is a special kind of document in which polygon points can be entered. This filecan be imported to and exported from the <strong>Topocad</strong> drawing format .top.Road Profile (.trp)Contains section and height data for road profiles.Digital terrain model (.dtm)Created digital terrain models. Not available by selecting New.Section Template (.tst)This is used to build up road sections etc. to be used for volume calculations.Cross Sections (.tcs)The calculated sections are saved as this file type.Camber diagram (.tcf)The camber settings can be saved in a file for use in the profile form etc.Profile Form (.tpf)The form for longitudinal sections and terrain longitudinal sections.Net Adjustment (.tna)The net adjustment is stored in a special file format.17
<strong>Topocad</strong>OpenFile|Open/Close/Save/Save asShortcut key Ctrl + OOpens your document. A path list appears on the left. Select the file format you wantto open - see New document for a table of file formats.CloseCloses the current document. Asks whether you want to save it.SaveShortcut key Ctrl + SSaves the current document. See also Windows - close all.Save as...Shortcut key F12.Allows you to save the file under a different name and/or to a new location.You can also save the file in an older version:• Drawing - version 8.0 and 9.0• Survey data - version 8.0• Roadline - version 8.0• Net adjustment - version 8.0• Terrain model - version 8.0• Profile - version 8.018
File infoReturn to savedFile|Return to savedUndoes the changes that have been made since the drawing was last saved andreturns to the last saved copy of the drawing. No undo.PreviewPreview of current plot view.File|Preview19
<strong>Topocad</strong>Select projectFile|Select projectIt is possible to save files and drawings anywhere but we recommend that you saveall files in the project to the same folder. The current folder can easily be specified inSelect project.The directory list is on the left and the Quick list is on the right. It is possible to selectdifferent hard drives or units from the Quick listWhy work with a defined project?This action means that:• The default folder for open files will be the project folder.• The default folder for saving new files will be the project folder.• You can use the project folder as the default for files containing known points.See Settings for more information. This makes it possible to use the samename for every file containing known points.• You can define your specific project settings, and they will be stored in theproject.To select a project:1. In the list of directories on the left, select the directory you want to use foryour project by clicking on it.2. Click Add to create a new Quick list entry. In this dialogue box the directory isshown at the top, with the name of the quick list below. Enter a name for yourproject. Click OK.3. Click on the project in the quick list. You have now selected this directory asthe directory for the project. Click OK. You only need to select another projectin this dialogue box if you start work on a different project. The selection issaved when you quit <strong>Topocad</strong>.Explanations of the dialogue boxNew directoryTo create a new directory, click on New on the right-hand side.Quick listThe Quick list works as a pointer for the project and helps you to find your projectmore easily. You can use any name in the quick list.Add to Quick listAdds a Quick list name - see above.20
File infoDelete project in Quick listClick here to delete a Quick list name. Note that this does not delete the directory -only the quick list entry.21
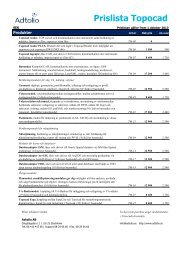
<strong>Topocad</strong>RegistrationFile|RegistrationThe first time you run <strong>Topocad</strong> you will be asked to register. Click Yes. There are two ways to register:online or by fax.Online registrationType in your control code. Your registration is then complete.Fax registrationPrint out the registration form - fill in the form. It is especially important to provide your contact details.Your lock code appears. Print out the completed form and send it to us. You will receive a fax backfrom us with your authorisation code.Input license information - When you have the authorisation code you should return to the registrationscreen to input the license information. You can then begin to use <strong>Topocad</strong>.License numberYour license number has the format A-BBB-C-XXXXwhere:A = Type of license, 1 for standardB = Country codeC = Type of lockX = NumberControl codeThe control code is entered during online registration.The add-on modules are:Design 01Profile 02Volume model 03Net adjustment 04Tunnel 05<strong>Topocad</strong> survey 08<strong>Topocad</strong> earthworks 09and more...A design <strong>Topocad</strong> installation will include modules 01 02 03 08 and 09.Borrow licence22
File infoBorrow licence is used to borrow/check out a licence from a common licence server.The function is active only for network licences. The user chooses end date forborrowing the licence in the dialogue box and clicks OK. Maximum time for borrowinga licence is 30 days. The borrowed licence will expire at midnight. If choosing today'sdate as end date the licence can be borrowed until midnight. When the end date haspassed the licence will return automatically to the licence pool.Return licence is used to return a borrowed licence earlier than the end date. It isonly the person borrowing the licence who is able to return it.23
<strong>Topocad</strong>Print outFile|Print outPrint out your documents. You can also select the printer and change the print options from thiswindow.SelectTo set up and select the printer. See Printer settings. In the setup you select the paper orientation andpaper size. You may also be able to specify paper cartridges etc.Plot typeDisplayPlots everything that is currently displayed on screen. (The active zoom command.)ExtentsPlots everything you have in the document. This is the same end result as if you had zoomed toExtents.WindowSelect with the mouse or enter the window you want to plot. If you want to select the window with themouse, click on Window or Orientation. You can select the window with the mouse first and adjust thevalues in the dialogue box afterwards if necessary. It is also possible to select the size by rightclicking.ScaleSelect Auto scale if you want the plotted area to fit into the plot. You can also select a scale. If a scaleis selected the printer will start with the selected lower left corner and plot/print the area that the paperformat will cover with the set scale. The default scale is the one set in Drawing|Drawing scale.24
<strong>Topocad</strong>Printer settingsYou can select printers and plotters here and also edit the printer settings.The procedure is as follows:File|Printer settings1. Go to File|Printer Setup. You can also click on Select in the print dialogue box.2. Select printer.3. Select the paper format and orientation - portrait or landscape. Note that thedefault value for printers is portrait and the default value for plotters islandscape.4. Click OK.Note that there are different device drivers for different printers and plotters.26
File infoExitFile|ExitShortcut key Alt + F4If you try to exit without saving a document you will be asked whether you want tosave the file before closing it.27
SettingsFile|SettingsSystem settingsProject settingsFunctionProject DescriptionsettingsAxes Yes Settings for axis names, edit order.Angle Yes Settings for angles, clockwise, anticlockwiseetc.Co-ordinates Yes Co-ordinate systems settings.Decimals Yes Settings for number of decimal places todisplay.DisplaySettings for how objects are viewed on thescreen/display.SnapSnap settings.Drawing Yes Settings for default drawing and snap mode.PlotAppearance for points and radius whenplottingRoadline Yes Settings for different characteristics ofroadlines.System Yes System files There are four different types ofsystem files - attribute (tat), symbol file (tsy),code table (tct) and line type file (tlt)areentered here, including those for high priorityprojects.LanguageLanguage settingsPoint infoSettings for how the point info will bedisplayed in the drawing.Import/ExportSettings for import and export.ToolbarsSettings for toolbars, on/off, buttons.Folders /DirectoriesSettings for the folders to be used for drawingTolerances/ThresholdvaluesYessheet templates.Settings for tolerance /threshold values29
<strong>Topocad</strong>Survey Yes Settings for polygon points, known points file.InstrumentInstrument settingsRailwayRailway settings - only used in the Railwaymodule.MapMap sheet settings, Map sheet module.Database Yes Database settings, database moduleArcSDE30
SettingsAnglesFile|Settings|System settingsIt is possible to use any kind of angle system in <strong>Topocad</strong>. Select 360 degrees, 400GONS or 6.28 mills. Select which angle you want to identify as 0 and the direction ofrotation that will increase the angle values.Settings for anglesAngle directionSelect the direction you want to set as 0 using the mouse or on the relevant tab.Angle settingSelect 400 GON, 6.28 Mills (radians) or 360 degrees.RotationSelect whether it should be clockwise or anticlockwise.These settings do not affect stored data.31
<strong>Topocad</strong>See alsoSettings menu32
SettingsAxisFile|Settings|System settingsUnder Co-ordinate axis enter the name of the axis you want to use.Name of co-ordinate axis:Select the name for your co-ordinate axis. X and Y are the default names. Select thename for delta axes.Long name/Short name:Different words will appear in the application and print settings. Enter the names youwant to use as the long and short names respectively.Editing order:Select the order for editing. This can be changed whenever required.Select whether you want to increase the height upwards or downwards. The heightwill increase downwards in mines and when measuring seas and lakes.33
<strong>Topocad</strong>See alsoSettings menu.34
SettingsDecimalsFile|Settings|System settingsThis is where you select the number of decimal places for co-ordinates, heights,lengths and angles. It is also possible to select which character you want to use asthe decimal separator.Co-ordinate decimalsSelect how many decimal places you want to use for co-ordinates. This has no effecton the accuracy of the calculations. <strong>Topocad</strong> always calculates using 18 units. Notethat X and Y (North and East) follow each other.Angles and lengthsSelect how many decimal places you want to use for angles and lengths. This has noeffect on the accuracy of the calculations. <strong>Topocad</strong> always calculates using 18 units.Decimal separatorSelect whether you want to use. (point) or , (comma) as the decimal separator. Thisis important when transferring data to some field collectors or instruments. Checkwhich option is used in your field collector or instrument.35
<strong>Topocad</strong>See alsoSettings menu.36
SettingsCo-ordinatesFile|Settings|System settingsSettings for the co-ordinate system to be used in this project. Refraction and average height.You can use the average height if you want to compensate for heights but do not know the actualheight. Entering a height here will cause <strong>Topocad</strong> to compensate for this height in length calculations.Ellipsoid correction can be used if selected.Co-ordinate systems can be added. Enter a name, origin for X and Y (North and East), ellipsoid typeand average meridian.37
<strong>Topocad</strong>DisplayFile|Settings|System settingsThis is where you select how many radius segments are used and how points aredisplayed.Radius, circle segment:Enter a value for the number of segments you want to use for a lap. The defaultsetting is 200 but a lower value such as 40 or 50 is recommended. The lower thevalue entered here, the faster the drawing will be plotted in the display.Font, segments:As above but for fonts. This will only apply to <strong>Topocad</strong> ISO and <strong>Topocad</strong> ISO-F fonts.TrueType fonts are displayed in their own way.Point, style:You can select how you want points to be plotted on the drawing (screen) by clickingin the different boxes. You can choose from point, line, plus, cross, box and circle ora combination of these.38
SettingsPoint, size:You can select the size for points as a percentage of the screen or as a value inmeters (or feet). The default value is 2% but 1% is recommended.Display scale barIn drawings, in terrain models and in the viewer of survey data, a scale bar isviewable at the right bottom of the window.Invert zoom directionConfiguration for which direction the zoom on the mouse wheel shall respond to.Default for the software system (unchecked box) zooms in by rolling the mousewheel towards yourself.Use black backgroundClick the checkbox if you want black background in drawing windows. Default is whitebackground. Entire white colours will be black and vice versa.Line width (Lineweight in dialogue)The line width is useful for graphic representation of different objects and information.It works for polylines, points, circles, spirals, and road lines in the drawing. Objectshas the line width "According to point code" as default while layers have "Default".The value of Default sets under System Settings|Display.Display line width - Display line width or not. Displaying line width affects time anddrawing in a negative way.Default - Select which value the default line width shall be.Display scale - The scale of the line width in the drawing.Transparent dialoguesSelect between Only inactive dialogues, On and Off. Select transparency on thescaler.See alsoSettings menu.39
<strong>Topocad</strong>DrawingFile|Settings|System settingsThis is where the settings for default drawings are made. This is also where theperpendicular snap is set to either 2D or 3D.Allow duplicate Point IDs:Select whether or not you want the system to allow duplicate point IDs.Start ID for control code created points:If you have decided not to allow duplicate Point IDs it is best to use a number herethat cannot be duplicated by mistake.See alsoSettings menu.40
SettingsFoldersFile|Settings|System settingsThis is where you select the folder to use for the drawing sheet templates. Thetemplates should be created for a paper size of A1 (841 x 594mm) only.See alsoInsert drawing sheet.This is where report templates folders are set. The default folder is"C:\Program\Chaos systems AB\<strong>Topocad</strong>\Reports\"The settings for the folder containing the tolerance files are also made here.See alsoSettings menu.41
<strong>Topocad</strong>Import/ExportFile|Settings|System settingsThis setting aids the conversion of dxf and dwg format to and from the <strong>Topocad</strong>drawing format.Default drawing:The default drawing <strong>Topocad</strong>.dwg makes sure that the scale and orientation remaincorrect. It is possible to select another default drawing. This file version will also setthe version for exporting DWG files. If this is a R14 file the export will be R14.Use DOS character set:Click here if you are importing from or exporting to a DOS program.Export line as 3D poly:Tick this box if you want to use the heights in the destination system. If so, polylineswill be 3D.See alsoSettings menu.42
SettingsLanguageFile|Settings|System settingsThe language is set by default based on your settings in Windows. You can changethe language here. You will need to restart <strong>Topocad</strong> after changing this setting for itto take effect.See alsoSettings menu.43
<strong>Topocad</strong>Point infoFile|Settings|System settingsYou can display point info for standard points and points in polylines in <strong>Topocad</strong>. Thepoint info that can be displayed automatically is the point ID, height and point code.Preferences is a general setting for all the points that use point info. If you aredisplaying points with point info and you make changes to the settings you will haveto regenerate the drawing for the changes to take effect.The procedure is as follows:441. Go to System settings|Point info.2. Select the dX and dY distances from the point where you want the information(point Id, height and/or point code) to be displayed. Note that these distancesare either in metres or whatever unit is used in the drawing.3. Select whether or not the decimal separator will be the start point. (This onlyapplies to the height). If this is selected you will probably also set dX and dY to0.0.4. Select font. Note that only True Type fonts can be used.
SettingsSee alsoView - point infoSettings menu.45
<strong>Topocad</strong>SnapFile|Settings|System settings - SnapThe snap settings can be accessed directly from the snap menu.Snap settings3D perpendicular snapTo snap in three dimensions using perpendicular snap.Quick snapAuto snapReverse orderSnaps on objects starting from the bottom of the drawing order.Quick selectionFunction for selecting objects placed close to each other or on top of each other.46
SettingsQuick selection decides how the selection is made when selecting objects. If Quick selection ischecked, the first found object will be marked. All the objects in the drawing will be searched through ifQuick selection is unchecked. All objects that matches the selection are listed. Quick selection cantake a little longer time since it has to control all objects in the drawing.Show snap markerIndicates current snap.Automatic snapSettings for the automatic snap, some combinations are not possible.Entity selectionSelects objects from the bottom of the drawing order.Polar snap/trackingFor polar construction of lines, select the increment angle.47
<strong>Topocad</strong>MapFile|Settings|System settingsThese are the settings for the map sheet add-on module.Map tablesInformation about the map tables used is entered in a separate file. The file containsinformation about which coordinates the map charts start from (lower left corner) andthe size in North and East directions. See more information below.Map typesThe map can be divided into several different types of information and these will bedisplayed as tables when the map sheet is imported. Different types can beseparated with a prefix or suffix (extension). For example: if the map type isCADASTRE, all map sheets containing Cadastre information will be given the prefixCADAST_, e.g. CADAST_BF45 where CADAST stands for Cadastre information andBF45 relates to a specific map sheet.Format:Map sheets can be in AutoCAD dwg format or Microstation dgn format. <strong>Topocad</strong> topformat will folloMap directorySelect the directory in which you have stored the map sheets. Subfolders can beentered in the map table file.An example of a map table:The format, saved as a csv (comma separated format) file that can be created in MSExcel, is as follows:Map sheet name,Sub folder,X,Y,height,widthExample:48
SettingsAC035;AC;55600;97600;400;600AC036;AC;55600;98000;400;600AD036;AD;56000;98000;400;600A subfolder can be empty but requires an extra , (comma).49
<strong>Topocad</strong>DatabaseFile|Settings|System settingsInformation about the database to be connected to <strong>Topocad</strong>. This databaseconnection is only for specific or known points. Almost all types of databases can beconnected, including MS Excel and SQL databases. To connect and collect all themaps stored in a database you can use any of our other database connections, e.g.ISM adapter.DatabasesAdd, edit or delete your database connections.Search criteriaYou can select whether you want to use the known point file (pp file), the database orboth.EditingDatabaseEnter the name of the database.Point columnsEnter the names of columns in the database for the point information.Attribute columnsTableEnter the names of columns in the database for the attribute information.50
SettingsAttributeEnter the names of columns in the database for the point information.Connection stringTo find the right databaseRequest the user name and passwordA separate login can be created.51
<strong>Topocad</strong>InstrumentFile|Settings|System settingsType in the instrument(s) you are using and the accuracy they have. The settings willbe used in survey data calculations and in the Net adjustment.52
SettingsTolerancesFile|Settings|System settingsDifferent tolerance settings can be saved and used. Many different tolerances can beset. The tolerance files are stored in the settings for folders.Five different settings can be used for different actions:No action takenInformation - Shows whether the tolerance or limit value has been exceeded.Mark - The value is entered in the report, usually in bold.Warning - Warning note, the calculation will continueError - Error message, the calculation has been interrupted53
<strong>Topocad</strong>RailwayFile|Settings|System settingsThe railway setting is only found in the Railway module.Track width:Enter the width for the track. Used for certain calculations.54
SettingsArcSDE settingsFile|Settings|System settings - ArcSDEConnection to ArcSDE is an add-on module for storage and for loading from theArcGIS database. Data can be stored either in the ArcSDE database or in a personalgeo data base. Settings created here are for the database and creation of maps.Map directory:Enter the folder in which the ArcSDE database is located.Maps:The maps are listed here. Clicking New or Edit opens the following dialogue box:55
<strong>Topocad</strong>The layer for this map and the order of the layers are selected. This order is the sameas the drawing order. Layers above will be drawn later and will therefore appear ontop.Adding or editing a layer opens the following dialogue box:56
SettingsThis allows you to determine how every layer in the map, including sub-types, will be displayed in<strong>Topocad</strong>. Select the colour, line type and line scale for each layer. Symbols connected to the layer areselected from the symbol file. Sub-types can have their own settings.If objects in the layer have a valid point ID and point code the attribute table shouldbe entered here.Sub typesPossibilities to exclude objects with certain sub types when opening map.Rotation columnHere you are able to set the rotation direction on symbols via an attribute.Column: The attribute column which rotation shall be picked from.Style: The style which the rotation is stated in. (arithmetic or geographical)Unit: The unit which the rotation is stated in (degrees, gon or radians)Fix: The rotation can also be stated as a fixed angle which goes for all symbols.57
<strong>Topocad</strong>The rotation attribute of the symbol updates when rotating the symbol in drawing.58
SettingsRoadlineFile|Settings|System settingsThe settings for the road length, slopes and cross slope are made in the roadlinepreferences.Thousand metre separator:Select the character you want to use as the thousand metre separator. e.g. 1/400 or1+400 for the section 1400.Slope:Select the unit you want to use for the slope. You can select percent % or per mill ‰ .Cross slope:Select the unit you want to use for the cross slope. You can select percent % or permill ‰ .Back to Settings menu.59
<strong>Topocad</strong>SurveyFile|Settings|System settingsYou can select the name and location for the polygon point file in Surveypreferences.For example, you can use a common polygon point file (.PP) and store it in the<strong>Topocad</strong> library. However, it is more common to have unique polygon point files foreach project. It is important that the existing polygon point file actually has the namethat is selected here. If not, the system will be unable to find it and will not be able tocalculate a survey data file.Tip! Make sure that the selected polygon point file name is the one you have used in your survey and that thecorrect project is selected when you calculate the survey data.Polygon pointsEnter the name of the file in which polygon points (known points) are stored. Thedefault name is <strong>Topocad</strong>.PP.60
SettingsThe PP file should be saved in the project directory:If it is, select this box. In this case you can give the pp file the same name in everyproject.Calculate survey dataCalculate mean values for points measured more than once.Select this option if required.Calculate the mean value if there are several backsights on the stationif the station has several backsights a mean value can be calculated.Refer to Select project for more information about the selected project.Back to Preference menu.61
<strong>Topocad</strong>System filesFile|Settings|System settingsThis is where you can select different symbol files, attribute files, code tables and linetype files. By clicking in the box ... you can select a different file for each one of thefile types.See also:• Drawing|Symbol• Drawing|Line typeBack to Settings menu.62
SettingsToolbarsFile|Settings|System settingsThe toolbars are displayed on screen but can be closed. This function allows you toreactivate them.Reset positions is useful if the buttons are too far to the right or not displayed at all.Back to Settings menu.63
<strong>Topocad</strong>PlotFile|Settings|System settingsAppearance for points and radius when plotting is controlled by the tab Plot inSystem Settings.64
ViewViewFunctionDescriptionZoomZoom commandPanPan command in zoomDragDrag command in zoomRedrawRedraws the drawing but does not update it.RegenRegenerates the drawing and updates it, including anylayers marked "hidden".ToolboxToolbox with different toolboxes for co-ordinates,roadlines, entities, filters, co-ordinates and edit as text.- Co-ordinates Co-ordinates toolbox - very useful for editing andconstructing points and lines.- Edit as text Graphic objects in text mode.- Roadline Roadline toolboxPoint infoShows the point ID, point code, height and nodes.Co-ordinatesShows co-ordinatesMeasurementMeasures angles and lengths between differentobjects and can be used to place info into the drawing.AreaShows and calculates areas.Show nodesShows point nodes in polylines.3D viewDisplays selected objects in 3D perspective mode.65
<strong>Topocad</strong>ZoomView|ZoomFunction, commandSave viewDragPanRedrawRegenDescriptionSaves the current view.Drag the display aroundRedraws the screenRegenerates the screenZoom has its own sub-menu that contains the zoom functions.The menu will appear on screen when it is activated by right clicking.WindowShortcut key Ctrl + WLeft click and drag to the second corner. You will zoom in on the area inside therectangle.PreviousShortcut key Ctrl + PReturns to the last view.NextShortcut key Ctrl + NZooms to the ”next” view if there are any previous views.Max.Shortcut key Ctrl + AZooms to the max. limit for the current zoom.ScaleZooms to the selected scale. This is the only way to zoom to a larger area than thearea of the objects in the document.0.25xShortcut key Ctrl + Page Down0.5xShortcut key Page Down0.8x2xShortcut key Page Up66
View4xShortcut key Ctrl + Page UpAllShortcut key HomeZooms to the full area of the objects in the drawing.Save viewView|Zoom|ViewShortcut key Ctrl + VSave view is a command that enables you to save the current zoom. You can thentoggle between different views while working in the drawing.PanView|Zoom|PanPan is used to pan the drawing on the screen in the selected direction. Click on apoint at the drawing. Pan the mouse in the direction you want the drawing to appear.Click again.DragShortcut key Ctrl DDrag is a fast command to place the drawing in the position you want it.View|Zoom|DragActivate the command. Left click and hold down. Drag the drawing to the position youwant. Note that you can watch the movement of the drawing during the operation.The "hand" will be displayed until you click Escape or use any other zoom command.RedrawShortcut key F5View|RedrawRedraws the screen and helps to get rid of small points, frozen crosshairs etc. thathave occurred while working in the drawing.67
<strong>Topocad</strong>RegenView|RegenRegen is used to update and regenerate the drawing. It is a more comprehensivefunction than redraw. Regen sometimes has to be used for modifications regardingcolours and line types to take effect.Layers that are frozen are not included when regenerating a drawing.68
ViewToolboxToolboxSelectionFilterView|ToolboxFunctionThe entity toolbox shows how many objects arecurrently selected.The filter toolbox is used to select different layers, typesof objects, line types, colours or co-ordinates.Shows the co-ordinates for the last selected point.View points and points in lines in Edit as text mode.Co-ordinatesEdit as textCommandRoadlineView different sections and offsets from the roadline.3D View Drawing and terrain models can be viewed in 3D.Command history Shows the command history.Toolboxes are dialogue boxes to assist you in your work. There are four toolboxes.You can move them about on the screen and you can close them by clicking the topleft corner.SelectionThe entity toolbox shows how many objects are currently selected. It also shows howmany of the objects have been selected several times.FilterShortcut key Ctrl + F69
<strong>Topocad</strong>The filter toolbox is used to select different layers, types of objects, line types, coloursor co-ordinates. You select the box for the layer, object, line type, colours and/ormax/min co-ordinates and then select using the normal select command in thedrawing. Only the objects which match your specifications in the filter box will beselected.It is possible to select several layers at the same time.The filter settings can be saved.Co-ordinatesThe Co-ordinates dialogue box shows the co-ordinates for the last selected point.You can use it to enter co-ordinates when you have closed the ordinary dialogue box.This is often used when you need to enter a point or polyline. It can also be used forthe other Construct and Modify commands. Different types of entry are possible, andyou can also select different types of entry for different points in the same polyline.• Co-ordinatesUsed to enter co-ordinates in the current co-ordinate system. If a user coordinatesystem is being used the local co-ordinates are entered here. PressEnter when the co-ordinates have been entered.• Delta-distanceThis is used to input a delta distance in the current co-ordinate system. EnterdX, dY and/or dZ.• Distance/bearingContains the values for distance and bearings from the last point. The bearingis specified in the current co-ordinate system. .70
ViewCommandThe command toolbox is used to view the command dialogue boxes. The commanddialogue boxes are the ones open when you are modifying or constructing. If youprefer you can close them and work completely from the context menus. You can usethe command toolbox to open up the dialogue boxes again.Edit as textShortcut key Ctrl + UIt is possible to view points and points in lines in Edit as text mode. They will bedisplayed in a grid and all ordinary edit functions for the grid can be used. The Copycommand can also be used.Roadline/sectionThis dialogue box is used to view different sections and offsets from the roadline. Ifthere is no current roadline you can select one by clicking on the ... button. This willopen the Roadline manager.Roadline current point71
<strong>Topocad</strong>This toolbox is for roadline construction and displays:• · The X- co-ordinate• · The Y- co-ordinate• · The section• · Any radius the point may have.• · The bearing from the pointTo the right is a small column where you can mark and lock the specific field for thisspecific point.When this toolbox is highlighted and a line is selected you will see the cross of theangle at every point in the line. These are the points which can be modified with thiscommand. When the roadline is finished you need to select Save roadline.3d viewSee chapter 3D viewCommand historyThe dialogue shows the latest commands. Click on optional command to openthis command.72
ViewPoint infoView|Point infoShortcut key Ctrl + IView point info is a quick way to view the point ID, heights, point codes or pointnodes for different objects in the drawing. The settings for these are made inFile|Preferences.To view point information:1. Select View Point info.2. Select the objects you want to view the information for. Click on Select andthen either click on each object individually or select using the window orcrossing methods.3. Click on View for the point ID, height and/or the point code. The informationwill be displayed directly on screen.4. Click OK when you have finished.To hide the information do the same but click Hide instead.Code DescriptionDescription of point code is viewable for points and lines in drawing. The descriptionuses the same printing settings as the code.TIP! It is possible to separate the point information from the object by selecting Explode.See also:• System settings - Point info73
<strong>Topocad</strong>Co-ordinatesView|XYZShortcut key CXYZ is a function that allows you to see the exact co-ordinates for a point. Thiscommand is different from Toolbox|Co-ordinates in that it operates with snapcommands only. There is no input function.To view the co-ordinates for a point:1. Go to View|XYZ.2. Snap on the points you want to see the co-ordinates for.74
ViewMeasurement/distanceView|DistanceShortcut key MThe procedure is as follows:1. There are two steps - one for measuring and the other for inserting the valueinto the drawing.2. Measure the distance. The result will be displayed with the distance, slopedistance, dX, dY, dZ and bearing. Select the value you want to insert and clickAdd. Go to the Insert tab. Select the text height, font etc. The orientation is theone you have just measured. You can change the direction either by clickingon the arrows or by manually entering another value.3. Insert the start point for the text.See also:75
<strong>Topocad</strong>• Dimension76
ViewAreaView|AreaShortcut key AThe Area command is used to measure the area of an object. The measured area isthe sum of the area between the selected points. It is also possible to select anotherarea and either subtract or add it to the first area.To measure an area:1. Go to View|Area.2. Use the mouse to click on the points that you want to measure. You can alsoselect points to be excluded. Use the snap command if required. The distancecan also be viewed.The area and its co-ordinates can be logged and presented as a report. You canname the report.77
<strong>Topocad</strong>Show nodesView|Show nodesShortcut key NThe show nodes command shows nodes (points) on polylines. The oppositecommand is hide nodes. The command shows all nodes in the drawingSee also:• Object properties78
View3D ViewView|3DDTM|DTM|3D viewTDTM|DTM|3D viewDrawings and digital terrain models (DTMs) can be displayed in 3D view. The objectcan be rotated and panned in three dimensions so that you can view the object inperspective.The drawing is selected and displayed in 3D view. It is possible to display just a smallpart of the drawing in 3D. The command is accessed from View|3D.In the DTMs and tunnel DTMs it is possible to view by going to DTM|3D view.Explanation of the menuAddAdds another DTM or tunnel DTM to the view. This command is not active in the 3Dview of drawings.79
<strong>Topocad</strong>File|Save imageSaves the image in bmp format.ModeFor drawings and .top files there is little difference between the modes. For the DTMsyou can choose between:Wireframe WDisplays a wire model with triangles and measured lines.Flatshade FDisplays the surfaces in the model without the wireframe.Outlined ODisplays the surfaces and network at the same time.Alpha blending AAlpha blending puts a filter on the colours to make them softer.Smooth shade (only in DTM)Smoothes the triangles in the DTM.View|SettingsSettings can be either globally or for current drawing.Reference plane: Height and colour of reference plane.Point: Style, choose between dot, 3D cross, cube and filled cube, and size ofdisplayed points.View|Zoom|ExtentsZoom extent of current selection.80
ViewView|Selection onlyToggle between visualization of selection and visualisation of entire drawing.Selected entities will be highlighted if ”selection only” is unchecked.Selection|Lock|UnlockLock current selection (”View|Selection only” has to be checked) prevents 3Dwindow from drawing any changes made to selection. Unlock enables 3D window todraw current selection. Selection can be made from 3D window if”View|Selection only” is unchecked or ”View|Selection only” ischecked and selection is locked.Reference plane (only in .top files and drawings)The reference plane is displayed on a fixed level, the default level is 0.TrianglesViews the triangles in the DTM.Measured linesDisplays the measured lines in the terrain model.Erased trianglesDisplays the erased triangles.Z scaleYou can set a Z Scale in the View menu.ColorsGreyViews the DTM in grey.ThermicViews thermic colors - the colours are sorted into darker colors (dark blue) at thebottom for lower heights and brighter colors (yellow) for the higher parts.By codeThe colors are created from the code table.By raster imageDisplays inserted raster image (DTM only). See also DTM document.81
<strong>Topocad</strong>Full screenView|Full screenShortcut F11Maximizes current CAD window.Toolbox for field module with field commands and maximize/minimize button alsoappears.82
CommunicationFile|Import/ExportFunctionFiles - Import & exportImport SokkiaImport PsionImport LeicaImport TrimbleImport Map sheetImport DatabaseExport SokkiaExport PsionExport LeicaExport TrimbleImport and Export toLandXMLImport and Export DWGPort settings for LeicaLeica configurationTrimble labelconfiguration TrimbleRoadline exportDescriptionImport and export files. Co-ordinates files,drawings etcImport survey data and co-ordinates from Sokkiainstrument.Import survey data and co-ordinates from Psion.Import survey data and co-ordinates from Leica.Import survey data and co-ordinates from Trimbleinstrument.Import data from map sheets.Import points and geometry from databases.Export co-ordinates and roadline data to Sokkiainstrument.Export co-ordinates to Psion field computer.Export co-ordinates and roadline data to Leica.Export co-ordinates and roadline data to Trimble.LandXML, standard formatImporting and exporting DWG files.83
<strong>Topocad</strong>File import and exportCommunicationCommandImport filesExport filesFile formatGeneral importGeneral exportWhat do the files contain?DescriptionFile importFile exportGeneral file import - coordinate files, survey filesGeneral file export - coordinate files, survey filesWhat is imported and exported?Communication covers all types of communication that are possible in <strong>Topocad</strong>,including files as well as communication with field computers and all stations.Import filesFile|Import|FilesA wide variety of different file types can be imported into <strong>Topocad</strong>. The first step is todecide what type of data you want to import and then select the appropriatedocument.Data type DocumentCo-ordinates Drawing (.TOP)Drawing Drawing (.TOP)Survey data Survey data (.SUR)How to import co-ordinate files:1. First open the document (drawing) you want to import to. This can be anexisting drawing or a new one. If you want the objects from the imported file toappear in a special layer, select/create this layer and set it as a current layer.2. Select File Import|File. The Open dialogue box is displayed. Select theappropriate file format (extension) you want to import from. If the file is notlocated in the selected project directory, you must navigate to the appropriatedirectory. Then click on the file.3. Click OK.84
CommunicationExport filesThe procedure is as follows:1. Open the drawing document you want to export from.2. Select the object(s) you want to export. You can select them one by one or byopening a window and selecting several (all) objects. Note that moving acrossthe window from right to left will select all objects and moving across thewindow or rectangle from left to right will only select objects that are totallywithin the rectangle.3. File|Export|File. Select the type of format you want to export to.4. Enter a file name. Click OK.See alsoWhat do the files contain?File formatThe following file formats are supported in <strong>Topocad</strong>:File type File format/programImported to/fromTOP <strong>Topocad</strong> <strong>Topocad</strong>DWG AutoCAD drawing format DrawingDXF AutoCAD exchange format DrawingXML LandXML Drawing, survey data, profileDGN Microstation design file - 2D DrawingGSI Leica file formatSurveydata/drawing/roadline/profileGDT Trimble file formatSurveydata/drawing/roadline/profileODB Geodos co-ordinate format Survey data/drawingPSI Geodos roadline formatSurveydata/drawing/roadline/profilePXY GEO/Point co-ordinate file DrawingXYZ Marit co-ordinate file DrawingLIN Point/GEO roadline RoadlinePRF Point/GEO road profile Road profileDVL DRD roadline format RoadlineDPL DRD road profile Road profileTRL <strong>Topocad</strong> roadline DrawingRBB DRD co-ordinate file DrawingDTS DRD sections DrawingPP <strong>Topocad</strong> polygon point DrawingSDR/RDTSokkia SDR formatDrawing242, 243 Geosecma co-ordinate files Drawing85
<strong>Topocad</strong>* Generic import/export DrawingMIF MapInfo DrawingKOF Co-ordination and observation format DrawingGEO Geo co-ordinate file DrawingSHP ESRI Shape file DrawingGeneric import<strong>Topocad</strong> has a generic import function that enables any text-based file in ASCII(DOS environment) or ANSI (Windows environment) format to be imported to<strong>Topocad</strong>. It also requires every point to be separated by a carriage return (new line).The procedure is as follows:1. Open a drawing document .TOP.2. Go to File - Import and select File.3. Select Generic Import/Export as the file format (extension).4. Click on the file you want to import. Click OK.86
CommunicationThe file will now be read for generic import. You now have to describe the format ofthe file. First of all do you need to specify whether the file contains the co-ordinatesetc. in straight columns or separated by separators such as a comma or semicolon.<strong>Topocad</strong> attempts to identify the file format but may need some help to do so.The format description can be saved and then reloaded. If you have previously saveda file of this kind, you can load the file and proceed directly with the import.5. Select the row from which you want to start the import. Some files have initial rowscontaining additional information about the file that cannot be imported. You mustalso select the decimal separator used in the file (. point) or (, comma). Finally,specify whether it is a Windows ANSI or a DOS ASCII file format. Click the Nextbutton.Description for even columns/tabs/fields:The next step is to describe where the field limitations are located. <strong>Topocad</strong> will try tolocate them but may miss them, e.g. if they use a longer point ID further down thefile. You can drag the limitation field to change the width of any column, click at anypoint to create a new limitation or double click to remove a limitation. Click the Nextbutton.Description of delimitation characters:Select the type of delimitation characters. The pre-defined selections are tab (markedwith a rectangle), semicolon, comma and space. It is also possible to select any otherkind of separator. If several separators are used one after the other (as will probablybe the case with spaces), they can be ignored by checking this box. Text can bemarked with several different types of characters, e.g. ””, ’’, (),[], // or **. To skip them, check this box. Click the Next button.General:The next step is to define what each column contains. If the file has four numericfields, <strong>Topocad</strong> assumes that the first column is the point ID, the second is the X coordinate,the third is the Y co-ordinate and the fourth is the Z co-ordinate. If there areonly three columns, <strong>Topocad</strong> assumes that they are the X, Y and Z co-ordinates inthat order. This may not be correct, and you can select any other order here. Notethat it is also possible to import attributes and any other type of co-ordinate data.Click the Next button.Register file formatRegistering the file format enables you to open the same type of file from the Importfile dialogue box in the future.87
<strong>Topocad</strong>Generic exportThe procedure is as follows:1. Make sure you are currently in a <strong>Topocad</strong> drawing.2. Go to File - Export and select File.3. Select General Import/Export as the file format (extension).Select the objects you want to export. Press Done. (You can start selecting objectsbefore executing the command.Enter the file name and extension you want to give the file. Click OK.The Expert export dialogue box now opens - it contains three tabs. The second tabdepends on the type of separation used in the file. The template describing theexport file format can be saved and, if previously saved, can be loaded at this point.6. Select whether you want to use comma, semicolon, tab or any other characters asseparators in the file and whether the file is to be separated using aligned columns.7. Enter any text you want to appear in the file header. Select the decimal separatoryou want to use - (. point) or (, comma). Also select whether it is a Windows ANSIfile or a DOS ASCII file. Click the Next button.Description for files with aligned columns/fields:8. The next step is to describe where the columns are to be positioned and how widethey will be. Select a column and enter its width in characters. Also select whether itwill be left or right aligned. You specify the order by selecting from the list of activefields. You can also choose to add, insert or delete fields from the file. Click the Nextbutton.Description for delimitation fields:8. First select which fields (observations) you want to be included in the file and theorder in which they will appear. Select the separator type. The pre-defined options88
Communicationare tab (indicated by a square), semicolon, comma and space. You can also enterany other kind of character. Every field (column) can then be defined using thenumber of decimal places, the column width, right or left alignment, whether the fieldwill have a prefix and/or suffix and finally whether text is to be wrapped using differentkinds of characters. The pre-defined options are ””, ’’, (), []and **. Note that it is possible to export attributes. Click the Next button.General:Line connection.Select the type of line connection you want for this kind of file. The following optionsare available:NoneNo line connection.Line codeYou can specify a code for the line, i.e. 1 signifies the start of the line and -1 the endof the line. It is also possible to select a code for individual points.Line numberYou can also number your lines (polylines). Select the first line number. Every line inthe export file is then numbered in increments of the last number +1.Now enter whether or not you want to save the template for this export file format. Ifso, click Save and enter a name for the template. Now click Finish to create the file inthe specified export format.Register file formatRegistering the file format enables you to open the same type of file from the Exportfile dialogue box in the future.What do the files contain?FORMAT Point ID X Y Z Code Symbols Attributes LayerTOP format X X X X X X X XCo-ordinatefilesDrawingformatX X X X X - - -- X X (X) - X X X89
<strong>Topocad</strong>Import from SokkiaFile|Import|SokkiaLine:Select the line number or code to be used. These variables exist:• Line no/Point ID - coded with line number or point id (2.01, 2.02, 2.03 etc.)• Intermittent: The point number jumps and creates a new line.• Code group - Lines for each code group.• Control code - The control code specifies the start and end of the line. Seealso control code.• Cross sections - special type for measurements in sections.Roadline surveyAll values for sections are stored in attributes. Enter the ones that have been used.Control codesEnter which separator has been used between the different control codes.To import:1. Open the document you want to import into. To import survey data you willneed to create a .sur file. To import co-ordinates you will need to open anexisting or new drawing.2. Connect the Sokkia instrument or field computer to the computer.3. Click File - Import - Sokkia. Check that the same protocol has been set on theSokkia instrument. Check that the default settings are correct.4. Click OK. Note that survey data is sent to the <strong>Topocad</strong> survey data document(*.sur) and co-ordinates directly to the <strong>Topocad</strong> drawing document (*.top).90
Communication91
<strong>Topocad</strong>Import from PsionFile|Import|PsionData transfer with Psion is very easy. Connect the Psion to one of the serial ports.To import survey data:1. File|New. Create a new survey data document (.SUR). (It is also possible toimport additional data into an existing survey data file.)2. Connect the Psion to one of the serial ports on the computer. The Psion hasan integrated Comms link.3. Click on File|Import and then Psion.4. On the Psion select transmit and then the file number.5. Click on Receive in <strong>Topocad</strong>.To import co-ordinate data:1. Click File|New. Create a new drawing or open an existing drawing.2. Connect the Psion to one of the serial ports on the computer. The Psion hasan integrated Comms link.3. Click on File|Import and then Psion.4. On the Psion select transmit and then the file number.5. Click on Receive in <strong>Topocad</strong>.Line: Select line connection:• Line no/Point ID - Line number or point ID (2.01, 2.02, 2.03 etc.)• Intermittent: Point number jumps 1, 2, 3, 5, 6, 7• Code group - Lines for each code group• Control code - The control code specifies the start and end of the line.92
Communication93
<strong>Topocad</strong>Import from LeicaFile|Import|LeicaIt is possible to transfer data between the Leica instrument and GIF10, GRE3, GRE4and GSI (8- and 16-bit files). It is also possible to import co-ordinates from Leicadirectly into the drawing.Line:Select the line connection you have been using:• Line no/Point ID - enter either the line number code or the point ID (2.01, 2.02,2.03 etc.)• Intermittent: Point ID jumps 1, 2, 3, 5, 6, 7• Code group - Lines for each code group• Via code block - The Leica code block specifies the start and end of the line.• Control code - The control code specifies the start and end of the line.Control codesEnter the type of separator to be used for the control code.1. Open the document you want to import into. To import survey data you willneed to open a survey data document (SUR). To import co-ordinates you willneed to open a drawing.2. Connect the field memory/station to the computer. Note that the serial port onthe computer is male and can be 9 or 25 pin. The Leica cable is 25 pin so anadapter may be needed.3. Click File - Import - Leica. In the upper field select the type of field memory tobe used: GIF 10, GRE3 or GRE4.4. Click OK.94
CommunicationConfigurationDefine the code blocks you are using for specific items such as line start, point,attribute, station, etc. Different setups in the instrument must be the same here in<strong>Topocad</strong>.Remarks95
<strong>Topocad</strong>The code blocks 71 to 79 is remark information. The remark field can be a point code(common for remark filed 1 = code block 71) or an attribute. The attributes should beconnected to a point code because different point codes may have different attributesat the same remark field.AttributesConnect the attributes to use to the point codes. Different point codes may havedifferent attribute types but are using the same remark field.96
CommunicationSee alsoLeica, port settings97
<strong>Topocad</strong>Import from TrimbleFile|Import|TrimbleIt is possible to transfer data between a Spectra Precision instrument and Geodat,Geodimeter and the control unit (4000). All Geodimeter instruments from 400 andabove are compatible. ACU is now also compatible.To import a file:1. Open the document you want to import data into. To import survey data youwill need to open a survey data document (SUR). To import co-ordinates youwill need to open a drawing.2. Connect the field memory/station to the computer. Note that the serial port ismale on the computer and can be 9 or 25 pin.3. Click File - Import - Trimble. In the upper field select the type of field memoryto be used. This can be done automatically.4. Select the file(s) to be imported. A file list will be displayed.5. Click OK.Line connections:Label definedLine numbering 1 2, 3, 4, 6,7,Line numbering 1.01 1.02,2.01, 2.02, 6, 7,Control codeCodeThe label specifies the start and end of the lineIntermittent: When the point ID jumps a step, the startof a new line will be created.The first number is the line ID.The control code specifies the start and end of theline as well as other items.The same code will give the same line each time.Support for Zeiss M5 digital leveller.98
CommunicationRead more about point codes at Edit code table99
<strong>Topocad</strong>Export to SokkiaFile|Export|SokkiaTo export data to Sokkia, select the data and then click File|Export|Sokkia. Select thefield computer/station to be used and click OK. You can choose to save to a filewhich will then be sent to the station.Model:Select the type of model you are using. Alphanumeric or numeric.Job name:Input the job name you want to use.100
CommunicationExport to PsionFile|Export|PsionData transfer between Psion and Geodos is very easy. The Psion is connected toone of the serial ports. You can export co-ordinates directly from the drawing,roadlines (.trl), road profiles (.trp) or road camber (.tcf).To export co-ordinates:1. Open the drawing you want to export.2. Connect the Psion to the computer with its own Comms link.3. Select the object(s) you want to export. It is possible to select them one at atime or all together.4. Click on File - Export- Psion. The settings will usually be correct but it ispossible to change them under Port settings.5. On the Psion click Receive and select where you want to store the data.6. Click on Send.To export roadlines/road profiles and camber form:1. Click File|Export|Psion.2. Connect the Psion to the computer with its own Comms link.3. Check the [ ] Export road information box and click OK.4. A dialogue box will be displayed. Select which roadline (.trl), road profile (.trp)and road camber form (.tvf) you want to export.5. On the Psion click Communication and select an Excel file.6. Click OK in <strong>Topocad</strong>.7. Click Receive on the Psion.101
<strong>Topocad</strong>Export to LeicaFile|Export|LeicaIt is possible to transfer data between the Leica instrument and GIF10, GRE3, GRE4and PC Card with GSI files (8- and 16-bit). It is also possible to export roadlines androad profiles.To export to the instrument or field computer:1. Open the document you want to export.2. Connect the field memory to the computer. The Leica cable connection is a25-pin contact. You may need to use an adapter.3. Select the object(s) you want to export. You can select them one at a time orall together.4. Click on File|Export and then Leica.5. In the upper field select the type of field memory to be used: GIF 10, GRE3,GRE4 or GSI format. The settings will usually be correct but it is possible tochange them under Port settings.6. Click on Send.To export to a file (PC Card):1. Open the document you want to export.2. Select the object(s) you want to export. You can select them one at a time orall together.3. Click on File|Export and then Leica.4. Mark the box ”Export to file”.5. Click OK. Select file format - GSI8 or GSI 16.6. Click OK.102
CommunicationExport to TrimbleFile|Export|GeodimeterIt is possible to transfer data between a Spectra Precision instrument (Geodimeter)and Geodat, Geodimeter and the control unit (4000). Geodimeter instruments 402and above are compatible. It is possible to export co-ordinates from the drawing,roadlines (.TRL), road profiles (.TRP) and the road camber form (.TCF).To export co-ordinates:1. Open the drawing document to be exported.2. Connect the field memory to the computer. Note that the cable connectionsmay be a 25-pin contact. You may need an adapter.3. Select the object(s) you want to export to your instrument. They can beselected one at a time or all in one go in Windows.4. Click on File - Export - Spectra Precision. In the upper field select the type offield memory to be used. If you select Auto, <strong>Topocad</strong> will identify the type ofGeodimeter or Geodat being used.5. Click on the drop-down arrow next to Files. <strong>Topocad</strong> will list files in theGeodimeter/Geodat. You can use one of these files or type a new file name.6. Click on Send.To export road information1. Connect the field memory to the computer. Note that the cable connectionsmay be a 25-pin contact. You may need an adapter.2. Click on File|Export and then Spectra Precision. In the upper field select thetype of field memory to be used. If you select Auto, <strong>Topocad</strong> will identify thetype of Geodimeter or Geodat being used.3. Check the [ ] Export road information box and Click OK.4. A dialogue box is displayed. Select the roadline (.TRL), road profile (.TRP) androad camber form (.TCF) you want to export to your instrument.5. Click OK. The data will now be exported to your instrument.103
<strong>Topocad</strong>Leica configurationFile|Import|LeicaThe Leica instrument settings are totally defined by the user. There are numeroussettings that can be created on the Leica instrument or field book. <strong>Topocad</strong> has thesame settings and values that can be set as follows:Code functions:Point codeTransfer codeStart of lineEnd of lineEnd and start of linePointBacksightCheck pointThe different code blocks can either be controlled directly or connected to info blocks.In <strong>Topocad</strong> it is possible to input four info blocks for every code block.With the default settings code block -1 indicates the start of a line, -2 indicates theend of a line and -3 indicates a point. In the survey, using code block 1 automaticallyindicates that it is the start of a line.With the default settings, code block 4 is used for the station. In this case the codeblock has no function but the info block 1 is used for the point ID of the station andinfo block 2 is used for the station height. A unit is also specified for the stationheight. All units in Leica are in mm.The values used in info blocks are:StationInstrument heightPrism heightHorizontal lengthVertical lengthPoint codeRemarkPoint IDAttribute typeAttribute valueOrigin configurationCode Code block Info block 1 Info block 223 - Station Instrument height104
Communication46 - Point code Reflector height70 Point73 Start of line78 End of lineSuggested new configurationCode Code block Info block 1 Info block 223 - Station Instrument height6 - Reflector height1 Point3 Start of line8 End of line9 End and start of line105
<strong>Topocad</strong>Geodimeter label configurationFile|Import|TrimbleIt is easy to define labels 84-99 in the Spectra Precision instrument. In theGeodimeter this is called U.D.S. - User Defined System. The instructions below arefor <strong>Topocad</strong>. To learn how to create definitions in the Geodimeter see the bottom ofthis screen. You will find further instructions in the Geodimeter reference manual oryou can contact your local Geodimeter dealer.To define a label:1. Click the Config button.Some pre-defined label settings are listed. You can select from this list or delete themand add new ones.Label settings:The pre-defined label settings are:Start of lineEnd of line106
CommunicationPointEnd of line + Start of lineBacksight (Rear of object)Check pointRemarkAttribute typeAttribute (value)Labels relating to the same type of observation should ideally be set up as the samelabel but with different data. For example Label 99 is used for line numbering: data 1and -1 for Start of line, 2 and -2 for End of line, 3 and -3 for single point data and 4and -4 for End of line and Start of new line at the same point. In practicalmeasurements the instrument will request label 99 and you enter the data for 1, 2, 3or 4.The backsight and the check point can have the same label even when thesefunctions do not appear at the same point. The backsight function can be used in freestations. If you do not want to measure all backsights at once, measure them whenthey are close to your normal survey point.There is no need to enter a data value under Remark because text can be edited forthis label.Using U.D.S. in your Geodimeter:In the Geodimeter the user can define the labels 84 to 99. First, set the instrument toOn. Disconnect the double axle pendulum with function 22. (Function 22, [Ent], 0,[Ent]). To add a label press [PRG] [41] [Ent] (Create label). Select a label numberbetween 84 and 99. Press [Ent]. If the display shows F99 it is free to use. You cannow enter an alphabetic text by clicking the ASCII button and then entering the text.i.e. LINE = 78, 73, 78, 69. Press [Ent]. To finish press [Ent] again.This tells the Geodimeter that you want to use your defined label. To create your ownU.D.S. use [Prg] [40] and define all the labels that you want to use in the survey. Seethe Geodimeter manual for more information.107
<strong>Topocad</strong>Export roadline to instrumentRoadlineThe roadline can be exported to different overall stations. If you also have the Profileadd-on module you can export the profile line and camber to some instruments.Export to GeodosTo export:1. Open the roadline (.trl)2. Click File|Export|Geodos.3. Select Organizer or Workabout4. The roadline is already selected. Select the profile if required and the camberfile.5. Select whether you want to send the data or store it in a file.6. Click Send.Export to Geodimeter/TrimbleTo export:Export to LeicaTo export:1. Open the roadline (.trl)2. Click File|Export|Geodos.3. Select file name.4. The roadline is already selected. Select the profile if required and thecamber file.5. Select whether you want to send the data or store it in a file.6. Click Send.1. Open the roadline (.trl)2. Click File|Export|Geodos.3. Select the file name and instrument type.4. The roadline is already selected. Select the profile if required andthe camber file.5. Select whether you want to send the data or store it in a file.6. Click Send.108
CommunicationImport map sheetFile|Import map sheetMap sheets can be imported into the drawing. Settings are made in System|Settings.Select the terrain types that you want to import. Click in the drawing to display themap sheets. Click again to import the required map sheets.109
<strong>Topocad</strong>Import points from databaseFile|Import |DatabaseThe database configuration can be found in System|Settings. Enter your searchcriteria or hover the cursor over the drawing window to retrieve information from thedatabase.110
CommunicationLeica, port settingsFile|Import|LeicaGIF10GIF10 has 3 switches under a shelf at the lower edge of the box. Set these to:• Switch 1= Off (Up)• Switch 2= Off (Up)• Switch 3= On (Down)Standard settings for Leica GRE 3 and GRE4 to be found in Leica using [SET][MODE] 78 are:Baud rate 2400 baudData bits 7Stop bits 1Parity equal (2)Handshake RTS + DTR (ACK/NACK)111
<strong>Topocad</strong>Importing and exporting .dwg filesFile|Import|FileFile|Export|FileThe .dwg format can be imported to and exported from <strong>Topocad</strong> version 8.0.<strong>Topocad</strong> version 8.0 supports up to AutoCAD 2006 which uses the 2004 formatinternally.Some of the import and export settings are made under System settings -Import/export. These settings are used to export a 3D polyline, for example.When importing DWG files with integrated external references, you can choose howto import these external references - either as one drawing or as the original externalreferences in individual drawings.When importing, you can also select the scale to be used. This is particularly usefulwhen the .dwg drawing is in mm as <strong>Topocad</strong> uses meters.Import offollowing objectsfrom AutoCAD:PointLinePolyline2dPolyline3dPolylineArcCircleFaceTextMTextBlock ReferenceSolidAttributeAttribute Definition112
CommunicationTraceSplinePolyFaceMeshPolygonMeshAlso, all objects that are able to explode to the objects we support (for exampleDimension, Hatch, Ellipse, Wipeout, Leader, MLine)113
<strong>Topocad</strong>Import from Toptrans (Topcon)File|Import|Toptrans(Topcon)Levelling data from tcn files of Topcon are now importable to survey data files. In thesurvey data file, select File|Import|Topcon (DL 100c).Then select tcn file for import.114
SurveySurvey dataTraverseNet adjustmentFunctionSurvey data windowSurvey data calculationTraverseNet adjustmentDescriptionDescription of the survey data window, the sur fileHow to calculate survey dataCreate traverse.Work with Net adjustment.115
<strong>Topocad</strong>Presentation of the survey data windowThe window contains:Survey data windowTabMetadataSurvey data/EDM dataCo-ordinatesLevelling dataGPS data/observationsGPS co-ordinatesPreviewDescriptionMetadata for the survey.Observation data from total stationsCo-ordinate data imported from total stations.Data from levellersObservation data from GPS.Co-ordinates from GPSPreview of dataMetadataContains metadata such as administrative data, environmental data and instrumentdata.Survey dataFor more information refer to Survey dataCo-ordinatesCo-ordinates can be saved in the field and will be displayed here. These can be usedfor importing into the drawing. If you have both survey data and co-ordinates you canselect them.Find out more about point codes and control codes.Levelling dataData from levellers is recorded here and can be exported to co-ordinate files (pxy) orknown point files (pp).116
SurveyFieldStart height: The start height that will be used when calculating. When selecting nostart height the software system looks among the known points that have beenselected during calculation.End height: The height where the train ends. If the train starts and ends in the samepoint the start height is used irrespective of the user selected to use the start height.ColumnsObservation type:Move point - Reads backward and forward.Detail - Reads only forward, points that are not included in the train.Distance - Distance to pole.Reading - Read height of pole.Measured height - Height calculated by summarizing the height differences.Improvement - Which improvement that has been added to measured height aftercalculation.Calculated height - Adjusted heightPt Status - Mentions if a point (backward or forward) is used as fix in calculation.CalculationIf there is more than one levelling, the user has to select which levelling that shall becalculated. Before the calculating alternatives a control of the threshold value list willbe made (if there is one).Calculation alternatives117
<strong>Topocad</strong>Adjustment can be made with or without weighting and where the software systemshall look for known points can be decided. The priority order is coordinate tab andthen PP file (also database).Known pointsKnown points that was found. The user can select which points that shall be used incalculation.Calculation resultUnder Survey data/Save adjustment result the user get a possibility to save the resultto an existing file. Existing points can be updated in height and also new points canbe saved.Possibility to export the result you will find under File/Export/File...Tip!When importing twice weighed data the user can select if only the first reading shallbe imported, if a mean value calculation shall be made or if a new train shall becreated containing the measured data.GPS data/observationsA survey with a GPS station often stores a base station co-ordinate and delta coordinatesfrom the station to measure detailed points. It also stores various attributesthat provide more information about the measurement. All attributes are stored.When a calculation is carried out, a transformation is made from the current coordinatesystem to the final co-ordinate system.GPS co-ordinates118
SurveyA GPS survey can also save co-ordinates directly. The data saved is the point ID,latitude, longitude, height and point code.PreviewAllows you to preview the measurements. The preview can use data from variousobservations. The menu is accessed by right clicking. You can activate or deactivateit for different observations and use the F8 button for recalculations.119
<strong>Topocad</strong>Survey data - Settings, calculationFunction, commandStationFree stationEdit settingsNew stationCalculate survey dataProcess coordinatesCalculate GPS observationsProcess GPS coordinatesTraverseNet adjustmentDescriptionNet adjustment is a survey calculation but is aseparate module in <strong>Topocad</strong>StationThe station contains information about:• Point ID:The point ID is specified if it exists.• Instrument height:• Temperature:Temperature at survey by this station.• Pressure• Station type:Known stationFree station120
SurveyTraverseSets the calculation for the station and imports to the net adjustment form.• Calculate heights:Select whether or not you want to calculate heights.• Search co-ordinates for known points:The software system searches for known points in the co-ordinate list whencalculating the survey data. If the box is checked, the software will search for knownpoints in the co-ordinate list even if "process co-ordinates" has not been selected incalculation.• Project:The information is loaded from the field memory/station.• User:.• Date:• Code:• Station co-ordinates:Loaded from instrument or entered here.• Use oriented direction (no backsight)• Observation angle• Azimuth:Direction relative to north.Edit settingsIt is possible to edit the survey data form. Select Edit settings in the Survey column orright click and select Column settings. See also General grid editing. Selecting atype of observation allows you to add it or remove it from your list. You can place theobservation wherever you want by using the up or down arrows. It is also possible toRemove all or Add all.The document format is always the same and this editing only affects how the surveydata will appear on screen and when printing.You can also save the standard design.OrientationDetermines whether or not <strong>Topocad</strong> will use the point for backsight. It is also possibleto select the option ”If possible” and <strong>Topocad</strong> then checks if it findsthe point number as a backsight.Survey typeThe survey types you can select if the values are Backsight, Point, Other, Backsight ifpossible, Round mean value or Station mean value.Point IDThis is the identification for the point and can consist of up to 24 alphanumericcharacters. When points are manually entered in <strong>Topocad</strong> they are automatically121
<strong>Topocad</strong>numbered. If you start with number 1 the next point will have the point ID 2. If youenter 1,001 the next number will be 1,002RemarkRemark field.External point identityThis has no function in the message.Object typeDescription of classification of object.TimeTime in local time. Time is given as hours 00-23, minutes 00-59 and seconds 00-59(hhmmss), and if necessary with fractions of a second (hhmmss.ddd).Error distance in planeError distance entered or calculated - used to describe the accuracy of the points inthe plane. The value is the radial point error distance.Error distance in heightError height distance entered or calculated - used to describe the accuracy of thepoints in the plane. The value is the radial point error distance.Measurement typeDescribes type of point. e.g. station, point, net. It is used in the free station when youknow at the beginning which points to use for the calculation. If you use the backsightor polygon point code type, the setting will be changed automatically.DimensionsDescribes how many dimensions will be calculated at the specific point. Thealternatives are: no dimension, one dimension, two dimensions and threedimensions. The setting is also used prior to the calculation in the free station whendescribing the points that will be used for the plane and height respectively.ControlIf the point is used as a control point, select Yes here. The default value is No.Part of measurementThis is used when several measurements of the same object are required to defineits co-ordinates.Resection orderThese are used in resections and describe which of two alternatives will be used ifthe point is not defined in any other way.Space vectorThis is used for the measurement of two prisms or if you want to measure a distancebetween a point and a prism. The value given here is the distance from the closestprism.122
SurveyAccuracySpecified accuracy for measurement data.Eccentric cross angleHorizontal cross angle at the centre point.Eccentric vertical angleVertical cross angle at the centre point.Eccentric distanceSlope distance to the centre point.Calculate survey dataSurvey (sur)|Survey|CalculateThis is used to calculate the survey when you have one or more stations with surveydata.To calculate co-ordinates:1. Open the survey document with the data you want to use to calculate coordinates.2. Select Survey|Calculate from the menu.123
<strong>Topocad</strong>3. The dialogue box that opens indicates how many stations there are in thesurvey. All of them are selected. If you want to exclude one or more of thestations from the calculation, select the ones that should be calculated. UseCtrl to select one at a time or Shift to select several stations at once.4. If you want to study the station calculations click in the box in bottom leftcorner.5. Select the drawing in which you want the survey to be placed. You can selectan open drawing, a previously saved drawing or a new drawing. If you select anew drawing it will be the default drawing that is selected (if there is one).6. Station establishment: Alternative for skipping station establishment for freestations. Checked box means the window for station establishment only will beviewed for free stations.7. Click Continue.8. The stations, including free stations, will appear one by one. See Free stationfor more information about free station calculation.9. If you clicked in the View box the calculation window will appear on the screen.Click Continue when you have finished, or Cancel if there are any errors.10. The co-ordinates will be placed in the drawing.TIP! The calculation requires known points. These can be stored in the known points file (see Settings), on the coordinatestab in the survey document or as station co-ordinates on the Survey tab (this is where you are now).Process co-ordinates124Survey (sur)|Survey|Process co-ordinatesTo calculate co-ordinates from the field you have two options. You can use this document (the sur file)or the drawing. If you use the survey document you have the chance to edit the co-ordinates beforethey are entered into the drawing.
Survey1. Import the co-ordinates from your instrument.2. Go to Survey|Process co-ordinates.3. Decide which drawing to place them in.4. Click OK.Calculate GPS observationsSurvey (sur)|Survey|Calculate GPS observationsGPS observations are usually made from a base station and delta co-ordinates from this base station.In <strong>Topocad</strong> you can calculate and transform the co-ordinates from the current co-ordinate system(normally WGS84) to the existing co-ordinate system. This transformation can be made throughseveral different projections and co-ordinate systems to get to the right one.An integrated third party application called Gtrans is used. <strong>Topocad</strong> is compatible with many differentco-ordinate systems. If your co-ordinate system is not listed, please contact your dealer for assistance.Go to Survey|Calculate GPS ObservationsProcess GPS co-ordinatesSurvey (sur)|Survey|Process co-ordinatesIf GPS data is stored in co-ordinates they can also be transformed using Gtrans as above.Go to Survey|Process GPS coordinates.Free stationFree station uses the Least Squares method for calculation. To force the calculationto use only known stations for plane or height data you can use the "Dimensions"column.New stationYou can create your own survey data and/or a new station with an existing surveydata document.The procedure is as follows:1. From the menu, select Survey|New station.2. Enter your survey data into the new station. If any other stations already existin the survey data document the new station will appear last in the list.125
<strong>Topocad</strong>TraverseSurvey|TraverseCommand, functionCreate traverseTraverse documentTraverse settingsInformation about stationsin traverseCalculate traverseTraverse statisticsResult of traversecalculationDescriptionHow to create a traverse, either from a sur file ormanually.Explanations about the document.How to calculateThe traverse can either be entered manually or you can load data from the surveydata file (.sur). To use the survey data file, select the traverse in the station headerand then to Survey|Construct traverse. You will then have a suggested station order.In the document all rounds of measurement data will automatically be calculated andit is possible to calculate the traverse.The traverse can be calculated in the following ways:• Not connected• Inverted not connected (known points at the other end of the traverse)• Co-ordinate connected• Inverted co-ordinate connected• End point connected• CompleteNote: As well as the actual traverse calculation in the traverse document, this also relates to rounds ofmeasurement.Create traverseCreate traverse from survey data:Survey|TraverseThe traverse can either be entered manually or you can load data from the surveydata file (.sur).To construct traverse from survey data file:1. From the survey data document (.sur) go to Survey|Construct traverse.126
Survey1. The traverse document is opened in the background. A dialogue box appearswhich suggests a station order. This dialogue box has three columns. The firstcolumn lists the first station, used as the backsight, where the traverse begins. Thesecond column lists all stations in the traverse in an order suggested by <strong>Topocad</strong>.You can remove stations from this field. The third column suggests the last station,used as the forward sight. There may be two stations in this column. If so you willneed to click on the one to be used as the forward sight.1. <strong>Topocad</strong> may not select the correct traverse order. In this case remove incorrectlyplaced stations by selecting them and clicking Remove. These stations will thenappear in the third column. Add stations in the correct order by selecting theappropriate station from the third column and clicking Add. If you want to add stationsthat were not measured in the survey data document, this can be done afterwards.See further down - <strong>Manual</strong> entry.1. You have now a traverse. It is possible to scroll between stations using the arrows.For more information about the document see Traverse documentConstruct traverse by manual entry:Go to File|New and select Traverse (.trv)TraverseThe traverse document appears on the screen. Go to Traverse|Add station to enterthe stations in the traverse. In the dialogue box you can add a backsight, station andforward sight. Next time you want to add a station, the backsight (back point ID) andthe station point ID are already defined. You can only enter the next forward sight.(This will be the next station if you continue the traverse). Note that it is possible toselect three types of observation data: - Vertical angle with slope distance, Verticaland horizontal distance and Horizontal distance only. See Traverse settings for moreinformation.It is possible to enter any number of observations and stations in the document.Traverse documentTraverseThe Traverse document has its own menu with a unique column for the documentnamed Traverse. The document itself shows the backsight, station and forward sightfor every station. They all show the point ID and prism height/station height. Theobservations are as follows:UseSelect Yes or No to indicate whether or not the observation should be used in thecalculation.127
<strong>Topocad</strong>No.Number of rounds of measurement for this station.Other observations are explained in the traverse settings.The following commands are in the menu:Previous stationTakes you to the previous station in the traverse. The same function can also beperformed using the left arrow in the document.Next stationTakes you to the next station in the traverse. The same function can also beperformed using the right arrow in the document.First stationTakes you straight to the first station in the traverse.Last stationTakes you straight to the last station in the traverse.New stationAdds a new station. A dialogue box appears. For the first entry you can add thebacksight, station and forward sight (next station). For subsequent entries you canonly add the forward sight (next station). It is not possible to break the traversewithout deleting all stations that are ahead of the required insertion point.RemoveRemoves an existing station from the traverse. It is only possible to remove stationsat end points.Edit station IDChange the name of a station in the traverse.SettingsFind out more about these in Traverse settings.Traverse informationFind out more about these in Traverse station information.Calculate traverseFind out more about these in Calculate traverse.Traverse settingsThe observations in the traverse can be entered with three types of data. The dataand observation types are as follows:128
SurveyVertical angle with slope distanceHorizontal angle back, Vertical angle back, Slope distance back, Horizontal angleforward, Vertical angle forward and Slope distance forward. 3DVertical and horizontal distanceHorizontal angle back, Vertical angle back, Horizontal distance back, Horizontalangle forward, Vertical angle forward, Horizontal distance forward. 3DHorizontal distance onlyHorizontal angle back, Horizontal distance back, Horizontal angle forward, Horizontaldistance forward. 2DThe first option, Vertical angle with slope distance, is the format that is always saved.Other values are calculated using this format. You can always enter data in any ofthe above three formats. The selected observation type has a significant influence onthe information and statistics displayed for the traverse.ToleranceEnter the tolerance for your traverse in metres. If the tolerance is exceeded duringthe calculation you will see an error message telling you that the tolerance has beenexceeded and that the calculation has stopped.Print formatSelect detailed or short list.ViewYou can choose to view the traverse after the calculation has been made.Information about stations in traverseYou will find this command in the menu. It gives you all possible information aboutthe current station. You will see a summary of all observations and partialobservations for the station. Different data will appear in the dialogue box dependingon which type of observation format has been selected.Dialogue box data:Group number:Used to select whether you want to see the station summary or only one roundahead.Group:Specifies the horizontal angle and the maximum and standard differences for theangle in the selected group/round.Back/ForwardShows whether the measurement has been taken towards the backsight or theforward sight.129
<strong>Topocad</strong>Vertical angle:The sum of the vertical angle and its maximum difference and standard deviation.Slope distance:The sum of the slope distance and its maximum difference and standard deviation.Horizontal distance:The sum of the calculated horizontal distance.Vertical distance:The sum of the calculated horizontal distance.Calculate traverseYou can calculate a traverse from the traverse document (.trv). When you are satisfied with the editingand entries, go to the menu and click Calculate traverse. A dialogue box appears. <strong>Topocad</strong> tries to findthe connection type. This can be changed if it is not correct.The following connection types exist:• Not connectedTraverse is not connected. It is connected to two points at the start of thetraverse and is not connected to any points at the end of the traverse.• Not connected inverseTraverse not connected. Starts with unknown points and ends at two knownpoints.• Co-ordinate connectedThe traverse is connected to two points at the start of the traverse and ends atone known point at the end of the traverse.• Co-ordinate connected inverseThe traverse has one known point at the start of the traverse and ends at twoknown points at the end of the traverse.• End point connectedThe first and last points in the traverse are known points. All other points areunknown.• Completely connected The traverse has two known points at both the start andend. This type of traverse is of course the most accurate and <strong>Topocad</strong> canalso calculate more deviations and corrections from it.Correction methods:• No correctionNo correction at all• LinearLinear correction from the first station.• LengthComplete correction130
SurveyOther data in the calculate traverse dialogue box is: known points, point ID and coordinates.The dialogue box shows:Top left corner: first backsightTop right corner: first pointBottom left corner: last pointBottom right corner: last forward sightA maximum of all four of them can be known and displayed (as for completelyconnected) and at least two must be known and displayed.Tick this box if you want to calculate a 3D traverse. Click OK when you want tocontinue with the calculation of the traverse.Result in traverseThe results that are displayed in the dialogue boxes can also be printed. As soon asthe calculation is done go to File|Print to send the complete report and results to theprinter. See Traverse settings for more information about detailed and short lists.The results display the adjusted station co-ordinates and the distance/heightdeviation from the points. You can select whether or not you want to add the stationpoint ID to the current polygon point file (.pp).Point ID:The point ID of the station. You can select from the list. You can also edit the point IDof the station by going to Traverse|Edit station ID.Distance diff.:Calculated the maximum difference at a measured distance between two points. Thedisplayed difference is a comparison between the average value of distancesmeasured from one direction and the maximum distance measured from the otherdirection.Height difference:Calculated maximum difference at a measured height between two points. (Backsightand forward sight). The displayed difference is a comparison between the averagevalue of distances measured from one direction and the maximum distancemeasured from the other direction.Previous/NextClick on these arrows to go to the previous or next station in the traverse. A greyedoutarrows means that you are at the end of the traverse.Traverse statistics131
<strong>Topocad</strong>This dialogue box shows information about how many points there were in thetraverse, the number of calculated new points (unknown), the number of measuredangles, the rounds of angles and distances as well as the verifiability of the traverseand which corrections have been calculated for the traverse.Number of points:Total number of points in the traverse.Number of unknown points:Total number of points that where not known from the beginning and which have nowbeen calculated.Number of measured directions:Total number of measured directions in the traverse from all points.Number of measured distances:Total number of measured distances between points in the traverse.Number of direction sets:Number of measured direction sets: This is the same as the number of stations thatthe direction measurements have been calculated from. Usually this is the number ofpoints minus two (backsight and forward sight).Verifiability:The verifiability of a traverse is calculated using the following formula:Number of measured directions + Number of measured distances - 2 x Number ofunknown points - Number of direction sets divided by Number of measured directions+ Number of measured distancesThe verifiability value should be as high as possible. For a traverse a value of 0.5would be a satisfactory result.Correction angle:In completely connected traverses you can calculate the angle difference and thisdifference can be distributed to the observations at the various points. Thisdistribution is an average distribution using the same angle difference at allobservations. The displayed difference is the adjusted angle created from everyangle.Co-ordinates:In completely connected, co-ordinate connected and end point connected traversesyou can calculate a co-ordinate difference. The displayed difference is the resultingco-ordinate calculation for every point.132
ConstructionConstructFunctionShortcut DescriptionkeysLine Ctrl + L Construct line commandPoint P Construct point(s)CircleCreate circlesArcCreate arcsClothoid, spiral K Creates clothoidsText T Command for adding text to a drawing.Insert symbol S Inserts a symbol from the symbol table.Fill area F Inserts a number of symbols within a limited area.Slope hatch H Creates slope hatches between two parallel lines.Dimension D DimensioningInsert rasterAdd a raster image to the drawing.Copy Ctrl + C Copies an object in the drawing.Offset O Creates a parallel lineFillet Ctrl + Q Connects two lines to one other with or without aradius between them.MirrorCopies selected objects reversed, around selectedbase line.Divide lineDivides the line into segments.Create symbolFunction for creating your own symbols.Create line typeFunction for creating your own line type.Define attributesCreate your own attributes for symbols.Convert symbolsto pointsConverts symbols to points - used for terrainmodelling.Group G Groups objectsDrawing sheet W Function for inserting drawing sheets.Drawing view V Function for creating views in the drawing sheet.Co-ordinates gridInserts the co-ordinates grid into the drawing.Profile formSectionsPolar stake outFunction for inserting a profile form into thedrawing.Three separate functions for creating and insertingsections into the drawing.Polar stake out133
<strong>Topocad</strong>Point differencesSubdivide areaComparison between points and the distancesbetween them.Divides an area into several polygons.134
ConstructionDraw polylineConstruct |polylineShortcut key Ctrl + LSelect Draw polyline. Enter the co-ordinates either inthe dialogue box or directly on screen. If you areusing the dialogue box click OK to continue to thenext point. When the polyline is finished click Done.Dialogue explanations:AddWhen you type in co-ordinates click Add after eachpoint. If you click OK twice for the same co-ordinatesyou will get two points at the same spot.FinishWhen the line is completed click Finish. This will terminate the command. You canalso press the F2 button.UndoUndoes the last pointArcArc which continues on the last element.3 Pt. ArcArc with three points.ReverseChanges direction of line.Get StyleCopies the style of any other object in the drawing. The style can be the layer name,colour or line type.ClosedIf you want the line to be closed, i.e. a polygon, check this box.Construction lineA construction line is not visible in the drawing.SplineA spline will create splines of the line (with a rounded shape)135
<strong>Topocad</strong>FilledIf you want this line to be filled with the same colour as the line itself, click in this box.To draw a polyline with a baseline:1. Select the baseline2. Select the co-ordinates toolbox in View|Tool box|Co-ordinates.3. Select Draw polyline.4. Enter the co-ordinates directly into the toolbox rather than clicking on every coordinate.You can opt to enter true co-ordinates directly into the Draw polylinebox. Enter the co-ordinates for the baseline function by entering them in theco-ordinates box. Enter delta co-ordinates from the last point in the baselineand the distance and bearing from the last point, by selecting the relevant setin the co-ordinates box. After each point press Enter while you are still in thebox. You can then select another type of input data for the next point.5. When the polyline is completed, click Done in the Polyline dialogue box.The point number will increase one step at a time. If you enter 100 for the first point inthe polyline, the next point ID will be 101. If you enter 100.01 the next number will be100.02.Create lines in drawing from several elements in calculated section136
ConstructionThe command is available when you work with a calculated section and activates inthe menu under Construct|Create multiple lines in drawing.The command works as Create polyline in drawing in the same menu, the differenceis that multiple lines can be created at the same time. You must decide which layer touse for each created line. If no layer name is selected, the line will not be created.Select line by clicking "Prev. line" and "Next line". "Apply all lines" applies all lines inselected layer.Create line with radiusFrom Construct|Create line in drawing and Construct|Create multiple lines in drawingyou are able to set a tolerance. The tolerance decides how much the created linescan differ from a perfect line. A perfect line is in this case a line which is calculatedwith an infinite small interval. For example, if the tolerance is set to 0.02, no part ofthe created line can be created longer than 2 centimeter from the perfect line. Thetolerance only refers to deviations in plane. The heights for the point in the createdline are interpolated between the calculated sections. The tolerance is not used whenlines are created from the terrace.137
<strong>Topocad</strong>Draw pointConstruct pointSelect the Draw Point command. Enter the co-ordinates in the dialogue box or clickon the screen with the mouse.It is also possible to enter the point codes for points. You can either enter themmanually or select an existing code from the drop-down list.If you want to enter points with a baseline (A and B distances) you can create thebaseline under Settings|Baseline and then select View|Toolbox|Co-ordinates to enterthe local co-ordinates in the toolbox. For more information, refer to the section onDraw lineThe point number will increase by one step at a time. If you enter 100 for the firstpoint, the next Point ID will be 101. If you enter 100.01 the next number will be100.02.138
ConstructionDraw CircleConstruct circleA constructed circle is made up of a centre point and a radius. There are severalways to input this data:• Centre Point + Radius. The circle is created from the centre point with thegiven radius.• 2 points (the diameter). The circle is created between the two points.• 3 points. The circle is created from three points. The centre point and theradius are calculated.• Tangent-tangent-radius. The circle is created from two tangents and a givenradius. The centre point is calculated.To draw a circle with the help of a centre point and a radius:1. Select Construct|Circle.2. You can now either enter the co-ordinates for the centre point or click in thedrawing with the mouse. Snap commands can be used. The co-ordinatestoolbox can be used.3. Enter the radius. You can either enter the value manually in meters or use themouse.4. If you entered the values manually you will need to click Done when you havefinished. If you use the mouse the command will finish as soon as you haveentered both the co-ordinates and the radius.To draw a circle using two points:1. Select Construct|Circle.139
<strong>Topocad</strong>2. Click 2 pt.3. Click on one end of the diameter. Snap commands can be used. The coordinatestoolbox can be used.4. Click on the other side of the diameter. Snap commands can be used. The coordinatestoolbox can be used.5. Done.To draw a circle with using three points:1. Select Construct|Circle.2. Click 3 pt.3. Click on two of the points of the circle. Snap commands can be used. The coordinatestoolbox can be used.4. Click on the third point. You will see the shape of the circle before you inputthe last point. Snap commands can be used. The co-ordinates toolbox can beused.5. Done.To draw a circle using tangent-tangent-radius1. Select Construct|Circle.2. Click the TTR button.3. Click on the first tangent - polyline, circle or arc - you want to use. Snapcommands can be used.4. Click on the second tangent - polyline, circle or arc - you want to use. Snapcommands can be used.5. Click on the radius or input it manually. If you entered it manually you will needto press Done. If you click on two points in the drawings the length of theradius is given.140
ConstructionDraw arcConstruct arcA constructed arc is made up of a centre point, a radius and a length for the arc.There are several ways to input data:• 3 points The arc is created from three points. The centre point and the radiusare calculated.• Endpoint-endpoint-radius The arc is created from the endpoints and a givenradius• Endpoint-centre point-endpoint The arc is created between the twoendpoints and a given centre point between them.• Tangent-tangent-radius The arc is created from two tangents and a givenradius. The centre point is calculated.• Bearing-Point Select one end of the line. The radius will run from this endwith no bearing difference to any other point of your choice.To draw an arc using three points:To draw an arc using endpoint-endpoint-radius:1. Select Construct|Arc.2. Point with your mouse or use the co-ordinates toolboxto input three points. Snap commands can be used.3. If you are entering the values manually, click Donewhen you have finished. If you used the mouse thecommand will finish as soon as you have entered boththe co-ordinates and the radius.1. Select Construct|Arc.2. Press the EER button.3. Click each end of the arc or enter the values manually. Snap commands canbe used. The co-ordinates toolbox can be used.4. Select the radius. You can either use your mouse or enter the radius manually.Snap commands can be used. The co-ordinates toolbox can be used.5. If you entered the values manually, click Done when you have finished. If youused the mouse the command will finish as soon as you have entered both theco-ordinates and the radius.6. Done.141
<strong>Topocad</strong>To draw an arc using endpoint-centre-endpoint:1. Select Construct|Arc.2. Press the ECE button.3. Click on the first point of the arc. Snap commands can be used. The coordinatestoolbox can be used.4. Click on the centre point. This gives the length of the radius. Snap commandscan be used.5. Click on the other endpoint. You will see that the arc shapes when you useyour mouse. You can either use the snap commands or input the co-ordinatesmanually by using the co-ordinates toolbox.6. Done.To draw an arc using tangent-tangent-radius:1. Select Construct|Arc.2. Press the TTR button.3. Click on the first tangent - polyline, circle or arc - you want to use. Snapcommands can be used.4. Click on the second tangent - polyline, circle or arc - you want to use. Snapcommands can be used.5. Click on the radius or enter the value manually. If you entered it manually youneed to press Done. If you click on two points in the drawing the length of theradius is given.142
ConstructionClothoid/spiralConstruct|ClothoidThe ability to interpret clothoids and spirals is a valuable tool when creating roadlineand railroad line geometry.There are different ways to interpret clothoids in <strong>Topocad</strong>. You can do it between astraight line and a radius or between two radii.Certain data has to be entered to interpret clothoids.Start, bearing:The start point for the clothoid is selected.Enter the end or start radius, or both, andthen enter either the length or parameters.Finally, select the end point for the startbearing.Start, end point:The start point for the clothoid is selected.Enter the end or start radius, or both, andthen enter either the length or parameters.Finally, select the end point for the startbearing.Continue:When an end point on a straight line or arc has been selected, the clothoid willcontinue from this point. If a straight line is used, the end radius also has to bespecified. If a radius is used, the end radius should be 0 but an alternative value canbe entered.Tangent:For this function you need only two elements for a straight line or radius. Because thedistance between them and the start and end radius is known the parameter becalculated.The clothoid cannot cover large gaps.Use the trim function when using the tangent-tangent option.143
<strong>Topocad</strong>Construct textConstruct|TextShortcut key Ctrl + TYou can enter text directly into the drawing. Itis also possible to select the height, rotationand width for the text.To enter text:1. Select the Enter text command. SelectConstruct|Text from the sub-menu (rightclick) or use the shortcut key (Ctrl + T).2. Enter the text in the dialogue box. Youcan also copy and paste the text fromanother word processor.3. Select the height, scale width, rotationand font style for the text. Enter thevalues manually or select from the dropdownlist. It is also possible to select theheight and rotation directly in thedrawing.4. Click on Height in the dialogue box.Select the height you want for the text.Next you will need to set the orientation. It is possible to select the orientationin the drawing by using snap commands or you can enter it manually. To exitthe orientation selection, click on another step, such as Insertion point in thedialogue box.5. Click on Insertion point in the dialogue box. Select the start point in thedrawing.TIP! The insertion point for the text is the first letter of the first row in the bottom left-hand corner.TIP! For this and the other commands you can close the dialogue box and use the context menu instead (rightclick).TIP! Repeat the command by pressing the spacebar or Enter key.144
ConstructionInsert raster imageConstruction|Insert raster imageThe command "Insert raster image" adds a raster image to the drawing. The imagecan be inserted directly into the drawing or as a reference with a link to the image.Settings that can be used are insertion coordinates in three dimensions; X, Y and Z,the direction of the image and the scale. If there is a Geo reference in the file or as anattached file, it will be read in the dialogue and applied.Save TFW, JGW, SDWCheck boxes to save the geo ref. data in TFW, JGW and SDW files. The geo ref.data is saved the same time as the drawing is saved and has the same file name,except the file extension. If the geo ref. data is saved for a certain raster image, theraster image will get the same position if it is inserted into another drawing.See alsoEdit raster.145
<strong>Topocad</strong>Insert symbolConstruct|Insert symbolShortcut key SIt is easy to insert a symbol from the symbol list whenever required.To insert a symbol:1. Select Insert symbol.2. Select the symbol from the drop-down list.3. Enter the values for Orientation and Scale if required. The scale is connectedto the scale of the selected drawing (Drawing|Scale). For example: if thedrawing scale has been set to 1:500, the scale here will automatically be set to0.5 because the default drawing scale is 1:1000.4. Select insertion point. Click with the mouse where you want it the symbol toappear. Snap commands can be used. When you have selected the insertionpoint you will be asked for the orientation. If you select the orientation here youwill also be asked for the scale. When you have selected the insertion pointyou can click Done to use the settings in the dialogue box.Sample: Insert the drawing frame:1. Select Construct|Insert symbol.146
Construction2. Select the drawing frame you want to use from the drop-down list. Symbolsare selected under Preferences &endash; System files.3. Select the start point from the dialogue box. Go to the drawing to see whetherthe frame will fit or whether it is too big.4. Select an appropriate scale. To re-scale the drawing frame A1S1000 to a1:500 scale select the scale 0.5 for both X and Y-axes. Note that the scale isconnected to the scale of the selected drawing (Drawing|Scale). For example:if the drawing scale has been set to 1:500, the scale here will automatically beset to 0.5 because the default drawing scale is 1:1000.5. If you have not yet done so, click the point at which you want to place thedrawing frame insertion point in the drawing. The insertion point for frames isin the lower left-hand corner.6. Select orientation. You can either type in the orientation or indicate it in thedrawing. When you are satisfied click Done in the dialogue box.Select symbol - Select symbol by clicking on the symbol.Delete symbol - Select Edit|Delete|Construct|Delete Point or the Delete button, todelete selected symbols.Modify - Select Construct|Modify and a dialogue will open to edit selected symbol.147
<strong>Topocad</strong>Fill area (with symbol)Construct|Fill areaFill area is a command that fills areas and polygons with any symbol. You can insertthe symbol within the polygon by choosing a polygon, symbol, direction and grid.Three different tabs are used for this function:SymbolSelect the symbol and the direction and scale for the symbol.GridInput the origin and direction for the grid, and the interval between symbols.AttributeIf the symbol has attributes they can be inserted.PolygonSelect the polygon to limit the fill area.148
ConstructionSlope hatchesConstruct|Slope hatchesSlope hatches is a tool for creating slope hatches between two lines. If you selectparallel, or almost parallel, lines you can create slope hatches between them.Length on short side of lineThe line can be a percentage of the total distance or a fixed value.IntervalEnter the interval between the lines.Select the upper and lower edges.149
<strong>Topocad</strong>Copy objectConstruct|CopyShortcut key Ctrl + CIt is possible to copy an object at the same time as rotating it.The procedure is as follows:Layer1. Select Copy.2. Click on Select (in the bottom right-hand corner of the dialogue box) and selectwhich objects you want to copy. (Note: the Select command is automaticallyactivated when the Copy command has been activated.) The Selectcommand can also be activated both before activating Copy and afterselecting the base and insertion points.3. Select the base point to copy. This point should be somewhere in the copiedobject.4. Select Next point. The selected objects will be copied.5. If you want to copy the object in dX, dY or dZ you do not need to select thebase point. Enter the value(s) and click OK.SamePlaces the copied objects in the same layer as the original.CurrentPlaces the copy in the current layer.MultipleCopies the object to multiple locations. This is only possible when you select Nextpoint directly in the drawing. If you enter values manually you can only copy theobject once.150
ConstructionOffsetConstruct|OffsetShortcut key OParallel polylines with a selected offset are constructed using the Offset command.To construct an offset:1. Select the command Construct|Offset.2. Select the offset you want to use. You can select it either by clicking in thedrawing or entering the value manually.3. Click on Polyline in the dialogue box and select the line from which you wantto make the offset.4. Click on the side where you want the new line to appear.TIP! It is possible to select a new polyline and a new side without closing the command!1 TIP! Make sure that you do not have the snap lock function activated when you select the side for the offset.2 TIP! Do not enter a negative value for the offset. You select the side by indicating the right side!151
<strong>Topocad</strong>FilletConstruct|FilletShortcut key Ctrl + QFillet is a command that connects two polylines to oneanother. It is also possible to use the radius in thiscommand. In this case the two lines will be connected(but not joined) with a radius. There are three ways todo this:• For two polylines which do not pass each other.These two polylines are extended until theymeet.• For two polylines which do pass each other. These polylines are shorteneduntil they meet.• For two polylines where one does not reach the other. One of the polylines isextended until it meets the other; the second one is shortened to the samepoint.To use the Fillet function without a radius:1. Select Construct|Fillet2. Select the two polylines that you want to join. If one or both polylines pass theother, click on the end of the line that you want to retain3. You can continue with the command or click Done.To use the Fillet function with a radius:1. Select Construct|Fillet2. Select the radius that you want to use between the two lines. You can eitherinput the radius manually or select it in the drawing.3. Select the two polylines that you want to join.152
ConstructionDivide lineConstruct|Divide lineThe Divide line command is used to divide a line into several segments and createspoints on the line or to divide the line (click on the Divide line button in the lower rightof the window) into smaller segments. You can choose between a specified numberof points along the line or a specified distance between the points.For more information about attributes:• System|Attributes• Define attribute• Create symbol153
<strong>Topocad</strong>MirrorConstruction|MirrorThe mirror command copies selected objects reversed, around selected base line.Select object, activate the command, and choose if the mirrored object shall be in thesame layer or in selected layer. Select Base point (Base Pt) and line to mirror around.You can also select to copy the object (standard) and how you want to mirror text.154
ConstructionCreate symbolConstruct|Create symbolSymbols can be created directly in the drawing whenever required. You can usepoints, polylines, texts, circles, arcs and attributes in your symbol. If you want to adda symbol to the constructed one, or if you want to change an existing symbol, youmust explode the symbol before you create the new one.Draw the symbol you want to use with thecommands Draw polyline, Draw point, Drawcircle, Draw arc and Draw text. You can drawthe symbol at any position in the drawing.Under Construct|Define attributes enter theattributes that you want to assign to thesymbol.To create a symbol:1. Select Construct|Create symbol.2. Enter the new symbol name. (If youwant to change the symbol name enterthe new name here).3. Click on Select (in the bottom righthandcorner of the dialogue box).Choose the objects you want to includein the symbol. If you have entered anyattributes for the symbol it is best toselect them in the order you want themto appear in the Edit attributes dialogue box.4. Select the base point. This is the point at which the symbol will placed relativeto the co-ordinates. Snap commands can be used.5. If you have entered an existing symbol name you will be asked if you want toreplace the old symbol.NameSelect an existing name if you want to change a symbol or enter a new symbol name.Delete EntitiesIf you want to delete the objects used to create your symbol, tick this box.Change an existing symbolIf you want to change an existing symbol or make a new symbol out of an existing155
<strong>Topocad</strong>one, this is possible but you have to Explode (Modify|Explode) the previous symbolbefore creating a new one.TIP! The created symbol can only be used in this drawing. If you want the symbol to be available for use in otherdrawings, go to the Symbol manager (Drawing|Symbol) and add the symbol to the global symbol file.Symbol for different scalesThe appearance of a symbol can be defined by the current drawing scale. When creating a symbolthat already exists you get a question if the symbol shall be redefined or if the symbol shall be addedto dependent symbol. If the symbol shall be added to dependent symbol, a dialogue with the symbol isdisplayed and also which drawing scale the symbol shall be displayed in.Add drawing scale dependent symbolChoose between these drawing scales (all drawing scales are locked by the software.)• All: The symbol is displayed in all scales• 1:100: The symbol is displayed in all scales that are bigger and the same as 1:100.• 1:1000: The symbol is displayed in all scales that are bigger and the same as 1:1000.• 1:10000: The symbol is displayed in all scales that are bigger and the same as 1:10000.• < 1:10000: The symbol is displayed in all scales that are smaller than 1:10000.Note! Symbols in the drawing depends on the scale in the view.For more information about attributes and symbols:Drawing|SymbolsCreated symbols are stored in the local drawing. You can add them to the globaltable here.156
ConstructionSystem|SymbolAll symbols in the global table are displayed here. You can delete symbols from thisdialogue box.System|AttributesCreate the attribute itself and all the associated data.Define attributeDefines the attributes for the symbol when creating a symbol.Create symbolHow to create symbols and associate attributes with them.Attributes at point codesHow to connect attributes to point codes.Edit attributeHow to edit an attribute in the drawing whether it is connected to a point code, asymbol or both.Settings|System filesThe global file for symbols is selected in the settings and system files. The systemfiles for symbols have the extension .tsy and the system file for attributes theextension .tat157
<strong>Topocad</strong>Create line typeConstruct|Create line typeCreating a line type is similar to creating a symbol except that you also have to definea direction. The line type may consist of lines with no radius.The line type is stored in the local drawing unless you copy it to the global line typefile (TLT - see settings - system files) in the Drawing|Line type command.NameEnter a name for the line type.Start pointEnter a start point for the line type. If you want to start with a space you will need toenter a start point before the line itself.DirectionSelect (by clicking) the direction for the line. This will also be the end point. The linewill start from that point.Select objectSelect the objects that you want to include in the line. Only select lines without aradius.ScaleSelect a scale if different from the current drawing.See also:Drawing|Line typesThe line types used locally and line types available in the global system file are listedhere. You can copy them from either side.158
ConstructionSettings|System filesThe line type files are selected under Settings - System files.159
<strong>Topocad</strong>Attribute definitionConstruct|Attribute definitionAttributes are additional values for points. They can be diameters, ownership, dates,etc. To define an attribute it first has to be created. You create attributes underSystem|Attributes.Define attributes is the function used to place attributes next to a symbol. You canplace several attributes next to a symbol. You select the height, orientation and widthof the font and then the font itself.To create an attribute:1601. Select Construct|Define attribute.2. Select the attribute to be placed next to the symbol. It is possible to haveseveral attributes but they can only be defined one at a time.3. Select the height, orientation, width, font and justification for the attribute.Snap commands can be used to place attributes. Values can also be enteredmanually.4. To place the attribute, select the base point and then click on the base pointfor the attribute. The point that will be used as the base point of the attribute isthe first character in the lower left-hand corner. Notice that attributes mayhave a prefix or suffix.5. The attribute will now be drawn in the drawing: [ATTRIBUTE]. If it is not asymbol it will look like this. When it is imploded into the symbol it will use thevalue for the attribute instead.For more information about attributes:System|AttributesCreate the attribute and all associated data.
ConstructionDefine attributeDefines the attribute associated with the symbol when creating the symbol.Create symbolHow to create symbols and associate attributes with them.Attributes at point codesHow to associate attributes with point codes.Edit attributeHow to edit an attribute in the drawing whether it is connected to a point code, asymbol or both.161
<strong>Topocad</strong>Convert symbols to pointsConstruct|Convert symbolsThis command converts symbols to points. It is necessary if you want to use symbolsas input data for a DTM or if you want to set out the symbols.Some information can be converted from attribute data to Z-values, point codesand/or heights. For more information on attributes see System|Attributes.162
ConstructionConvert point attributes to object attributesConstruct|Convert point attribute to object attributeFunction for conversion of point attributes to object attributes and object attributes to point attributes.Object attribute is used in GIS applications and can be converted from point attributes in <strong>Topocad</strong>.Point attributes can be connected to all points in one object but object attribute is just one per object.The conversion works with points and lines. Only attributes from point no 1 in the line are concernedwhen converting point attributes on lines.Convert - Select between convert point attributes to object attributes or vice versa.All attributes - All attributes on the point are concerned.Selected attributes - All selected attributes on the point are concerned.Remove point attributes after conversion - Cleans concerned attributes from the point attributes.See also Settings|Survey for more information about how to measure and connect to object attributes.163
<strong>Topocad</strong>Sheet/Drawing sheetConstruct|SheetWhen creating a drawing you start by creating one or more drawing sheets. Eachdrawing sheet can have one or more drawing views for viewing the object.The drawing sheets can be blank, but it is better to create the actual drawing sheetswith the frame, stamp, legend etc. The drawing sheets are selected usingSettings|Drawing. They can also be copied from previous drawing sheets.When you create a drawing sheet with one or more drawing views, these should benoted in the model. You can select the scale, direction and start point.When creating your own templates for the drawing sheet you must create them usingabsolute values, scale 01:01. For example: an A1 drawing will be 841 x 594 mmSee alsoDrawing view.164
ConstructionView/Drawing viewWhen creating a view in a drawing sheet you should first select its size in thedrawing. The default scale is 1:1000 but this can be changed easily.Construct|ViewA view is automatically inserted into the lower left-hand corner in the model view. Ifthere are any objects outside your drawing area, the new view may be a long wayaway. Check this.If the drawing view is inserted into the drawing sheet at the beginning you will havethe option to insert the drawing view into the model view.See alsoDrawing sheet.165
<strong>Topocad</strong>Co-ordinates gridConstruct|Co-ordinates gridThe co-ordinates grid is created in the drawing or drawing sheet. The co-ordinatesgrid can be placed in the same layer as the drawing frame and drawing stamp.The co-ordinates grid can be inserted in a drawing sheet. You will then need to selectwhich drawing view to work in. The co-ordinates grid will adopt the scale and create aco-ordinates grid of the right size.To create a co-ordinates grid:1661. Select or create the layer for the co-ordinates grid.2. Select Construct|Coordinate grid.3. Select which type of co-ordinates grid you want to use. You can select fromthree different types - cross, net and frame.4. Select size for the cross (this is not necessary when selecting net). Note thatthese distances are in metres. ). The command identifies the set drawing scaleand will suggest sizes relative to the drawing scale. If you want the size of thecross to be 8 mm on the drawing you will need to select the following heightsfor the different scales:
Construction5. Drawing scale: Cross in mm on the plot. Size in metres:• 1:100 8 0.8• 1:400 8 3.2• 1:500 8 4.0• 1:1000 8 8.0• 1:2000 8 16.0• 1:10000 8 80.01. Select the base point. The base point is the point from which the numbering ofthe grid is to be calculated. The default value is X=0, Y=0.2. Select the distance you want to have between the cross, net or marks in theframe. ). The command identifies the set drawing scale and will suggest sizesrelative to the drawing scale.3. Select the font you want to use.4. Select the height of the text. Note that the height is in metres.5. Select where you want the text to be printed and also any prefixes or suffixesrequired.6. Click on the window and select which area you want to create the co-ordinatesgrid to appear in.7. Click OK. The grid will be plotted in the drawing.See alsoInsert drawing sheetInsert drawing view167
<strong>Topocad</strong>Draw profile formConstruct|Draw profile formThe profile form cannot be printed from its original file type (.tpf). It must be insertedinto a drawing. This will also make it easier to define the scale, size of plot, etc.The procedure is as follows:1. Start a new drawing.2. Go to Construct|Profile form.3. Select the profile form you want to print.4. Select an insertion point for the profile form. Select the length and scale of theform. If the profile form is too long to print out it can be split into two or moreforms and each will still have the correct toolbox.5. DoneYou can divide a profile form into several sheets or drawings. For example: if you enter 0 as the startsection, and a length of 300, and then a start section of 300 and length of 300, the headers will berepeated and the profile form will be displayed correctly.Tip! You can use the Co-ordinates toolbox to insert the profile form at the origin. Thismakes it is easier to create the length and height in the profile form.Tip! If you start with a drawing sheet with a drawing view inserted and zoom in on this, it iseasier to insert the profile form and check that it has the correct size and scale.See alsoProfile form168
ConstructionCreate section drawingConstruct|Section drawingCommandEnter calculated sectionsSections from selectedlinesSections from selectedlines as measuredMeasured profileDrawing size and scalePrint on drawing methodsDescriptionLongitudinal section entry.How to get the size and scale right.General settings for inserting into thedrawingThere are four ways to create and insert section drawings:• Inserting created cross sections• Creating sections from lines in the drawing• Using measured sections• Using measured profilesInserting calculated sectionsFor insertion of created sections (TCS files)169
<strong>Topocad</strong>In this dialogue box, you select the section files you want to place in the drawing. You canuse one or more created sections at the same time, but they will use the same section. Ifthey are created along the same road line this is fine but if not they will show two differentsections for the same section in the drawing. Use the up and down arrows to select theorder. If you intend to insert two or more cross section files at the same time, they will needto have the same created section and section interval.See the image above for details of how to enter information in the drawing.Section from lines in drawing170
ConstructionThe procedure is as follows:1. Enter the roadline or select it in the drawing.2. Select the sections crossing this road line, click Next. Refer to DRAWING.Calculate and set out the measured sectionsThe procedure is as follows:1. Use the selected lines as measured option (see screenshot)2. Enter the roadline or select it in the drawing.3. Select the sections crossing this road line, click Next. Refer to DRAWING.Calculate and show measured profile171
<strong>Topocad</strong>The procedure is as follows:1721. Use the measured profile option (see screenshot)2. Select the measured profile.3. Select the insertion method. Refer to DRAWING.Drawing scale and sizeUse a drawing sheet Drawing sheet templates are set under File|Settings|Folders.and views:1. Use a new blank drawing.2. Insert a drawing sheet with the scale and size you want in the drawing (if thereare no drawing views, continue from 3-4)3. Place a new drawing view in this drawing sheet.4. Select the scale for it.5. If you know that you will need more drawings, repeat these steps and placethe drawing views next to one another.6. Continue with the next step.Insert in the drawing
ConstructionThere are two main methods, which mainly differ in terms of the layout. We call themthe bucket and the form.Method:ThebucketMethodMethod:The formDescriptionMethod Select method and type of viewselection selectionLayout Layout It is possible to select the section size and the marginbetween them.Text Text Text information, size etcLayers Layers Select layers and informationSections,intervalFormsSections,intervalMethod selectionSelect which objects are to be displayedWhat sections, number, start section, intervals, sectionsper column etc.Select the method you want to use to insert your sections:Bucket method (left) Form method (right )173
<strong>Topocad</strong>LayoutEnter the values for different distances for the section. You will find the maximumvalue of any of the sections made/created in grey to the right.Left (A)Left-hand side of cross section from the centre point.Right (B)Right-hand side of cross section from the centre point.Height (C)The maximum height for any section.Margin (M)The margin between the cross sections in the drawing.Distance between markersThe distance between the markers for the vertical and horizontal side.174
ConstructionTextSelect the text height and font. It will sometimes be difficult to identify the correct size.Try clicking once in the drawing to obtain an idea of the size. If you have selected"Display areas" and "Bottom" as shown, you will see in the drawing how high thebottom line is. This is shown by the red dot in the screenshot below.Display Z: The coordinate refers to the middle point on the theoretical layer in the firstdocument that has been indicated in the command. The placement of X and Y shallbe between 0 and 1.0.0 corresponds to the upper left margin and 1.0 corresponds to the lower rightmargin.175
<strong>Topocad</strong>ScaleThe scale is used for different scales in the sections.PlacementWhere the area text is to be placed.FieldThis window is only used if you are using areas. All areas used in the cross sectionswill be available, including those fields you created yourself.SectionsSelect how many and which sections you want for each drawing. You can see theirsize by clicking once in the drawing. You need to fit them into the drawing view youhave placed in the drawing.SectionsTotal number of sections for each drawing176
ConstructionRowsHow many rows you want to use in your drawing.ColumnsFor your information only, shows how many columns there will be depending on thetotal number and how many rows you are using.Terrain limitThe terrain limit specifies how far outside the maximum theoretical section thesections will be on each side.When you have done all this, place your sections in the drawing. You can place thenext set of cross sections in the next drawing view immediately. If you are running outof drawing views, place the sections in the blank drawing and create drawing sheetsafterwards.Form methodThis method uses more information for each section.177
<strong>Topocad</strong>LayoutSelect the distances and enter them in the dialogue box.Box heightThe height for each box and form below the section.LinesLine type for the form. If you want the text to be placed on the line, select this option.DatePosition for the first form/box according to the sections. The options are automatic,distance or actual height, where distance represents the distance between the boxand the form.TextSelect the text height and font and whether you want the areas to be displayed.Field178
ConstructionThis window is only used if you are using areas. All areas used in the cross sectionswill be available, including those fields you created yourself.Selecting layersSelect the layers (forms) that you want to use for each cross section. The name canbe edited when they are on the left-hand side. You can add boxes that will be empty.The information to be added here is the height of each break point in the selectedlayer.179
<strong>Topocad</strong>SectionsSelect how many and which sections you want for each drawing. You can see theirsize by clicking once in the drawing. You need to fit them into the drawing view youhave placed in the drawing.SectionsTotal number of sections for each drawingRowsHow many rows you want to use in your drawing.ColumnsFor your information only, shows how many columns there will be depending on thetotal number and how many rows you are using.Terrain limitThe terrain limit specifies how far outside the maximum theoretical section thesections will be on each side.When you have done all this, place your sections in the drawing. You can place thenext set of cross sections in the next drawing view immediately. If you are running outof drawing views, place the sections in the blank drawing and create drawing sheetsafterwards.Cross section example:180
Construction181
<strong>Topocad</strong>Polar stake out (set out)Construct|Polar stake outThe stake out creates a printout of horizontal distances and angles from selectedstations and backsights.The printout is added to a stake out log.182
ConstructionDimensionConstruct/DimensionThe Dimension command is a flexible and intelligent command that allows differentkinds of dimensioning.The different types of dimensioning:LinearLinear dimensioning is always vertical or horizontal.OffsetOffset dimensioning is parallel to the measured object.DiameterMeasures the diameter of circles and arcs.RadiusMeasures the radius of circles and arcs.PointerInserts a line for an explanatory text.AngleInserts the angle between two lines.183
<strong>Topocad</strong>Base lineInserts the distances after each line.SettingsLines and arrowsDimension linesSelect the colour, layer and line type for the dimension lines.Extension linesSelect the length for the extension lines. This is used when the text is beyond thearrows and there is no space in between.ArrowsSelect different types and sizes of arrows.TextSelect the font, colour and heightText placementSelect the distance of the text from the line.Linear distances and angle dimensionEnter the accuracy, prefix and suffix.184
ConstructionGroupConstruct|GroupShortcut key GObjects can be grouped together. These objects do not have to be in the same layeror have other similar properties. If an object is grouped the complete group will beselected when the any one of the objects is selected.This function is used when you want several objects to be treated in the same way,for example if you want to rotate multiple objects.185
<strong>Topocad</strong>Point differencesConstruct|Point differencesA command that compares two points with one other.You can select two points settings - theoretical and measured - and check thedifference between them using either the global co-ordinates system or any otherUCS you may have.You can create a report if required.You can choose to compare points to the nearest point (within a limit) or to the pointID.ToleranceIf the distance between the points is greater than the tolerance, a circle will bedisplayed.SelectionSelections are made by using the layer filter.Distance186
ConstructionSelect mm, cm or m as the unit to be used to display the distance.TextSelect font and height.187
<strong>Topocad</strong>Subdivide areaConstruction|Subdivide areaSubdivide area is a function that divides a polygon into two or more polygons withequivalent areas. You can state whether you want the surface to be parallel to abaseline or to extend straight from any of the points in the polygon.The "Explode new polygons" command explodes all polygons to single lines.The "Create report" function works with the Crystal reports generator.188
ModifyModifyFunction Shortcut DescriptionkeysErase Del Deletes object in drawingMove Ctrl + M Moves selected objectsRotate Ctrl + R Rotates objects. Can also be used with the copyfunction.ScaleScales objectsTransformationTransforms an object using the Helmert or Affinsmethod.GtransformTransformation using the integrated third partysoftware Gtrans.Join Ctrl + J Joins lines and points to each other.Break Ctrl + B Breaks lines at the nodes.Explode Shift + X Explodes the object.Extend Shift + E Extends lines towards other lines.Trim Ctrl + X Trims the object, i.e. breaks lines at the point theyreach another line.LengthenLengthens objects by a distance or percentage.ChangeChange layer, line type and colour of existing objects.Changes the Shift + O Changes the drawing order for objects.orderChanges Ctrl + E Changes almost all properties of the selected objects.propertiesChange group Shift + G Changes the objects belonging to a group.Edit line Shift + L Edits the selected line.Edit attribute Shift + A Edits the attribute values.Edit text Shift + T Edits text contentsModify rasterModify legendModify raster, insertion point, scale and image file.Modify legend (only available in drawing sheet) Samecommand as Construct legend189
<strong>Topocad</strong>Delete objectModify|DeleteShortcut key DeleteThis function deletes objects from the drawing.You can either select the object and then go to Modify|Delete or right click and thenselect Delete. If you activate the Delete command first you have to select the objectsfor deletion and then select Done by right clicking or pressing F2.TIP! It is easier to select objects before activating the command. In this case you do not haveto finish the command with another command.190
ModifyMove objectModify|MoveShortcut key Ctrl + MThis moves the selected objects in the direction you select. You can move objects inthe drawing with the mouse or enter the values manually. In this case you can entereither the angle and distance or in dX, dY and dZ format. (dN, dE, dH)You can select objects before or after you have activated the command and evenadd more objects afterwards.The object to be moved can be placed in the same layer as the selected object or inthe current layer.To move an object:1. Select Modify |Move.2. Select objects to move.3. Select Base point. It is possible to snap on objects.4. Select Insertion point (next point). You can select with the mouse, entervalues for dX, dY, dZ or enter the angle and distance. If you click on theinsertion point the command is completed if you have selected objects. If youtype in the values you will need to click OK to finish.191
<strong>Topocad</strong>5. Note that points 2, 3 and 4 may be entered in any order. However it isimportant that a base point is selected before the next point is selected in thedrawing. The default value for the base point is the origin.6. To move objects with a rotation, fill in the Rotation parameter and the objectwill rotate, depending on the lap you have selected in File|System| Systemsettings, Angle, Angle Settings.TIP! You can move an object in height (Z) only. Just enter the Z change and clickOK.TIP! For this and the other modify commands you can close the dialogue box anduse the context menu instead.Note: It is important to select a base point. If no base point is selected <strong>Topocad</strong> will calculate the movement fromthe base point with co-ordinates 0,0 (origin).See alsoCopy object.192
ModifyRotate objectModify|RotateShortcut key Ctrl + RThis rotates the selected objects from the selected base point by whatever rotationangle you select. You can rotate objects in the drawing by using the mouse or byentering the values manually. In this case it is possible to enter the rotation and thereference point. It is also possible to select the rotation and the reference point withthe mouse.You can select objects before or after you have activated the command and evenadd more objects later.The object to be moved can be placed in the same layer as the selected object or inthe current layer.To rotate an object:1. Go to Modify |Rotate.2. Select the objects to rotate.3. Select the base point. It is possible to snap on objects.4. Select the orientation. It is possible to select with the mouse or manually enterthe value for the direction (in GON, degrees or mills). If you selected theinsertion point with the mouse the command is done if you have selectedobjects. If you entered the values manually you have to click OK to finish.5. Note that points 2, 3 and 4 may be entered in any of order. However it isimportant that a base point is selected. The default value for the base point isthe origin.Explanation of dialogue box193
<strong>Topocad</strong>Reference angle:This is used if you want to rotate an object relative to a selected reference angleinstead of the default reference angle (that is 0 North). Click on Ref. and then selectthe first and second points of the reference angle. The angle will be displayed in thedialogue box. To rotate an object relative to this angle you can either use your mouseto select the rotation or enter the angle in the orientation box. This method is thebest.CopyTick this box to copy the rotated objects.It is also possible to rotate some types of objects by going to View Info.Note: It is important to select a base point. If no base point is selected <strong>Topocad</strong> will calculate the rotation from abase point with co-ordinates X=0, Y=0.TIP! For this and the other commands you can close the dialogue box and use the context menu instead.194
ModifyScaleModify|ScaleThis scales the selected objects from the selected base point to whatever scale isrequired. You can scale objects in the drawing with the mouse or by entering thevalues manually. In this case it is possible to enter the scale factor and the referencepoint. It is also possible to select the scale factor and reference point with the mouse.You can select objects before or after you have activated the command and evenadd more objects later.The object to be scaled can be placed in the same layer as the selected object or inthe current layer.To scale an object:1. Select Modify |Scale.2. Select objects to scale.3. Select base point. It is possible to snap on objects.4. Select Next point. It is possible to select with the mouse or enter the valuesfor scale manually. If you click on the insertion point the command is finished ifyou have selected objects. If you enter the values manually you have to clickOK to finish.5. Note that points 2, 3 and 4 may be entered in any order. However, it isimportant that a base point is selected before the next point is selected in thedrawing. The default value for the base point is the origin.195
<strong>Topocad</strong>Reference:You can select a reference from which your new scale will be calculated. This is ofteneasier to use than the default scale.The modified object can be placed in the same or selected layer. You can also selectcopy object.Note: It is important to select a base point. If no base point is selected <strong>Topocad</strong> will calculate the scale from abase point with co-ordinates 0,0.TIP! For and the other modify commands you can close the dialogue box and use the context menu instead.196
ModifyTransformModify|TransformThe transform function changes, scales, moves and rotates the objects at the sametime. You can use either Helmert or Affin transformation and you can use anynumber of points (with a minimum of three) to calculate the transformationparameters. You can click on the points or enter them manually.The procedure is as follows:1. Check that you can select at least two points in both the to and from systems.You can either select them in the drawing with the mouse or enter the coordinatesmanually. You can also load previously stored parameters.2. Select the objects you want to transform.3. Select Transform.4. Select the type of transformation system - Helmert or Affin.5. Select the From tab and click on or enter co-ordinates for at least three points.The points do not have to be in the selected objects.6. Select the To tab and click on or enter co-ordinates for the same amount ofpoints. Note that they must be the added in the same order as in the From tab.7. Select the Parameters tab to see the result of the transformation calculation.You can also save the parameters to another transformation.8. Click Done. (If you have not selected any objects you can do so now beforeyou click Done). You can select or deselect more objects by holding down theCtrl key while making your selections.197
<strong>Topocad</strong>Load/SaveIt is possible to save and reload the transformation parameters.198
ModifyJoinModify|JoinShortcut key Ctrl + JJoin polyline is used to link two polylines or points together. You can also join allselected objects by choosing the point code and connection method.The join command usually join two objects (lines or points) where the two objectshave the shortest distance between another. This irrespective of where you do themark. Avoid this by marking "Join node point" where you are able to select on whichnode you want to join to. Join node point join to the exact point and inherit its height.The procedure is as follows:1. Select Modify |Join.199
<strong>Topocad</strong>2. Select the two objects that you want to link together. It does not matterwhereabouts on the objects you click because they will always be linkedtogether at their closest end points.3. You can now select more objects to link to this object.4. When you have finished press F2 or Enter or right click and then and clickDone.TIP! You can repeat this command by pressing the spacebar or Enter.There is also a function for selecting with Selection; here you can choose how theselections shall function.You can select a Max distance for how far a join shall be. Check point code makesthe same point code for the both points involved in the selection can be joined, notothers.200
ModifyBreakModify|BreakShortcut key Ctrl + BThe Break command is used to split a polyline.The procedure is as follows:1. Select the Modify |Break command.2. Click on the first point at which you wish to break the polyline. If you do notwish to break the polyline again press Enter or click Done in the context menu.(You can also click again at the same point.) If you want to break the polylineat another point, click on the point.See alsoTrim commandExplodeFillet.TIP! It is possible to repeat a command by pressing the spacebar or enter key!201
<strong>Topocad</strong>ExplodeModify|ExplodeShortcut key Shift + XExplode is used to split symbols into their components and polylines into lines. If youwant to change a symbol, or create a new symbol from an existing one you will needto use Explode. It can be used to separate point info from the point so that the pointinformation can be moved individually. It can also be used to split a symbol linked toa point by a point code so that the symbol becomes separate from the point.It is also possible to explode a road line to its origin, i.e. lines, radius and spirals.The procedure is as follows:1. Go to Modify|Explode.2. Select the object you want to explode.3. Decide how you want to explode the object:4. Explode object - Explodes a polyline into lines or a symbol into itscomponents.5. Explode point info - Separates the point info from the object.6. Explode automatically - Separates the symbol from the point code (point).7. Click OK when you have finished.TIP! It is possible to repeat the command by pressing the spacebar or Enter key!202
ModifyExtendModify|ExtendShortcut key Shift + EExtend is a command that extends a polyline to otherpolylines, circles or arcs.The procedure is as follows:1. Go to Modify |Extend.2. Select the point on the polyline, circle or arc that youwant to extend to. It is possible to select severalpolylines, circles or arcs.3. Click on Polyline in the dialogue box. Select thepolyline you want to extend. If there are severalobjects one after the other in the direction you wantto extend the polyline you can extend to all of them by clicking on the polylineagain. You can also select objects by clicking Select with right click, and thenselect either crossing line or crossing polyline.4. You can immediately select another polyline to extend if required.5. To end the command click Done or press F2 or Enter.It is possible to extend in several steps. If there are several lines to extend on theextension of the line, you shall extend them in the order they are placed towards theline. You extend the end that is as far-off from the marking point, if it is possible toextend a line to both directions.It is possible to extend lines to interpolated lines by clicking on the relevant button.The extend command has the alternatives ”Keep Z, ”Extrapolate Z”, and ”Interpolate other Z”.Keep Z means the Z coordinate is not effected.Extrapolate Z means the Z coordinates is calculated at the intersection by extrapolate the extendedobject.Interpolate other Z means the Z coordinate interpolates from the intersection line.203
<strong>Topocad</strong>TrimModify|TrimShortcut key Ctrl + XThis command cuts polylines, circles or arcs when theyreach another object. You can trim the objects at eitherends or in the middle.To trim a polyline, circle or arc:1. Go to Modify|Trim.2. Select the polylines or other objects you want totrim to. You must select at least one polyline, circleor arc but you can select several. To trim to asymbol you need to explode it first. See Explode3. Click Trim in the dialogue box.4. Select the polyline, circle and/or arc that you wish to trim. The part of thepolyline that you selected is trimmed (deleted). It is even possible to trimobjects that you have trimmed to. It is possible to select several lines with theselect command (for example windows or crossing) and you can also select aline or a polyline. Select with a right click and the Select button.5. Click Done or press F2 or Enter when you have finished.It is possible to trim to interpolated objects. The trim command, as well as the extendcommand, can trim towards the other lines extension. In other words the lines do nothave to attach to be trimmed.The alternatives of the trim command are ”Keep Z”, ”Interpolate Z” and ”Interpolate other Z”.Keep Z means the Z coordinate is not affected.Interpolate Z means the Z coordinate is calculated at the intersection, byinterpolating the trimmed object.Interpolate other Z means the Z coordinate interpolates from the intersection.Note: It is not possible to trim a symbol that is connected to a point code. This is treated as a point or polyline andnot as a symbol.TIP! You do not have to close the command if you want to trim other objects. Just click Select again and selectmore objects to trim to.204
ModifyLengthenModify|LengthenLengthens a polyline by a specified distance, a specified percentage of the linelength or to the total length of the line. Click on the side of the line that needs to belengthened. This command can also be used to shorten polylines by entering alength that is shorter then the original one.The procedure is as follows:1. Select the polyline.2. Select if you want to lengthen the polyline with a fixed length, a percentagelength or a total length.3. Click on the part of the polyline that you want to lengthen.You can select a negative value if you want to shorten the polyline.205
<strong>Topocad</strong>StretchModify|StretchThe command Stretch extends or pull together chosen points in a line.Mark one or several points in one or several lines. Activate the command Modify|Stretch - click on"Stretch" and then you can move and stretch the chosen points. To add or delete points from yourchoice, just click the Choose button and then choose points (alternative Ctrl - choose) and then clickthe Stretch button.206
ModifyChangeModify|ChangeChange allows you to change the layer, line type and colour of existing objects.The procedure is as follows:1. Select Change. (Layer, line type or colour).2. Select the objects to change.3. Select the new layer, line type or colour from the drop-down menu, or:4. You can also choose to select the new layer, line type or colour by object.5. Highlight another existing object with the particular layer, line type or colour youwant to use for the selected objects.TIP! It is also possible to change layers, colours and line types, and other things using the Change propertiesfunction.TIP! It is possible to repeat the command by pressing the spacebar or the Enter key!207
<strong>Topocad</strong>Change entity orderModify|Change entity orderShortcut key Shift + OThis command is used to change the order of objects in a drawing. The command isused for filled and patterned areas so that you can move a filled area forwards,backwards, to the front or to the back in the drawing.The procedure is as follows:1. Go to Modify|Change order2. Select the object you want to move.3. You can decide to place it at the front or back, behind another selected object,or move it forwards or backwards one step at the time.4. Done!In a drawing there are often many objects. Therefore, when using commands likeMove back and Move forward it may seems like nothing happens, but in fact itdepends on the number of objects in the drawing, and it can take some time beforeyou see the change in the drawing. It is then faster to use some of the othercommands.Compare this with the layer setting function where you can give the objects in a layera priority - the higher the number the higher the object appears in the drawing list.208
ModifyChange propertiesModify|Change|PropertiesShortcut key Ctrl + ERight click (when objects are selected).Double click on the objectBy selecting one or more objectsand activating the Changeproperties command (alsoavailable in context menu) youcan change almost anythingregarding these objects - layer,colour, co-ordinates, closedpolyline, radius etc. If you haveselected different types of objects,for example a line and a text, youcan edit the information they havein common, like layer or colour.If several objects with a length areselected, the sum of these lengths will bedisplayed. If several objects with areasare selected will the sum of the areas bedisplayed. Neither the sum of the lengthor area are editable.Show Pt. Code DescriptionThe description of point code is viewablefor points and lines in drawing. Thedescription uses the same printingsettings as the code.See also:Change layer, line type, colourShow point info209
<strong>Topocad</strong>Change properties by entityModify|Change|Properties by entityShortcut Shift + PThe command can be used to copy properties from an entity to another.The procedure is as follows:1. Select the properties that shall be copied. (Layer, line type, colour, line weight)2. Select the entity that shall be changed.3. Select the entity that selected properties shall be copied from.The command can also be done from the toolbar:Make entity layer currentClick on the icon and thereafter on wanted entity in drawing.Make entity properties currentToolbox for current layer, line type, colour and line weight have a button for adding style of theproperties from entity.210
ModifyEdit polylineModify|Edit polylineShortcut key Shift + LThe polyline can be edited in the Edit polyline dialogue box by editing the text orgraphically using the mouse. A third way to edit polylines is to go to View|Edit as textThe procedure is as follows:1. Go to Edit polyline.2. Select the polyline you want to edit.3. Either move it with the mouse or enter new values in the dialogue box. Youcan change the co-ordinates, point ID, radius and point code. The point codecan be selected from the drop-down list or you can enter another one. Thenew point code will automatically be stored in the current code table (defaultname is <strong>Topocad</strong>.TCT). To ensure that the changed information will be appliedgo to Next or Previous point before clicking Done.4. To go to Next or Previous point: click on the appropriate button. You will see asmall cross at the current point. When you reach the end of the polyline eitherthe Next or Previous key will become greyed out.5. To select a new polyline to edit, click Polyline and then select the desiredpolyline.6. When you have finished editing the polylines click Done.211
<strong>Topocad</strong>Explanations of the dialogue boxAddAdds a point after the current point. The default position is halfway between thecurrent and next point.RemoveDeletes current point.PolylineYou can select another polyline by clicking here.ReverseReverses the direction of the polyline.Closed polylineThis will join the first and last points together. It will not create an extra point.Construction lineA construction line will be displayed on the display or drawing but not on the printout.SplineSelect whether or not the polyline should be a spline.Filled polylineCreates a filled area with the same colour as the line. You can also select a patternfor the line here.Change directionIt is possible to edit the polyline so it changes to the opposite direction.You can close the dialogue box by clicking in the top left corner and then edit thepolyline with the mouse. Right click functions can easily be used to make all changes.Select the co-ordinates toolbox or open the dialogue box.Note: If you enter a new radius you will not be able to see it until you exit the polyline. (Done)212
ModifyEdit attributesModify |Edit attributesShortcut key Shift + AEdit attribute allows you to change the value (name etc.) of the attribute for a point.You can also use this command to change a point code or the point ID for a point.The order of the displayed attributes is the same as the order in which they weredefined when the symbol was created. If more than four attributes are associatedwith the symbol you will notice a drop-down list to the right. You can also change apoint code and point ID by going to View Info.The procedure is as follows:1. Select Edit attributes.2. Click on the point for which you want to edit the attribute, point ID or pointcode.3. Edit the point (point ID point code or any attribute data). Some attribute datacannot be edited because the attribute cannot be updated.4. You can select the next point by double clicking on it.5. Click Done.Edit Object AttributesThis command gives the user possibilities to edit/add/delete object attributes, on objects without213
<strong>Topocad</strong>database information.The command shows an object attribute or several attributes common attribute.Add and delete attributes via the attribute button.Note: It is not possible to edit the point ID or point code for a symbol that has attributes!Note: The attributes are associated with the point code. If you select another code for thepoint the type of attributes will change. The data will be attached to the point but cannot be214
Modifydisplayed or edited. If you want the attribute to appear on the drawing you will need to createor modify a symbol with that attribute.Point attributes (with link from point code) can also be edited via Edit as text;View|Tool box|Edit as text. (Shortcut key Ctrl + U) This is a useful command if you wantto edit several attributes at the same time.See also:Attribute definitionAttributes215
<strong>Topocad</strong>Edit textModify|Edit textShortcut key Shift + TThe Edit text command can only be used to edit the content of the text, not to moveor rotate it etc. If you want to move, scale or rotate text you need to select theappropriate commands such as Modify|Move, Modify|Scale and Modify|Rotate. It isalso possible to edit text by going to Modify|Change propertiesTo edit text:1. Select Edit text.2. Click on the text to be edited.3. Enter the correct text. You can also copy and paste (shortcut key Ctrl + V) textinto the dialogue box from another text editor.4. To edit another item of text, click on it in the drawing.5. When you have finished click Done.You can also edit text using the View Info command.Another way to edit text is command Modify|Change|Properties (shortcut key Ctrl +E). In this command you can edit size, scale, position, colour, and also the content ofthe text. However it is easier to edit the content in this command.216
ModifyAdd background mask to textSelect Background Mask when creating text. Select Fill color to choose a color, andoffset values to decide background mask size in relation to the text. The settings canbe edited afterwards by changing settings for the text or by the command edit text.See also:Change propertiesTIP! It is possible to repeat the command by pressing the spacebar or Enter key.217
<strong>Topocad</strong>Change groupModify|Change|GroupShort key Shift + GA group is a number of objects that are linked to one another. Some groups areconnected automatically - such as contour lines, dimensions, slope hatches. Othergroups can be created manually.A group can be selected all at once. All modify commands will then apply to thewhole group.A group can contain subgroups.To create a group go to the Group command under Construction. To modify a group:AddAdds an object to the selected group.RemoveRemoves an object from the selected group.See also:• Construct a group218
ModifyGtransformationModify|GtransGtrans is a third party software package that can be implemented into <strong>Topocad</strong> andused to transform known parameters between some systems. Systems can be setup.New transformation relations (.tf and .tfi transformation information files) adds to theselected relation catalogue. The dialogue also shows a description of selectedrelation.The procedure is as follows:1. Select the objects you want to transform.2. Go to Modify|Gtrans.3. Select the system you want to start from.4. Select the system you want to go to.5. Select whether you want the transformation to create a new file(recommended).A .tf file looks like this:219
<strong>Topocad</strong>See alsoTransformation.220
ModifyModify rasterModify|Modify rasterThe command changes the settings for inserted raster images.Save TFW, JGW, SDWCheck boxes to save the geo ref. data in TFW, JGW and SDW files. The geo ref.data is saved the same time as the drawing is saved and has the same file name,except the file extension. If the geo ref. data is saved for a certain raster image, theraster image will get the same position if it is inserted into another drawing.You can edit any image and its search path, if the image shall be referred or placeddirectly in the drawing, and its insertion points, direction and scale. This informationcan also be edited with the command "Edit preferences".221
DrawingDrawingFunctionLayer managerObject propertiesBase lineScaleSymbolLine typesExternal referencesCo-ordinate systemDescriptionLayer settings are created here.Properties for new objects.Create and use a base lineDrawing scaleSymbols in drawing and global file.Line types in drawing and global file.Use of external drawings as external references.Selection of co-ordinate system for the drawing.223
<strong>Topocad</strong>Layer ControlDrawing|Layer controlLayers are one of the many ways to distinguish between different types of data in<strong>Topocad</strong>. A layer can consist of buildings, pipes, cables, polygon points, survey 1 etc.Using layer control is an effective way to handle different types of data. The layermanager is a toolbox, in other words it can be open while you work with the drawing.It is possible to work with layers in several ways. These will be explained here.To create a new layer:1. Activate layer control.2. Click on the button Create down to your left. Enter the name and description.The layer can have any name. Note that other CAD programs may not allowspaces or accented characters such ad Å, Ä, Ö.SettingsCurrentSelect which layer will be the current layer. This can also be done in the menu. Aquick way to select a current layer is to double click the layer name in the list to theleft of the layer control window. The current layer will be displayed with an arrow tothe left of it in the status list.NameChoose any name to the layer, but remember that it may change when exporting toother drawing files.DescriptionThe layer can have a description.224
DrawingLine typeSelect which line type you want to use for the layer. Note that the point code mayhave a different line type. If this is the case, the line type of the point code will be theactive one.ColorSelect which color you want the layer to have. If you have already made settings e.g.in. the code table you do not have to do so again.FrozenYellow mark means not frozen and snowflake means frozen layer. A frozen layer isnot visible and cannot be regenerated. The good thing about working with frozenlayers is that it is much faster, compared to hidden layers. This is because they arenot included when regenerating the drawing.Function to easily freeze layer: Activates by clicking the button or from right clickmenu. If the command is activated, all the layers the user clicks on will be frozen.The command terminates when clicking Escape or Return or by activating anothercommand.VisibleThe visible layer is marked with a yellow lamp when it is visible and a grey lampwhen it is hidden. A hidden layer is not visible but will regenerate when the drawing isregenerated.Read onlyRead only is marked with a lock which can be locked or unlocked depending on itsstatus. A read only layer is visible but although you can snap on it you will not be ableto change anything in the layer.Display onlyDisplay only is marked with a cross in the square. The layer is visible but you cannotwork in it.Layer levelThe layers can be stated in different levels where the higher the level shows higher indrawing. In a similar way as order but on a layer level. The layer level has a higherpriority then what the object order has.Zoom alternativesA layer is visible only within certain zoom limits (zoom= the drawing width in meters).• On: the layer displays only within certain zoom limits.• Off: The layer is displays only if it is selected as Visible in the layer manager.• Min zoom: the minimum zoom where the layer is visible.• Max zoom: The maximum zoom where the layer is visible.Blank values on Min zoom and Max zoom are not valued as limits.Current zoom in drawing is displayed at the scaler if settings has been made under Settings|Systemsettings|Screen|Display zoom and if the scalor is visible.225
<strong>Topocad</strong>ObjectThe number of objects in this layer.CommandsCreateCreates a new layer and a description can be made.EditGives you a possibility to edit the name of the layer and description.DeleteDeletes a layer. If the layer contains an object you will be warned.Previous/NextDisplays previous and next made layer setting.See also:Object propertiesChange Properties226
DrawingEntity ModesDrawing|Entity ModesDescribes a new object and allows you to change it.The procedure is as follows:1. Select Object properties.2. Select the line type, colour and elevation for the new object. All types of datacan influence polylines. Colour and height influence points and line types andcolours influence circles and arcs.3. To avoid this command you will need to set the default values.See alsoChange properties227
<strong>Topocad</strong>UCSDrawing|UCSA baseline is an effective way to interpret different objects. To create a baseline youhave to select the origin and the direction for the baseline.To activate the baseline:2281. Select Drawing|Baseline2. You can now select a previously saved baseline by selecting the name fromthis list. To create the baseline:3. Select the point for the new origin. You can use snap commands or enter thevalue manually.4. Select the direction for the X (north) axis.5. Save the baseline by entering a name in the upper box.To activate the baseline, tick Activate. You will notice that as soon as you haveselected the origin and direction the dialogue disappears. However, if you forget toactivate the baseline you will not lose the settings.The baseline will be displayed with the crosshairs, which will have the same directionas the baseline.The baseline can also be used in View|Co-ordinate toolbox and for point differenceSelected co-ordinate system is also shown as co-ordinate axis in the systems originor in the windows lower left part, if the origin not is visible.To deactivate the baseline:
Drawing1. Select Baseline2. Select Global from the list.3. Click OK.TIP! If you enter local co-ordinates from the baseline, enter them in the Co-ordinates toolbox (View|Toolbox|Coordinates)229
<strong>Topocad</strong>ScaleDrawing|ScaleThe drawing scale should ideally be corrected at the start of the drawing. Thedrawing scale will influence any symbols and text which are inserted. It is possible toselect any scale when inserting symbols but by default it will be compared with ascale of 1:1000.When inserting a symbol you can select the scale size. All symbols in the symbol listsare saved with a scale of 1:1000. If you have selected 1:500 as the drawing scale,the default scale when inserting a symbol will be 0.5. This can be changed ifrequired.See alsoInsert symbol.TIP! If you use default drawings it is better to use the default drawing scale.TIP! If you import a drawing that is in mm it may be better to set the drawing scale to 1:1 000 000 first if you havea non-continuous line style. If not it will take a long time to display.230
DrawingSymbolsDrawing|SymbolsIn Symbols in the Drawing menu there are two tables of symbols: the local (drawing)symbols and global (tsy) symbols. You can copy them from one table to the other.If you copy a local symbol to the global table you can then use it in other drawingsand point codes which are to be edited in Edit codetable. If you copy a global symbolto the drawing you will be able to include this symbol with the drawing even if it hasnot been inserted into the drawing.When you create a symbol it will only appear in the local (drawing) table. This is alsothe case when you import a file with symbols - the symbols will only be saved locally.A number in parenthesis means there are several symbols made in differentdisplaying scales.Find out more about attributes and symbols:• Drawing|SymbolsCreated symbols are stored in the local drawing. You add them to the globaltable here.• System|SymbolAll symbols in the global table are displayed here. You can delete symbolsfrom this dialogue box.• System|AttributeCreate the attribute itself and all associated data.• Define attributeDefines the attribute with the symbol when creating the symbol.231
<strong>Topocad</strong>• Create symbolHow to create symbols and associate attributes with them.• Attributes for point codesHow to associate attributes with point codes.• Edit attributeHow to edit an attribute in the drawing when associated with a point code, asymbol or both.• Settings|System filesThe global file for symbols is selected in the settings and system files. Systemfiles have the extension .tsy for symbols and .tat for attributes.See alsoInsert symbolCreate symbolPreferences - System files232
DrawingLine typesDrawing|Line typesIn Line types in the Drawing menu there are two tables of line types: local (drawing)line types and global (tlt) line types. You can copy them from one table to the other.If you copy a local line type to the global table you can then use it in other drawingsand point codes which are to be edited in Edit codetable. If you copy a global linetype to the drawing you will be able to include this line type with the drawing even if ithas not been inserted into the drawing.When you create a line type it will only appear in the local (drawing) table. This isalso the case when you import a file with symbols - the line types will only be savedlocally.See alsoSettings - System filesEdit codetableCreate line type233
<strong>Topocad</strong>External referencesDrawing|External referencesExternal references are used to link other drawings to the current drawing in thebackground. This is useful if you need to use other drawings for reference only. It canalso be used to minimise the size of the individual drawings.The procedure is as follows:1. Select the Drawing|External references command2. Click Add and load/open the drawing you want to link to your drawing in thebackground.3. Continue until you have added all the drawings (models) you want to use inyour drawing.4. You can select an internal order for them.5. You can also delete the external references and edit the drawing by clickingModify.You can choose if you want the external references toolbox to be visible or not, andalso if it shall be active. To snap the toolbox needs to be active.This can be useful when you need to create drawings to plot. Inserting the drawingsyou want to use as external references and then creating a drawing sheet to use forthe plot is an effective method when you are using both models (real co-ordinates)and paper (paper co-ordinates).See alsoDrawing sheet234
DrawingCo-ordinate systemDrawing|Co-ordinate systemThe drawing can use a specific co-ordinate system. When importing data to adrawing, a warning will appear if the drawing you are trying to import to uses adifferent co-ordinate system.See alsoFile|Settings|System settings - Co-ordinate system.235
<strong>Topocad</strong>Find entityDrawing |Find EntityFind Entity locates the entities by their points, lines and object attributes and highlightthem in any colour.AttributeDefines which attribute to search in. It can be all attributes or a single attribute.ValueThe value is the string to search for.The search is not case sensitive and the user can choose to search for attributes withequal value or values that contain the search string.The result is displayed in a grid as type (entity type), attribute (attribute name) andvalue (attribute value). The number of matches is located at the right bottom of thegrid.By selecting a row, the entity connected to it is highlighted.Entity can be selected/unselected in drawing by right clicking in the grid and selectingSelect Entity | Unselect Entity.FollowFollow pans the screen to highlighted entity.SettingsFrom Settings, the user can select which colour to use for highlighting.236
SystemSystemFunctionEdit code tableControl codesAttributeSymbolsRoadline managerPoint code toolbarsDescriptionCode table definition and editingControl code editingAdd and edit attributesEdit the symbol list.Roadline management237
<strong>Topocad</strong>Edit codetableSystem|Edit code tableFunction, commandLine typeSymbolAttributeImport/ExportSurveyCalculation functionDescriptionSelect line typeSelect which symbol (if any) the point code willhave.Link an attribute directly to a point code, a symbolor both.Change the point code when importing from, andexporting to a file.All codes which are used at any point in any open file will also appear in the codetable. As soon as you open a file or import field data into a survey data file (.sur) allnew codes will be inserted into the code table. You may of course have existingcodes in the code table even when they are not being used in any open document ordrawing. It is not possible to delete an existing code if it has been used in any opendocument. This is indicated by the delete button being greyed out. It is possible touse different code tables. They can be selected using File|Settings.To input a point code:1. Open Edit code table.2. Click New.3. Add the new point code.In the code table there are up to six different tabs with information and functions usedin the survey and to import and export data. The last tab depends what function thecode has.The tabs are:• LineContains information about the type of line, colour and line type scale.• SymbolContains information about the type, colour, scale and orientation of thesymbol.• AttributeThe attributes of the point code are entered on this tab.• SurveyInformation about the type of point, calculation functions, transfer code and inwhich layer the point code will appear.238
System• Import/ExportContains the transfer code, layer and export code.Calculation functions:• ExtrapolateCalculation function for extrapolation.• Rectangle 2Calculation function for two point rectangles.• Rectangle 3Calculation function for three point rectangles.• Circle 2Calculation function for two point circles.• Circle 3Calculation function for three point circles.• Arc 2Calculation function for two point arcs.• Arc 3Calculation function for three point arcs.• Parallel lineCalculation function for parallel lines.• Closed lineCalculation function for measurement of closed polylines or polygons.General for all point codes• DescriptionDescription of the point code. This is not essential for the point code tofunction.• NewButton for creating a new point code.• DeleteDeletes an existing point code. If the point code exists in any open documentthis button is greyed out because the point code cannot be deleted.• Use Clear button to remove all not referenced point codes from system files.239
<strong>Topocad</strong>Line typeSystem|Edit code tableThere are several different types of lines to select. It is also possible to select the linetype in the Layer manager. This allows you to select the line type in several places,but any line type entered in the code table is given a higher priority than one enteredin the layer manager. In the code table it is possible to select the line type by layer.• Line typeSelect the line type from the list or use the default choice by layer.• Colour:Select the colour of the line type.• Line type scale:It is possible to select a scale for the line type. This means that you can decidethe continuity for different line types.• Use Clear button to remove all not referenced line types from system files.• >> and
SystemSymbolSystem|Edit code table• SymbolSelect which symbol (if any) the point code will have. Select from the dropdownlist.• Colour:Select the colour for the point code. It is also possible to select by layer.• X-scale, Y-scaleThe symbol is always saved with a scale of 1:1000. The default drawing scaleis also 1:1000. It is possible to select a different drawing scale inSettings|Drawing scale. For example, if you want to the symbol to appear attwice its original size (1:1000) you should enter the scale 2.0 in this field.• RotationDetermines the rotation for the symbol.241
<strong>Topocad</strong>Attribute of point codeSystem|Edit code tableAn attribute is a type of added value for the point. An attribute can be linked directlyto a point code, a symbol or both. The attribute can be entered in the field survey, thesurvey data document (.sur) or in the drawing - Go to Modify|Edit attribute. If you linkan attribute to a point code you can give every point with this point code an attributevalue. If you have used a symbol for the point code and want the attribute to bedisplayed as well, you will need to create the symbol with a linked attribute. To addan attribute to the symbol see Construct|Define attributeThere are no limits to number of attributes that a point can have.The value of the attribute belongs to the point but the type of attribute belongs to thepoint code.AddClick Add if you want to add an attribute to the point code. The attribute list appearsand you can select from the list. To create an attribute go to System|AttributeDeletePress delete if you want to delete a link to the specified attribute. Note that you onlydelete the link to the attribute and not the attribute itself.242
SystemImport/ExportSystem|Edit code tableThe Import and Export function allows you to change the point code when importingfrom and exporting to a file. It is also possible to sort the point code into differentlayers. You will find a similar function for survey data on the previous page - Survey.Import - Transfer point code:Interpolates the point code (point in file) to another point code. For example, you canuse the numeric point code 10 in the field which is translated to pp in the drawing. Asimilar function exists for points that are imported from a file. See previous page -Survey.Layer:This function allows a point code belonging to a point in a file to be moved to aspecific layer. It is possible to use a layer name for all kinds of trees and then put alltree point codes in that layer. It is also possible to create a specific layer for everypoint code if required. Similar functions exist for points which are imported from files,see previous page - Survey.Export - Transfer point code:You can also specify that the point code used in the drawing should be interpolatedto another point code when it is exported to a file.243
<strong>Topocad</strong>SurveySystem|Edit code tablePoint typeIf the point is to be used as a back sight or control point, save it as a station.Select "point" or "type" if the a point code shall be used specifically for points or lines.Calculation functionDifferent types of calculation functions-.Translation code:The code can end up with a different code in the drawing. Enter the name here.LayerWhich layer is the target layer in the drawing for this code? Enter the name here. Thelayer will be created if it does not exist.Point types:NonePolygon pointThe point will be calculated and added to the pp file.Check pointUsed for check towards known point.244
SystemTemporary pointThe co-ordinates are temporarily saved and the point can be used as a back sight orstation in later stations in the same survey file.Back sightFunction used to code back sights in the survey.Control codesCode table + Control tablePoint with codes using these point types will have the following control codes:• Point• Line: Starts in first point• Construction point: control point. Will not be included for calculation. Can beused for breaking line and start over with the same code.Line connection "Code table + Control Code" is also used for general import. Possibility to filter pointcodes on point type in all controls for selection of point code.Calculation functionThe calculation functions are:Two prism measurement245
<strong>Topocad</strong>The extra two prism measurement function is used when measuring a two prismobject. An example is the measurement to the ABC pole which has two prisms at thesame pole. You decide from which prism you measure the length to the end of thepole and also which of the two prisms you measure first.See alsoControl codes246
SystemControl codesSystem|Control codes247
<strong>Topocad</strong>248
SystemControl codes are used to create geometry directly from the field survey. You enterthe control code in the field survey and it can provide you with a great deal ofinformation when it is imported into the drawing. The control codes are as follows:Code Description FunctionSP Single point Survey of single pointSPB Single point break Survey of single point that breaks former line.END Line end Line endCLOSE Closed line, end Finishes a line and closes it.ST Line start Start at lineCHK Check point Measurement of check point.C3 Radius from 3 points Creates a radius from three measured points.ENDCV Radius end End of radiusSTCV Radius start Start a line with a number of radii.NEWCV New radius New radiusENDONCV End of radius End of radiusCLSRECT Closed rectangle.DIAM Diameter The diameter is stored in the attribute value (Diameter in this case).STLSizeWIDWidthPOC Point in curve Measurement of curve through several points.STIPCStart of line, ignore pointcodeSPAR Start parallelEPAR End parallelExtExtendDistCo-ordinate by distanceDISTADJCo-ordinate by distanceand adjustNOZNo heightCDOFFCo-ordinate by distanceand offsetJCJoin to closestJNJoin to nextJPJoin to previousRECT RectangleCIR2Circle 2 pointsCIR3Circle 3 pointsMOVETO Move to point Enter Point ID at attributeCPConstruction pointSTSPL Start spline curveENDSPL End spline curveRLReturn to line249
<strong>Topocad</strong>AttributeSystem|AttributeYou create attributes and assign the required characteristics to them under Projectattributes.Use Clear button to remove all not referenced attributes from system files.AttributesThis is a list of all the attributes in the project.Attribute settingsPrompt:If you want the attribute to have another name when plotted, enter the alias namehere.Visible:Tick this box if you want to the attribute to be visible on the drawing. The defaultvalue is visible. If you want to use an attribute but do not want to show it on thedrawing leave this box unticked.250
SystemPreset:If you want the attribute to have a preset value enter it here.Constant:A value that has been assigned to a constant attribute cannot be changed or edited.Update:If the attribute is connected to another value, e.g. a height or point code, the valuewill be updated if this box is ticked.Metadata:Metadata can be selected if you create a new attribute and select the type ofmetadata (not text).If you want the attribute value to be entered in the metadata file (X.md where X is thesame name as the drawing) then select which metadata field you want to store thisinformation in. For example you can choose to enter the scale in the SCALE field inthe metadata file. If you have several attributes with the same metadata <strong>Topocad</strong> willuse the most recent.Prefix:This is used if you want to enter a prefix for the attribute. e.g. D= Owner:Suffix:This is used if you want to enter a suffix for the attribute. e.g. mm, m, km, feet, MPa.Default:If you want the attribute to have a default value enter it here.Preset from:If you want the attribute value to be taken from another field, enter the relevant fieldhere.Upper/IgnoreState whether you only want upper case to be used for the attribute or whether itshould be exactly as you entered it.TemporaryBy checking off Temporary flag or other change of the attribute, the attribute will notbe temporary - it will be saved in the attribute table. Notice that attributes not createdor changed manually by the user, are only temporary and are not saved in theattribute table. Temporary attributes displays with red text in the attribute dialogue.Save allRemoves temporary flags from all attributes so they all will be saved in the attributetable.See alsoDefine attribute.251
<strong>Topocad</strong>SymbolsSystem|SymbolsThe symbol manager can be used to rename and delete symbols from the symbollist. A preview function is built-in, allowing all symbols to be displayed.Symbols that are connected to an existing point in the drawing, or to an attribute orcode list, cannot be renamed or deleted.In the Symbol/Line type manager you can also select whether you want to store yourlocal symbols or line types in the global table or load a symbol from the global list(selected in Settings|System files) to the drawing. All symbols that you haveimported, created or entered will also appear in the drawing.Symbols that you have imported and/or created directly in the drawing must beexported to the global symbol table if you want to use them in this table.Symbols that have been inserted from the current symbol table into the drawing willbe displayed and stored in the local drawing. You can store any other symbol locallyin the drawing if you want to export the symbol with the drawing.Use Clear button to remove all not referenced symbols from system files.>> and
SystemSystem|SymbolAll the symbols in the global table are displayed here. You can delete symbols fromthis dialogue box.System|AttributeCreate the attribute itself and all associated data.Define attributeDefines the attribute with the symbol when creating a symbol.Create symbolHow to create symbols and associate attributes with them.Attributes for point codesHow to associate attributes with point codes.Edit attributeHow to edit an attribute in the drawing, whether it is connected to a point code, asymbol or both.Settings|System filesThe global file for symbols is selected under Settings and system files. The systemfiles have a .tsy extension for symbols and .tat for attributes.253
<strong>Topocad</strong>Roadline managerSystem|Roadline managerThe roadline manager is where you select which roadline will be the current one. Thisis the roadline that will be used for calculating sections and section/offsets. You canalso save roadlines and open roadlines from the roadline manager.It is possible to have several roadlines loaded but you can only select one to be thecurrent one.254
SystemPoint code toolbarsSystem|Point code toolbarsPoint code toolbars is used to create your own shortcuts for point codes.Open the dialogue by clicking System|Point code toolbars or File|Systemsettings|Toolbars and click the button Point code toolbars. The following dialogue willappear:Add toolbar• Create a new toolbar by clicking the button Add toolbar.255
<strong>Topocad</strong>• The following dialogue will appear. Setname, width and height.• Edit toolbarSelect Edit toolbar to change name, width orheight.• Remove toolbarRemove toolbar will erase the toolbar immediately.Available Point CodesIf you don't have any point codes, create new in Edit code table.Add buttons to your toolbar1. Select an available point code from the list.2. Select Symbol or Linetype. Symbol will draw points with a symbol andLinetype is used to create lines with a certain linetype.3. Click remove-button to erase buttons in toolbar.The new toolbar will appear as a small dialogue. You may dock the new toolbar toany of the vertical or horizontal toolbars.256
System257
Add-on modulesAddons|DTMFunctionCreate DTMDTM StatisticsEdit DTM3D view in DTMAdd DTMExtract DTMUpdate DTMMove DTMImport and exportDTMExternal referencesin DTMContour linesHeight on contourlinesHeights from DTMVolume model tomodelVolume from crosssectionsDescriptionCommand for creating a terrain model.Statistics of the DTM, see below.Edits the DTMAdds two DTMs to a third one.Extracts a minor part from an existing DTM.Updates a DTM with points and lines.Moves a DTM in height.How to import and export a DTM.Using external references in a DTM.Command for creating contour lines.Enter height text for contour linesSelects heights from the DTM to be applied to objects inthe drawingAdd-on-module. Calculates volumes between two DTMs.Add-on-module. Calculates volumes from two DTMs usingsections.Statistics259
<strong>Topocad</strong>Statistics of the DTM, showing the number of points, triangles and lines and the minimum andmaximum X, Y, Z values in the DTM.260
Add-on modulesEdit DTMDTM|Edit DTMShortcut key Shift + DThe edit DTM command is used to select and edit the Digital Terrain Model.To edit the DTM:1. Select Modify |Edit DTM.2. Select the DTM to edit by clicking on the button. (Top right-hand corner of thedialogue box.)3. Highlight the DTM you want to edit and click OK.The following commands can be used to edit the DTM:Unerase - Create new trianglePoint to a triangle outside the DTM to create a new triangle. An easy way to do this isto go to View in the DTM and display Deleted triangles.Erase triangleClick inside the triangle you want to delete.Swap triangle in the DTMTo rotate two triangles inside the DTM click inside two triangles which have the samebaseline.Pop-up menuRight click on the terrain model and a pop-up menu will appear for the command.Create or erase triangles with line or polyline by selecting Select|Crossing line andSelect|Crossing Polyline.261
<strong>Topocad</strong>PointsIt is possible to edit and move points in all directions and also to give them a pointcode. You can also delete a point in the DTM. It will only be deleted in the DTM andnot in the drawing.DisplaySelect DTM|Display|Edit settings1. Click OK when you are ready.Direction Arrows262
Add-on modulesThe direction arrows display slopes of the triangles in a terrain model. The direction arrow of a trianglestarts from the middle point of the triangle and points to the direction of the slope. The length of thearrow depends on how steep the slope is and also the scale of the height.Edit settings - DisplayYou can view Triangles, Erased Triangles, Surveyed Lines and Contour lines. Thismakes it easier to understand what you are looking at and what you can edit.TrianglesSelect if required and choose which color you want to use for created triangles. Werecommend that black is used for created triangles.Erased trianglesSelect if required and choose which color you want to use for erased triangles. Thesetriangles are not actually in the DTM but can easily be created. It is also easy todelete a created triangle and these will then appear in the color you select here. Werecommend that grey is used for deleted triangles.Surveyed LinesSelect if required and choose which color you want to use. If you edit the DigitalTerrain Model on top of your drawing you will also see the drawing underneath.Contour LinesSelect if you want to see where contour lines will be created. Choose which color youwant to use for this. You can also select the intervals at which the contour lines willbe displayed. Note that this does not create contour lines; it just shows a preview ofwhat they will look like.263
<strong>Topocad</strong>3D ViewThe DTM can be viewed in 3D. For functions of this see the 3D view.264
Add-on modulesCreate DTMAddons|DTM|Create DTM...The DTM (Digital Terrain Model) can be used for various calculations, e.g. volumecalculations and contour lines. The <strong>Topocad</strong> DTM is a triangle model which creates atriangle using the three closest points in each case. However, there are someexceptions.The result will be a set of triangles: from above they look like just triangles, but eachpoint will have a height attributed to it.Select object:Select the objects you want to use to create a DTM. To select objects, see SelectentitiesIt is possible to hide, freeze or make layers invisible to ensure that the wrong objectscannot be selected. It is important that you do not select co-ordinates with a height ofzero as this will create a gap in the DTM.Max. length:This length limits the maximum length of a triangle side on the outer side of themodel. Triangle sides that are longer than this will not be included in the model. Thisis a quick way to limit the editing of the model. You can either type in a value, orselect one by clicking in the drawing. Click on two different points. The lengthbetween them will be the maximum length:265
<strong>Topocad</strong>Check same line:By default this is unchecked. This limits the triangle so it is impossible to create acomplete triangle with all three points on the same surveyed polyline. It will alsocalculate using polylines as break lines.Max. Z/Min. Z:This displays the maximum and minimum heights of the selected objects.Skip Z = 0Selecting this box will exclude all points which have a height of 0. (These will usuallybe theoretical points).Curved break linesThis feature is used to calculate break lines in the DTM. It divides the radius atvarious intervals so that each one can be used to calculate triangles. Creates reallyaccurate models.PolygonsYou can choose to include or exclude polygons.BoundaryIf the box "include boundary as line" is checked, the selected (if there are any)boundary will be included as a line in the model. The boundary's points will beincluded as points in the model if the box is unchecked. When the boundary isincluded, the Z values collects from the boundary. If the boundary includes as points,the Z values are calculated on the basis of the model, as the models looks before itcuts off at the boundary.See also:Edit DTMNote:When creating the DTM, check that it does not contain duplicate points as this can create errors. If you havetrouble creating a DTM, you can export the objects to a co-ordinate file and then import it to a new blank drawingand create the DTM from that.266
Add-on modulesCreate contoursAddons|DTM||Contours...Contour lines will be created from a DTM with a selected interval. It is possible to splitthe elevations into separate layers for different levels. There are also various ways tosmooth out the contours.ModelSelect the DTM you want to create the contour lines from. By clicking on the dropdownarrow you can choose from the DTMs currently listed in the DTM manager. Byclicking on the Browse button you can choose from all of the stored digital terrainmodels.IntervalEnter a value for the interval you want to use to create the contour lines.Smooth contoursThere are four ways to smooth out the contours. Three involve creating splines andone uses the radius. If using the radius you need to enter a factor. Anything between50 and 400 is acceptable.Layers267
<strong>Topocad</strong>Default layerYou can select a default layer which is used for any elevation that does not have aspecific layer.Interval/LayerDefine which elevations are to be moved to a specific layer and name each layer. It ispossible to use the default elevations and layer names.Text268
Add-on modulesThis command allows you to place text on the contour lines. Text is displayed at aspecified interval along the contour line. Text can be placed either on or above theline.See alsoText on contoursCreate DTMModify DTM.269
<strong>Topocad</strong>Height on contours...Addons|DTM|Height on contours...It is very easy to enter heights for contour lines, or even for all lines that appear in thedrawing. You need to define the font and text height, which layer to put the text inand where the text should appear.By default the text will be placed above the contour line. If the area is flat, the text willbe placed in the direction indicated. You can also tick the "Orientation from selectionorder" box, which will create text in the direction indicated, from bottom to top.FontSelect which font you want to use for the heights.HeightSelect the height in millimetres that you want to appear on the drawing.DecimalsEnter the number of decimal places to display.LayerIt is possible to select different settings for layers:270• · Fixed layers: select a layer for the text.• · Same as contour lines• · Same as contour lines + suffix for the layer.SelectDraw a hidden line across the contour lines. The heights will be placed where thelines cross.
Add-on modulesHeights from DTM...Addons|DTM|Heights from DTMThere are several ways to get the heights from a DTM.• Take the difference in heights of the selected object(s) in the DTM and save itto a co-ordinates file.• Take the sum of the heights of the selected object(s) in the DTM and save it toa co-ordinates file.• Take the heights of the selected objects from the DTM and save them to a coordinatesfile.• Move points from the selected object(s) to the DTM.You have to select the DTM to use before you begin. You can select an existing DTMby using the drop-down arrow or the Browse button.271
<strong>Topocad</strong>Volume model...Addons|DTM|Volume modelThe Volume model compares two digital terrain models with one another, or onemodel with a flat surface. The calculation is made using a grid and calculates theheight differences between two models.To calculate the volumes between a terrain model and a fixed surface you need272• A created terrain model (DTM).• A level to calculate from.• If required, polygons can be used to limit the area to be calculated.To calculate volumes between two terrain models you need• Two created digital terrain models (DTM).• If required, polygons can be used to limit the area to be calculated.Explanation of the dialogue boxSurveyed (models)Measured model or soil model.TheoreticalTheoretical model or rock model. Bottom model.Fixed levelIt is possible to use a fixed level for calculations instead of a theoretical model.Unit heightThis calculates the volume and area for a model that is situated at [Unit height] belowthe theoretical (bottom) model.
Add-on modulesBoundaryA polygon can be used to include or exclude any areas that should/should not beincluded in the calculation.The result will be displayed in a box andcan also be saved as a text file.Report of volume calculationSettings273
<strong>Topocad</strong>The accuracy of the calculation. The interval used to calculate the areas andvolumes. The default value is 0.25 m which means that every m² is calculated using16 points or distances. Reducing this value will slow down the calculation butproduce a more accurate result.ContoursSelected if you want to calculate different contours. Enter a distance or intervalbetween contours.You can select smooth contours if required (see also contour lines).Thermic colours can be created both on contour lines and as grids (polygonquadrates). We recommend that you do not mix too much here.Layers> 0 = the measured DTM is above the theoretical model (fixed surface)0 = the intersection between the two models.< 0 = the measured model is below the theoretical model.274
Add-on modules275
<strong>Topocad</strong>Volume from cross sectionsAddons|DTM|Volume from cross sectionsThis function calculates volumes between two terrain models by using cross sections.Surveyed (model)Enter the surveyed model, the soil model or the upper model that you are using. Thismodel will be displayed in green.Theoretical (model)Enter the theoretical model, or rock model. This is the bottom model and will bedisplayed in red.RoadlineEnter the roadline to be used for the calculation.The result be saved as a TCS file (Created sections). This file can be used whencreating drawings.See alsoVolume model vs. modelCreating a DTM.Creating a cross section in a drawing276
Add-on modulesExtract DTMAddons|DTM|Extract DTMDTM|Extract DTMExtract terrain modelThis command is used to divide the Digital Terrain Model (DTM) into smallersections. The command can be selected both from the drawing and from the DTM fileitself. The commands are not the same.From the drawing (TOP)Select Add-on|DTM|Extract DTMSelect the terrain model. Use a window or polygon, or select a polyline where youwant to make the extraction. Click OK.From the terrain model windowSelect DTM|Extract DTM.Select the terrain model. Use a window or polygon where you want to make theextraction. Click OK.277
<strong>Topocad</strong>Update DTMAddons|DTM|Update DTMThe DTM can be updated with new lines and points.Select Add-on|DTM|Update DTM. Select the terrain model. Select the objects thatyou want to use to update the model. The settings made when you created the DTMare still valid: there is a maximum length for the triangle's side and Z=0 is not apermissible value.It is only possible to update the DTM within its origin area.278
Add-on modulesAdd DTMAddons|DTM|Add DTMDTM|Add DTMThis command can be used to merge two DTMs together. This creates a third DTM.The command can be selected from the drawing and from the DTM window.From the drawingSelect Add-on|DTM|Add DTMSelect the two DTMs to be merged. Enter the maximum length of the triangle leg.If the terrain models overlap, the first DTM is the valid one.From the DTM windowCommand DTM|Add DTMThe current DTM will be merged with the selected one.279
<strong>Topocad</strong>Move DTMDTM|DTM|Move DTMShortcut key Ctrl + MThis command can be used to move the height of the terrain model. Moves thecomplete DTM.280
Add-on modulesExternal references in DTMDTM|DTM|External referencesShortcut key RThis command is the same as that for external references to the drawing. It adds oneor more drawings as background files for editing the DTM.See alsoExternal references for the drawing.281
<strong>Topocad</strong>Import and export DTMDTM||Import/ExportImport and export of terrain modelTerrain models can be exported to LandXML and 3D Surface in AutoCAD. These formats can also beimported.The export is carried out by opening a DTM and selecting File|Export|File - or LandXML. See moreabout LandXML export.An import is carried out by opening a new DTM file and selecting File|Import|File or LandXML. Datafrom LandXML can be imported in two ways: directly to the document or by importing from theLandXML format.282
Add-on modulesRailwayAdd-on|RailwayThe railway menu is an add-on module called Railway. It has specific settings forsurveying in the rail industry.CommandSlew/liftOverlap measurementSystem settings - RailwayDescriptionSlew/lift logOverlap measurement for control.Specific settings for the railway module.283
<strong>Topocad</strong>Slew/liftAdd-on|Railway|Slew/liftTo place the track in the right position it is necessary to make adjustments to the sideand height.Various points along the rail are measured and checked against the designgeometry. A log of differences between the measured points and the rail design canbe displayed in a graphic or in a text file.The measured points can be selected from a file, from a certain layer or from anoffset from the road line.The next page shows the settings for the graphic log that will be inserted into thedrawing.284
Add-on modulesGraphic representation of slew/lift:285
<strong>Topocad</strong>286
Add-on modulesOverlap measurementAdd-on|Railway|Overlap measurementThe measurement of rails requires at least two rail points in the area to be measuredfrom both stations (from opposite sides). The measurement is made to check that thedifference in angle between the points is not too great. The tolerance for this isspecified in File|settings|System settings - Threshold.Overlap measurement The point coded as OLP (overlap) checks the code for thenearest point. In the example above this is code ESP at point A. (The point codeused is defined in the system settings). The nearest points with the same code (ESP)are found and then the check is made for all of these points. Point A is moved to apoint in between.287
<strong>Topocad</strong>Calculate section from pointAddon|Railway|Calculate section from pointThe command calculates section from the first selected point and direction from thesecond selected point. After that the section from these points to optional point iscalculated. The point number displays, this can be overwritten by Save.288
Add-on modulesRoadlineAddons|RoadlineFunctionSave roadlineSectionsCalculate pointsSection/offsetSurface checkQuick profileDescriptionSaves the roadline from a polylineCreates sections along a roadlineCalculates co-ordinates from section/offset or a filecontaining section/offset values.Calculates the section and offset from co-ordinatesrelative to a roadline.Calculates the difference in level at specific pointsrelative to the road geometry.Calculates a terrain profile relating to one or moreterrain models.289
<strong>Topocad</strong>Road line editorAddon||Road line|Road line editorThe command starts either from the menu, or from the Roadline toolbar. Thecommand can be used to edit and create new road lines in drawings.The procedure is as follows:1. Create a new roadline by clicking the Create button.2. Point at the starting point of the roadline in the drawing.3. Edit current roadlines by first selecting Select roadline, then click at theroadline that is to be edited. The command window displays data for theselected point. The buttons Next and Previous are used to select next andprevious point in the roadline. Add forwards and Add backwards are used tocreate a new point before and after selected point.4. To add a new point, its position must be set by clicking in the drawing. TheRemove button removes selected point. Move let the user move selected pointby clicking in the drawing.5. Done finish the command.The selected roadlines all control points marks with a square in the drawing view.Selected control point marks with an x. Circles marks start and end point for eachline, circle and clothoid in the roadline.Information for selected point can be edited by re-writing new values and be saved,by clicking Back.290
Add-on modulesTo save roadline as .trl file, use the command File|Export|File and select file formatroadline (trl).291
<strong>Topocad</strong>Save roadlineThis command saves and converts a polyline to a roadline.Addons|Roadline|Save roadlineTo save a roadline:1. Create your line (roadline) using the appropriate commands. See also theRoadline current point toolbox.2. Note that if you have created a line with lots of small vectors you will need tojoin these together before you save the roadline.3. Select the line. Select Addons|Roadline|Save Roadline.TIP! You can use straight lines, radii and clothoids (spirals) in your roadline. If you are using clothoids you cannotjoin the elements together but you can still create the roadline by selecting the elements. It is not necessary toselect them in the correct order292
Add-on modulesRoadline - SectionsAddons|Roadline|SectionsThis command calculates sections along the road line. It is also possible to take theheights from a road profile if one has been selected. This feature is only available ifyou have the Longitudinal section module in <strong>Topocad</strong>. See Road line for moreinformation about the format of the roadline. You can also create lines for a fixedinterval and section information for another interval from the Section Marker tab.To calculate sections along the road line:1. Select the layer where you want the created sections to appear.2. Select Construct|Roadline|Sections.3. Select the roadline by clicking the Browse button.4. If necessary select the road profile by clicking the button in this row.5. Select the start and end sections from which you wish to calculate sections.Select the interval between sections.6. Specify whether the created points will use the default point code.7. Decide whether you want to use the point ID as the section. If so, tick the box.8. Click OK. The created sections will appear in the current layer.TIP! The thousand meter separator can be selected in File|Settings|Roadlines.TIP! The Point ID can be selected and displayed with the View|Point info command.293
<strong>Topocad</strong>TIP! Selecting a symbol with a defined attribute for the Point ID means that the section is placed around thatsymbol.294
Add-on modulesRoadline - calculate pointsAddons|Road line|Calculate pointsThe Roadline/Points command calculates co-ordinates from files containing sectionsand offsets (orthogonal points). The calculated points are then used in the drawing.To calculate co-ordinates from orthogonal points:1. Select or create the layer where you want the co-ordinates to appear.2. Select the command Roadline - Calculate points.3. Select the roadline by clicking the button ... If you have selected a roadlinepreviously this will be the default selection. You can find a previously loadedroadline in the Roadline Manager or load a new one. This will activate theRoadline. You can close it straightaway and it will remain activated.4. Click on OK.5. The Open dialogue box appears. Select the co-ordinate file (.PXY) in whichyou have saved sections and offsets.6. Click on OK. The co-ordinates are imported into the drawing.See alsoRoadline for more information about the format of the roadline.295
<strong>Topocad</strong>Road line - section/offsetAddons|Road line|Section/OffsetThis command calculates co-ordinates in the drawing or in a file for sections andoffsets. It is also possible to calculate heights from the road profile and even from theroad profile and the camber form. The last two commands are only available if youhave the Longitudinal Section Module in <strong>Topocad</strong>.To calculate the section/offset (heights/reduced by camber):1. Select Calculate section/offset.2. Select the roadline by clicking the button ... You can also select a road profile(.TRP) and calculate the heights from the road profile in that section. It is alsopossible to load the camber form (.TCF) and reduce or add the heights fromthe road profile with the current camber in the section.3. Select whether you want to calculate the objects in a file or drawing or just asingle point.4. Click OK.5. If you have selected objects from a file, the Open dialogue box will appear.Select the co-ordinates file you want to use to calculate the section/offset forthe selected road line. Click OK.6. The result appears in a co-ordinates file. You can now edit and save it.See alsoRoadline for more information about the format of the roadline.Surface check for a similar command using the comparison between the roadgeometry and measured points.296
Add-on modulesSurface checkAddons|Roadline|Surface checkThe function is similar to the Road line|Section/Offset function except that itcalculates the difference between measured and theoretical points and stores theresult in a text file. The result can also be printed out.The surface check can only be carried out if you have installed the <strong>Topocad</strong> Profile(Earthworks/design) section module.To create a surface check:1. Select the roadline and road profile and the camber form if applicable.2. If there is a height difference between the road profile and the measured levelit can be defined here. For example, this would be the case if the road profilewas created for the theoretical road but the measurement is carried outtowards the terrace.3. Select the upper and lower limits if applicable.4. You can then choose to calculate the points from the file or from the drawing.5. Specify whether you want the results to be saved in a text file. Printout is thedefault setting.297
<strong>Topocad</strong>Quick profileAddons|Roadline|Quick profileThis command creates a terrain profile from the selected line and a previouslycreated digital terrain model (DTM). The result is displayed in the profile form. Theprofile form (TPF) can be inserted into a drawing and then printed.DTMSelect the terrain model(s) you want to use to create a terrain profile.Draw line/ Select lineDraw or select a line at the position where you want the terrain profile to appear. Youcan either select an existing line or add a new line to the drawing.Create road profileIf the box is checked when you run the command, a road line profile (*.trp) will be created for eachcreated terrain profile.See also:Create DTMProfile formProfile form in drawing298
Add-on modulesOffset / Roadline stake outAddons|Roadline|Offset stake outOffset / Stake out for roadline. There are two ways to determine how to stake out theroadline.1. Using a fixed crossfall from a roadline.2. Using a designed or measured crossfall from a roadline, the road profile (height)and the road camber.If you choose the second method you need to enter a roadline, a profile and ideally acamber diagram.Decide on the start and end section and the point interval.Decide whether you want to create tangent points and midpoints on curves.299
<strong>Topocad</strong>The next step is to decide on the width and height for the points offset from the edgeof the road.300
Add-on modulesRoadline documentRoad line document (TRL)In the road line document do you input the road line. You can then import the roadline to the drawing document to be calculated from.Do like this to input a road line:1. Create a new Road line document. In File|New do you select Road linedocument (*.TRL).2. Input co-ordinates, eventual radius and parameters for clothoides.3. The road line is automatically generated and calculated.4. Save the road line. In File|Save or Save As...5. You can now import the road line to the document and use it for section,section/offset calculations.Explanations to the document:Point IdEven called element when in Road line. Not important for the road line.X- respectively Y- co-ordinatesThe co-ordinates in plane where you have an element.SectionThe section number. If you leave it empty Mapsuite+ will calculate the section foryou. You can also give ”wrong” section number and this will takeeffect on all sections after this section. You can also use negative section values.Radiusif it is a curve give the start radius here. Negative values for curves turning left.301
<strong>Topocad</strong>End radiusEnd radius for this element if it is such. When using parameters it is important to typein the end radius.ParameterEnter the parameter for the clothoide. The parameter is always positive even if it is aleft curve.CodeCode for the tangent point.BearingThe bearing is calculated from other data.End bearingThe end bearing is also calculated from other data.LengthThe length of the element is always calculated.Export from road lineIt is possible to export to other road line formats from the road line. The formatssupported are:• LIN Point road line format• GVL Geosis road line formatPreview of road lineThe tab shows current row in road line document marked by a circle in the preview.With possibilities to show all road line nodes.302
Add-on modules303
<strong>Topocad</strong>TunnelConstructTheoretical tunnelCalculated tunnel sectionAdd-on modulesFunctionCreate tunnel modelCreate tunnel sections.Theoretical tunnelsectionCalculated tunnelsectionDescriptionFunction to create tunnel terrain model.Function to draw tunnel sections in the drawing.How to create a TTU, a theoretic tunnel sectionHow to create the tunnel cross sections.304
Add-on modulesCreate tunnel terrain modelConstruct|Tunnel|Create tunnel modelAdd-ons module.The command is similar to create an ordinary terrain model but requires a little moreinput data. In this case the tunnel terrain model is calculated based on a road line, aroad profile and either a theoretical section or a radius. The road line and profileshould be in the tunnel and the tunnel walls should be calculated from thesemeasures.Road lineEnter the road line in the tunnel.Profile:Enter road profile for the tunnel.Section/RadiusEnter either a theoretical section for the tunnel or a radius that has a radius similar tothe tunnel. The closer the theoretical section or radius are to the tunnel walls thebetter the end result will be.305
<strong>Topocad</strong>Create tunnel sectionsConstruct|Tunnel|Create tunnel sectionsTunnel sections are created in a similar way as sections in the drawing. Thecommand takes the calculated tunnel sections (TTS) and places them in the drawing.For more information see Create sections in drawing.306
Add-on modulesTheoretical tunnel sectionTheoretical tunnel section (TTU)The tunnel section is used to create the tunnel digital terrain model and to calculatethe cross-sections of the tunnel.For optimum digital terrain modelling it is important not to have sharp edges. It shouldbe possible to interpolate all measured points onto this tunnel section.The tunnel section is created using lines and arcs relative to the roadline and profile.307
<strong>Topocad</strong>The commands used are Add point and Edit point. You can also delete points. Whenyou open a new tunnel section it will look like a tunnel. You can either delete allpoints and start again or edit existing points.The tunnel section is built up from left to right.308
Add-on modulesCalculated tunnel sectionCalculated tunnel section (TTC)This command is similar to that used for calculating cross sections.When a new calculated tunnel section is created the global settings are displayed.Enter the tunnel DTM. The other figures will be automatically inserted. These can bechanged if required.To create the tunnel sections, select Tunnel|Create sections.Enter the start and end sections and the required interval between them. Furthersections can be created as required. To create only one section, enter the same startand end sections (or a larger interval than the distance between the start and endsections).The sections are created. The sections can be edited by selecting Tunnel|Edit point.Points can be added using Tunnel|Add point and deleted using Tunnel|Delete point.The volumes and areas are automatically recalculated when the tunnel cross sectionis edited.309
<strong>Topocad</strong>Sections can be deleted using Tunnel|Delete sections.The volume report is displayed by selecting Tunnel|Show report.Several different toolboxes can be displayed in this window:Sections - Shows all created sections. You can select a section to display from here.Areas - Shows all areas in the tunnel section.The above toolboxes can be shown or hidden using View|Tool box.Other toolbars available are:Select point - Use left and right (far left and far right) arrows to select any point in thetunnel section.Select section - Use up and down (top and bottom) arrows to select one section at atime.These toolbars are displayed on the Settings|System settings|Toolbars tab.The section may look like this:310
Add-on modules311
DesignProfileProfile formSection templateCalculated sectionsConstructFunctionRoadlineRoad profileRoad profile -Import/exportProfile formCamberSection templateCalculated sectionsPrint volumesProfile form - insertinginto drawingSections - inserting intodrawingDescriptionThe roadline document.The road profile document.Import to and export from a road profile.Create and work with the profile formThe camber diagramHow to create a section templateHow to create terrain and theoretical sections.Insert the profile form into the drawing to be printed out.Insert cross sections into the drawing to be printed out.313
<strong>Topocad</strong>Road profileProfile TRPYou enter the complete profile for your roadline in the road profile document It is usedto place the sections at the correct height.To enter a profile:1. Create a new profile document. Go to File|New and select Profile file (*.trp).2. Enter the element number, section, heights and any radius.3. The profile is automatically calculated. Note that it is possible to adjust theprofile by going to Profile|Adjust profile.4. Save the profile under any name.5. It is now possible to use it for calculations.Explanations for the document:Point IDThis can be any number. It may also be called an Element no.SectionThe section. It is important that the section is correct compared to the one used in theappropriate roadline.HeightEnter the height for the section.314
DesignRadiusAny radius for this point ID. A negative value for the radius means that the centrepoint is below the radius. Think of it this way - A sad face (radius) means a negativevalue and a happy face (radius) is a positive value.Start bearingThe start bearing is calculated based on the data entered.End bearingThe end bearing is calculated based on the data entered.LengthThe length of the element. This is always calculated based on the data entered.You can enter an element (section, point ID) into a profile by going to Edit|Add row orby using the Insert shortcut key. To delete a row, either go to Edit|Delete row or usethe Ctrl + Delete shortcut key.Adjust profileThe profile can be adjusted and possible errors can be corrected, however, thegeometry will not be changed when adjusting.Control profileControl of profile gives a report regarding errors in bearing between differentelements, if elements are too short or too long (discontinuity)Length tableThe length table can be connected to the profile (if you have the railway module)which gives reports so the sections will follow this length table.Import of road profile<strong>Topocad</strong> reads lots of different file format to import road profiles. File formats that canbe imported are PRF files from Point/Geo, DPL files from the DRD of the SwedishRoad Administration, LandXML and a general import of text files. Read more atCommunication - Import files.Export of road profileA profile can be exported by marking the road profile in text form, copy (use rightclick) and from here paste, to for example MS Excel. It is also possible to export theprofile to the PRF format used in Geo and partly Point and to LandXML. You are ableto export a profile directly to most of the instruments and field computers.Preview in profile document315
<strong>Topocad</strong>You find the tab for preview of profile directly in the profile document. The current rowin the profile document is marked with a circle in the preview.There are settings for height scale and possibilities to show all profile nodes.316
DesignRoad profile - import/exportRoad profile - import/exportThe road profile can be exported to certain instruments with a roadline. It can beimported to and exported from various formats.For more information about communication with instruments, refer to Roadline -Export to instrument.To export the road profile, select File|Export|File and select the file format.The following file formats are supported:• Export and import: prf profile line in point and GEO• Import: drd profile file .dpl.• General import of road profile data.See alsoRoad profile.317
<strong>Topocad</strong>Profile formProfile formFunction, commandForm settingsDescriptionProfile form general settingsLines and text settings in the gridAvailable components to add to the profile form.Lines and textsComponents- Profile line The component Profile line- Components Different components in the form- Profile height The component Profile height- Minimum/ maximumThe component shows height and section for aprofile's height and low pointsheight- Road geometry Road geometry- Length, Section interval The section measurement / length measurementare used to indicate sections of any given interval- Terrain profile How to create a Terrain profile- Crossfall Crossfall from a camber diagram- Area component Area component in profile formInterpret road profileHow to draw a road profileSlope/RadiusThe component Slope/RadiusUser definedUser defined blocks in the profile formMultiple profiles and profile Work with multiple profiles and profile sketchessketchesExplode profileOption to import available profile and then explodethis to get the points.Component groupThis command gives you the opportunity to groupcomponents and to create a headline, horizontal,to these components.In the Profile form, you enter not only the components but also the form itself, whicheverything else is based on. Like everything else, this form can be edited later orwhile working on the profile form.The form dialogue box contains four tabs. The first two, Size & Scale and Lines &Text, are used to adjust the appearance of the form, while the other two tabs,Components and Details, relate to the items involved in the profile form. There aredefault sizes for the profile, but it is better to always change these first to suit yourown requirements.Form settingsThe settings that can be made in Tab 1, Size & Scale, are as follows:318
DesignScale:Vertical and horizontal scale. The relationship between these two settings alsodetermines the relationship between the height and length of the profile. You canenter any values. This scale will be the default when you come to insert this profileform into a <strong>Topocad</strong> drawing. The default scales are: Vertical 1:1000, Horizontal1:200Form size:The start and end section and the minimum and maximum heights are entered here.If you do not know the lengths and heights, you can guess at a value, ideally a highone.Lines and textsThe settings that can be made in Tab 2, Lines & Text, are as follows:319
<strong>Topocad</strong>Horizontal grid:Enter the side offset from the frame to the grid and the interval between grid lines.The size is given as the size of the printout.Vertical grid:The vertical interval between the grid lines is entered here. You can choose any unitfor the size.Grid:Enter the colour for the grid. This colour will also be used when the profile form isimported to a <strong>Topocad</strong> drawing.Text:Enter the font style, the text height and the colour in which you want the text toappear in the profile form, in this case the form itself.Height markers:Enter the size (width) for the height markers. These height markers are displayed onboth the left and right-hand side of the profile form.Profile form, componentsThe dialogue box contains two columns - the left-hand column shows availablecomponents and the right-hand column installed components. This is similar to theone used for survey data settings and text edit settings.Data contained in profile form:320• Road profile• Profile height• Terrain profile• Slope/Radius
Design• Length• Tangent points• Road geometry• Cross slope• User definedYou can add components you require by clicking on the header to the left and thenclicking Add; alternatively you can double click. Note that the header/label remains onthe left-hand side because it is possible to use several components of the same kindin the profile form. For example, is it possible to have several terrain profiles/sectionsfor different roadlines or for different digital terrain models.The order in which the components appear in the right-hand column is the order inthe profile form.Details, profile lineThe road profile is displayed in the profile form by adding it on the Components tab.On the Details tab, click on Road profile and select the desired road profile. Alsoselect the colour and line type for the road profile.The road profile will be displayed in the upper section of the profile form. If the profileform is not of sufficient length or height, the profile will not be displayed outside theform. This can easily be corrected by using the Size & Scale tab to enlarge the form.It is possible to display several different road profiles in the form.Component to compare profiles in profile formThe component compares two profiles and presents the differences either graphic orwith numbers with even intervals. A profile can either be represented by a profile file,321
<strong>Topocad</strong>or by a combination between a road line or a terrain model file. Select how the twoprofiles shall be represented in the two combo boxes to the right.Negate: Changes plus to minus. If the box is unchecked, the result is the first profileminus the second profile. If the box is checked, the result is the second profile minusthe first profile. The first profile is the one on top in the dialogue, the second is thelower in the dialogue.Details, terrain profileThe component Terrain heights adds the height of the selected terrain model alongthe road line with even intervals.322
DesignThe terrain section is created by using a roadline and a digital terrain model. Theheights at which the roadline crosses the triangles in the digital terrain model will beused for the terrain section. The data required is a calculated roadline and a digitalterrain model.RoadlineLoad the roadline to be used for the terrain section. The roadline has the extension.trl (<strong>Topocad</strong> roadline). The roadline must cross the digital terrain model to be used atsome point.Digital Terrain Model, DTMLoad the digital terrain model to be used for the terrain section.ColourEnter the colour for the terrain section.Line typeEnter the line type for the terrain section.Profile heightThe profile height can be displayed and calculated at any interval along the roadline.This interval can actually be specified as the actual value in meters or in any otherpaper units.Settings, heightEnter the height at which the block for the profile height is to be displayed. The unitcan be m, cm or mm.Settings, header/labelEnter the label to be used for this block. The default is the profile height, but it canalso be the section height, road profile height etc.Road profileSelect the required Road Profile, the extension is .trp.IntervalEnter the interval as an actual value or in paper units.Minimum/Maximum height323
<strong>Topocad</strong>The component minimum and maximum height in profile form displays height andsection for a profile's height and low points. Tick the box for Show localminima/maxima (default) to view all height and low points. If the box is not ticked onlythe highest and lowest point will be viewed. The component does not display heightand low points from terrain models.Tangent pointsTangent points specify the tangent points for the radius and other elements in theroad profile.Enter the road profile; the tangent points for this road profile will then be calculatedand displayed in the upper section of the profile form.Slope/Radius324
DesignThis component displays the slopes and radius in the lower section of the profileform. Slopes can be specified in percent or in per mill. This selection is made underFile|Settings|Roadline.Enter the height and label for this block and select the road profile to be displayed inthe block. Several road profiles can be used in the same profile form and, in turn,several slope/radius blocks for different road profiles.Length/sectionThe section measurement / length measurement are used to indicate sections of anygiven interval. The length can be specified in paper units or as the actual length.You should also enter the height for the block and the label. You can use any label.Crossfall325
<strong>Topocad</strong>The crossfall is loaded from a Camber diagram and can be displayed in severaldifferent ways.Numbers in crossfalls (*.tcf) are interpreted as per cent. Writing 2 becomes 2 %.Settings, heightEnter the height for the block.Settings, label (header)Enter the label for the block - this can be Crossfall (default), Cross slope, Crosssection slope, Camber etc.CrossfallLoad the crossfall document, extension .tcf. If it has not yet been created, go toFile|New, select Crossfall and create the crossfall.IntervalEnter the height interval at which the block will be divided. The default is 2.5% butyou can choose any other value. It depends on the type of road and the slopes used.ScaleEnter the scale to be used. The default is 2.5% = 0.5 cm. If the height is selected as2 cm (default), this will enable you to have a maximum crossfall of 5% withoutexceeding the block limits. The distance is in paper units.Colour and line typeEnter the colour and line type for the right and left side of the road. It is good to selectdifferent colours or line types to enable you to differentiate them in the profile form.Area componentThe area component is a component to the profile form for calculation of areasbetween profiles.326
DesignTwo profiles must be selected to calculate the area. In this case the profile can beeither a profile (*.trp) or a Terrain profile created from a roadline (*.trl) together with aterrain model (*.dtm). Each intersection between the profiles is presented in the formwith a vertical line together with its section. The area between two intersections iswritten between the two intersections. If the first profile is positioned above thesecond, the area gets a positive value, otherwise a negative. The sums of all thepositive and negative areas are presented to the left in the profile form.Example of a profile form with an area component inserted.Road geometryThis component is used to display the tangent points for the roadline. It displays thepoints between elements (straight lines, radius and clothoids) in the road.Enter the height for this block and selected the desired calculated roadline, extension.trl. You should also enter the label for the block - this could be Road geometry,Roadline data, Plane data etc.User defined327
<strong>Topocad</strong>It is possible to enter user defined blocks in the profile form. You can select theheight and label for the block. The block is then displayed in the profile form drawingand you can use it to enter any type of data.Interpret road profileIt is very easy to interpret a road profile direct from the profile form. Start by creatingthe terrain section, so you have something to check.The different commands available under Interpret profile are:Add points before/after current pointIndicates the direction in which points are added in the road profile. You can createthe profile from any direction or from the middle. The setting is also indicated by the+/- icons in the menu. Compare with section template/cross sections.Add pointsAdd points in the direction displayed above.Edit pointEnables you to edit any tangent point in the road profile.Delete pointDeletes the selected tangent point.Select pointYou can select a tangent point using the left/right arrows in the menu or by clickingon the point using the icon to the right of the arrows in the menu.Save profileOpens the calculated road profile document, which you can then edit in text modeand/or save.Set radiusThe button Set radius let the user set the radius for selected point. Select a point,click Set radius, and by moving the mouse in the profile form you draw a radius fromthe selected point. Click again to finish.Create transition curves / spirals in profileIt is possible to select transition curves, spirals, in the profile. By selectingConstruct|Left spiral respectively Right spiral, this is made graphical. Then the spiraland its tangent points appears. Observe that the command is sensitive. After thespirals have been added, they can be edited. It is also possible to edit the radiusafterwards, which then edits the detailed spirals at the same time.328
DesignSpirals can also be selected directly in the profile.Read more in Road profileView|Current Point toolboxShows the section, height, radius and slope for the current point. To the right is acolumn in which you can select and lock any of the above fields for the specific Point.This box is similar to the one used in Roadline - Current Point. This box is vital forediting the road profile.Lock height: If lock height is selected the point's height cannot be changed in anyway except by selecting a value in the dialogue, when the point is selected. If theheight is unlocked it changes depending on how the user changes contiguous points.Lock left slope / Lock right slope: Locks the slope on the right or left side of thepoint. Then the user can edit the value for the slope. A locked slope can only bechanged by selecting a new value in the dialogue.To unlock a height or a slope just click the checkbox.The procedure is as follows:1. Go to Construct|Add points.2. You can now click on the positions in the profile form at which you want toplace your tangent points. Note that the tangent points are inserted even for aradius - the tangent point for any radius is in the fillet of the two slopes that areinvolved in the radius.3. The simplest method is to click on the approximate point where you want toplace the points and then change the position in the "Current Point" toolbox.As soon as you input a radius at the point, it will be calculated and displayed.The new tangent points will be calculated with no bearing difference.4. When you are satisfied with your road profile go to Construct|Save profile. Theroad profile document is displayed and you can save the profile.Multiple profiles and profile sketchesYou can interpret and work with several profiles at the same time. See View|ListCalculated profiles.The checkbox decides if the profile displays or not.329
<strong>Topocad</strong>Add creates an empty profile in the profile form.Remove removes selected profile. It is not possible to remove all profiles, as theprofile must contain at least one editable profile.Add from component is useful if a profile has been added as a component. Clickthe button Add from component, click on a profile in the profile form. Now the profilehas been editable and added to the list.Properties Select properties to rename a profile.Explode profileWhen you have added a profile line to the profile form you can explode this profile byclicking on the command "Add from component" and then click on the profile youwant to explode. You will then have a sketch image with points of that profile.To add the profile to the drawing read more at Drawing|ProfileformComponent group330
DesignThe components can be grouped. This will give a headline to the component, to theleft in the profile form. To group the components select Form - Settings -Components. Add components and click on the button Set group.Select between the components in Available components. Components belonging tothe same group is placed next to another in profile form and have the same heading.The button Set group opens a dialogue with a list containing all groups that arecreated in current profile form. The dialogue also contains three buttons for createnew, edit and delete group.To create a group: Add a component to the group, select the component in the list,click on "Set group" and then choose group.Each group has a name and a width. The name becomes the heading that can beviewed in the form and the width is for the horizontal spreading for the heading box.Ungroup - select a component and click the button Ungroup to remove a componentfrom a group.See also:Roadline documentRoad profileCreate DTMQuick profile331
<strong>Topocad</strong>Create camber diagramCamber diagram|ConstructThe crossfall log is used in both the profile form and the cross section construction. Ithas a .tcf (<strong>Topocad</strong> camber form) extension. The sections can also be createddirectly from the volume calculation sections but this will not create a .tcf file.The procedure is as follows:1. Go to File|New and select Camber diagram.2. Go to Camber|Create3. Load the calculated roadline for which you want to calculate the camber andcrossfall.4. Enter the start and end sections for the crossfall log.5. Enter the crossfall you want to use for the camber (straight roadline) and forthe cross slope/crossfall (radius/curves).6. Enter the required distance for the change from camber to crossfall.7. Click OK.8. The crossfall log will now be created. It is now possible to edit sections,crossfalls etc. and to add new sections. Note that if the radii are very close toeach other you will need to edit the log. In theory it is not possible to calculateif the radii are too close to each other.9. Save the crossfall.332
DesignSection template - TSTSection template - TSTFunction, commandView toolboxGeneralSection properties- Relative- Slope- FilletAdd layerEdit outer slopeEditSide linesWord listDescriptionGeneralWhen you create a new cross section/section template or change an existing cross section you add an elementby going to Construct and clicking on the type of element you want to add or by clicking on the icon for thiselement in the toolbox. If you click on the wrong element is it easy to change the type of element from thedialogue box.In this dialogue box you enter the values you want to assign to this element. For example, it can be a slope withgiven distances, fixed distances, extend etc. It is possible to add an element in both directions regardless ofwhich side of the section you are on. This is indicated by the toolbox direction and also appears in Construct|Addto left or Construct|Add to right. For example, if you want to add an element belonging to an element outside it,select the direction towards the centre point. (Left if you are on the right side of the section and vice versa.)You always edit a point and the path to that point. When adding an element, this element is created with itsdefault values and you then change its default values to suit your requirements. You cannot delete points that anyother points have a relation to.The section normally starts from the centre of the roadline and runs towards the edges but some of the points inthe section can be fixed points even if they are not in the centre. For example, the road profile can be offset fromthe centre - this is often the case for highways.Click Ctrl+z for Undo and Ctrl+y for Redo.The different properties for a section element are:• Fixed• Slope• Extend• Intersection• Relative• Fillet333
<strong>Topocad</strong>View toolboxThe section template document and the section document have four and five special toolboxes respectively -these do not appear in the standard <strong>Topocad</strong>. They are unique to the section and should preferably be used all atthe same time. However, it is possible to only use the menu rather than the toolboxes.DirectionIndicates the direction in which you add an element in the section. You will also find it in Construct|Add to left andConstruct|Add to right.Step/SelectThe icon shows four different arrows - the two outer arrows move to the extreme left and right elements and theother two arrows move one element at a time. These commands also appear under Select in the menu.ConstructThis box contains five or six different ways to add an element in a section template (fixed, slope, intersection,extend, relative and camber) as well as delete, show outer slopes and finally mirror turnover.These are also available under Construct in the menu.Point infoShows the information for that element (point) in the section template and in the cross section. This box is alsoused to edit the point.In a calculated section document only:Select sectionThis box only appears in cross sections (.tcs) and you can move between the sections by clicking the up or downarrow or move to the first or last sections by clicking on the double arrows. This command also appears underSelect in the menu.Current sectionFrom this list you can point at any section from the cross section calculation. The list contains all calculatedsections.AreaShows the calculated area of the section. The areas are divided into Soil, Rock, Fill and Superstructure.Wordlist/ExplanationsFrequently occurring words in dialogue boxes:CodeA point code can be entered to simplify control and stake out.Directions:SlopeSlope can be expressed in percent (%), in per mill (‰) or as a fraction (01:03) andcan be expressed using negative values.334
DesignCrossfallCrossfall is the slope across the road section and the term crossfall is a combinationof both camber and cross slope.CamberThe camber is calculated from the plane data for the road. In the dialogue boxes youcan enter camber left or camber right.Horizontal distances:AbsoluteAbsolute horizontal distance measured from the centre.HorizontalHorizontal distance from last point.Slope distanceSlope distance from last point.Vertical distances:AbsoluteAbsolute distance in height. This is the absolute height in the co-ordinate system.RelativeRelative distance in height from last point. Note that the last point may be a pointfurther to the outside if the set direction is towards the centre.Relative profileRelative height from the height of the profile in this section.Vertical distances can be negative!Construct - Section propertiesFixedEnter a vertical and horizontal distance and select whether you want these distancesto be calculated from the last point, from the centre point or whether they areabsolute distances. (Offsets/Heights)Example 1:You want to add an element for inner slope towards the ditch. You know that thisshould be three metres from the outer edge of the road and one metre lower in termsof the vertical distance.335
<strong>Topocad</strong>The procedure is as follows:1. First click on the point that indicates the outer edge of the road.2. Click on Construct|Fixed in the menu or click on the corresponding icon in thetoolbox.3. Enter 3.0 metres relative as the horizontal distance (indicated by arrows) and1.0 metres relative as the vertical distance, also indicated by arrows.Example 2:You have a highway with an inner area that has a width of 4.0 m. The profile is fixedon a point 0.75 m from the edge of the road. This is 3.0 m from the centre assuminga 0.25 m prop strip. This is the same example used as example 2 for Slope andExtend.The procedure is as follows:1. Add a point from the centre line using the Construct|Fixed command in themenu (or use the toolbox).2. Enter 3.0 metres absolute as the horizontal distance (indicated by arrows)and 0.0 metres relative profile as the vertical distance, also indicated byarrows.SlopeApart from the code, three different items can be entered here. First of all, the valueof the slope is entered. It can be expressed in percent, per mill or as a fraction.Positive values indicate an element that points upwards and thus has a higher pointat the end than at the beginning, and vice versa. The slope can also be specified bythe camber, which is calculated from the plane data for the road.You can also enter the limits for the vertical and horizontal distances. These can berelative to the last point, the profile (in height/vertical), the centre (in plane/horizontal)or an absolute height. Note that it is the slope that is fixed and the horizontal andvertical distance that is the shortest compared to the slope limits the length of theelement.Example:You want to use an inner slope from the outer edge of the road towards the ditch witha slope of 1:3 and the horizontal distance will be 3.0 metres from the edge of theroad.336
DesignThe procedure is as follows:1. Click on the point that indicates the outer edge of the road.2. If there are no elements outside this element, add the element by going to themenu and clicking on Construct|Slope or using the toolbox. If there is anexisting element that you want to correct, click directly on this element.3. Enter the slope of -01:03. (Or -33%)4. Enter the horizontal distance of 3.00 relative (relative to the last point). Thevertical distance has no effect in this case so we only have to ensure that it issufficiently high that it does not limit the element.Example 2:Extend from Example 2 from last page. Enter the road that ends at the outer edge ofthe road element. The road uses a camber and crossfall. The road is 7.0 metreswide. Note that last point is already 0.75 into the road. (The profile is at this point.)The procedure is as follows:1. Click on the point that indicates the profile point.2. If there is no element outside this element, you can add an element by goingto Construct|Slope in the menu or by using the toolbox. Note that the directionwill point outwards from the centre line. If you already have an element youwant to change, click on it first.3. Enter that the slope will be camber (right or left).4. Enter a horizontal distance of 6.25 relative (compared to the last point). Thevertical distance has no effect in this case so we only have to ensure that it issufficiently high that it does not limit the element.ExtendThe Extend command extends the previous element direction by the specifiedhorizontal and vertical length. As usual, these lengths can be expressed as absolutedistance, distance relative to previous point or slope distance. The height can also berelative to the profile.Extend is usually used for prop strips.Example 1:We will extend our road using a prop strip with a width of 0.25 m.The procedure is as follows:337
<strong>Topocad</strong>1. Click on the edge of the road.2. If there is no element outside this element, add an element by clicking onConstruct|Extend or by using the Extend icon in the toolbox. If you have anexisting element for the prop strip, click on this instead.3. Enter the horizontal length of 0.25 relative to the last point (edge of road).Make sure that the vertical length exceeds any intersection. (If the camber is3% and the prop strip is 0.25 m you have to have at least 0.03 x 0.25 = 0.0075m vertical length).Example 2:Example combined with example 2 for Fixed and Slope. Enter the inner edge of theroad, which is 0.75 m from the profile and has the same slope as the road itself,which is the same as the camber.The procedure is as follows:1. Click on the profile.2. If there is no element inside the profile, add an element by going toConstruct|Extend in the menu or by using the toolbox. Note that in this casethe direction will be towards the centre of the road. If you already have anelement at this point, click on this instead.3. Enter the horizontal distance of 0.75 relative to the last point (profile). Correctso that the vertical distance exceeds any intersection. (0.75 m x camber 3% =0.0225 m)IntersectionThe Intersection command is used when a point does not have a fixed position and isdetermined by two slopes running towards it. The required data is the two slopestowards the point.RelativeRelative is used primarily to determine the superstructure thickness. You determine arelative value for the horizontal or vertical distance and click on the object you want torelate it to.338
DesignExample:The superstructure thickness for Fill will be 0.7 m below the road, parallel to the road.The procedure is as follows:Fillet1. Click on the superstructure line for Fill, which is the blue line.2. If there is no element outside this element, add an Extend element by clickingon Construct|Relative or by using the relative icon in the toolbox. If you havean existing element for the superstructure, click on this instead.3. Enter the vertical height (indicated by up and down arrows) of 0.70. As thehorizontal length has no influence enter a value = 0 m.4. Click on Select point.5. Click on the point in the road towards which you want to have a parallelthickness of 0.7 m. This is normally required for two points on each side for a(normal) road - in the centre of the road and at the outer edge (or under theprop strip). For a highway with an inner strip or ditch, it will probably benecessary to click on several points. However, it is disadvantageous to clickon several points below the road using the relative distance.Fillet is the command that is used for the point at which the superstructure intersectswith the inner slope. You enter the kind of slope (normally extend) and then click onthe element with which the superstructure will intersect.Superstructure colours:Rock has a red line, Soil has a green line and Fill has a blue line.Example:You have constructed a superstructure for Fill with a thickness of 0.7 m and you havereached a point below the outer prop strip. You now want to extend this line tointersect with the inner slope.The procedure is as follows:1. Click on the superstructure for Fill, which is the blue line. Click on the pointthat is below the outer prop strip.2. Is there is no element outside this element, add a Fillet element by clicking onConstruct|Extend or by using the Fillet icon in the toolbox. Note that thedirection will be outwards from the centre line.3. Click on the Extend box.4. Click on the Select layer box.339
<strong>Topocad</strong>5. Click on the element you want to intersect with, i.e the road, with the black lineon the top. It does not matter which position along this line you click on.Modify section templateThe section template can be edited in various ways and several of these commandsare actually in the Construct menu. The Modify menu contains commands fordeleting points in the section (also available in the toolbox) and for editing outerslopes.Edit outer slopeThe Edit outer slope command edits the rock, soil and fill slopes on the left and righthandsides. A rock shelf can also be entered. Every outer slope can contain severalpoints and to separate the theoretical layer and the terrace in the outer slopes.The default settings are:• Rock intersection: 05:01 Red• Soil intersection: 01:03 Green• Fill intersection: 01:03 Blue• Rock, shelf: 1 m RedA complete section template shall have outer slopes defined for rock, soil and fill onboth the right and left side. Which outer slope used for a side in a section calculationis determined by the place of the slope edge. In this case, slope edge is the end pointon the theoretical layer. If the slope edge is placed under the rock model but, the rockslope is used. If the slope edge is placed under the soil model (but above the rockmodel), the soil slope is used and in remaining cases the fill slope is used. If a rockmodel is not used the soil slope is used for everything under the fill.Define outer slopeTo define an outer slope you have to select which slope you want to start with. As a340
Designsuggestion; start with the outer slopes in the theoretical layer. To define for examplethe theoretical layer for left rock click on "Left rock" and "Theoretical".InsertAdds a new point inside selected point.AddUseable if the outer slope is selected. Adds a new point at the very end of the slope.DeleteDeletes selected point.Previous and NextTo move between the points on the outer slope, use the Previous and Next buttons.Next selects adjacent point, situated furthest from the middle, while Previous selectsadjacent point closer to the middle. It is also possible to select a point by clicking on itin the view. Selected point is marked with an x and data for current and Next point isdisplayed in the dialogue.The points on an outer slope can be divided up in three types: Relative,Connect and FollowRelativeA Relative point means that the next point will have a place relative to another point.Which point this will be shall be written in the field "Rel. Id". This value can be written,and also added by clicking at Pick and then at the point in the view. If "Rel. Id" is -1,which is the default value, the position is stated in relation to current point.ConnectA point of the type "Connect" connects to either rock, soil or theoretical with certainslope. Only points in the terrace can be connected to the theoretical layer. It ispossible to state a maximum length. If no connection is found within the maximumlength, the next point will be placed on the stated distance from the current point. Themaximum length states the distance in a sideways direction. The format is preparedto enable adding a maximum length in both sideways and diagonal and also asheight different from terrain model or theoretical layer.FollowFollow points follows a terrain model. A point of the type Follow must be followed bya point that connects to the terrain model, or after another Follow point.ShelfShelf sets how far a terrain model shall be followed.Offset valueTo the upper right in the dialogue you can set an offset value for the staring point onselected outer slope. Offset values can only be set for outer slopes in the terracelayer.341
<strong>Topocad</strong>Edit side linesModify|Edit side linesThis command enters side lines and any names they have. If you are using side linesin your section template, you also need to have side lines (created as .trl lines) in thecalculated cross section. However, it is an excellent way to control the sections.Add layerTST|Construct|Add layerTST|Modify|Modify layerIn <strong>Topocad</strong> is it possible to work with any number of layers in the superstructure.These layers have to be under the theoretical road and above the terrace. All ofthese layers can be displayed in area and volume calculations. Areas and volumes inthese layers are not subtracted from the total superstructure area and volume. Thelayers such as asphalt should not be on the same line as the theoretical road.This command is available in both the section template and in calculated crosssections.See alsoFor details of how to display sections in a drawing, refer to Construct|Section .342
DesignCross section calculationFunction, commandConstruct- Create sectionsDescriptionConstruct menuTCS|Calculated sections- Delete section Delete selected sections.- Substitute sections Creates new sections with this new sectiontemplate.- Recalculate/update Select any sections and recalculated with anyvalues.- Create lines in plan Create 3D lines from a cross section in a planedrawing.- Create multiple lines Create all lines in the section to a plan drawing atthe same time.- Create slope edge Insert the outermost lines from the section intothe drawing in 3D.- Create sections in drawing Make a new DTM of the theoretical road.- Create DTM from sections Creates a DTM directly from cross sections.Modify menu- Edit/Interpolate Edit multiple cross sections at the same time, editcross sections and edit section templates.- Delete point in cross section- Edit layers Edit the layers in the cross sections- Edit side lines Specify side lines in calculated sections.- Edit outer slopes Edit different slopes for rock, soil and fill.- View in sections View toolboxes and parts of the section.- Modify section Edit sections, points and layers.- Recalculate section Recalculate and update sections with anyvalues.ConstructConstruct menu has the options for creating sections but also different commands foroutput and editing.Create sections343
<strong>Topocad</strong>Start sectionThe default value is the start of the roadline. If you want to use something else, enterit here.End sectionThe default value is the section after the end of the roadline. If you want to usesomething else, enter it here. Make sure that the start and end sections are inside thelength of both the road profile and the roadline.IntervalEnter the interval at which you want to create sections.Select between creating sections at the tangent points from the roadline, profile,crossfall or cant.Tolerance in plane and heightIf at least one tolerance is set, extra sections may be created to make sure the resultstays within the tolerance. Only the theoretical layer is controlled. Outer slopes canonly be controlled towards the height tolerance. If no tolerance is set, no control ismade and no sections will be created.344
DesignSuperelevation runoffThis creates the crossfall, camber and superelevation based on the roadline used inthe calculation. You need to enter the superelevation length for the road curves andthe slope that the road will have in curves and straight lines. If the camber documentis selected in the global options, the superelevation runoff is already made so thisoption is not default selected. See camber.When the cross sections are calculated, the areas for each section are alsocalculated. These will appear in the cross section document (.tcs).To create cross sections:1. Activate the Construct|Create Cross Sections command.2. If it is a road that you are going to calculate you will need the crossfalldocument or to create it first. If you have previously created the crossfalldocument, enter it now. If not, enter the settings for superelevation runoff,length and camber in the dialogue box.3. Click OK. The cross sections that are involved in the superelevation runoff andcrossfall are created. You can now modify them if required. The next sectionswill be interpreted using these settings.4. Go back to Create sections. This time, you create the sections with theinterval. This will also be the default selection. Enter any interval for thecalculation.To calculate cross sections, certain data is required that is stored underSettings|Global settings and also appears in a dialogue that is automatically activatedwhen we click Create sections.The settings that are stored in Settings|Global settings are as follows:Centre line/RoadlineA roadline is required to create sections.345
<strong>Topocad</strong>Soil model:At least one of the soil or rock model must be in the creation of sections.If h>Max fill, the top soil is not removed.Removal of top soil / Max fillThis is where the thickness of the top soil removal is filled in. Max fill is the maximumdepth at the road centre. If the maximum depth exceeds this value, the top soil willnot be calculated for this section.If the theoretical layer's outer point on one side is above ground, the removal of thesoil on this side will start with maximum depth at the outer point of the terrace.If the theoretical layer outer point on one side is below ground, the removal of the soilon this side will follow the terrace to the outer point on the theoretical layer, or untilthe terrace is under the chosen depth for soil removal. Afterwards the soil continueson chosen depth.ProfileA profile is only needed if you are using a section template.Soil DTMAt least one soil or rock DTM must exist to create cross sections.Rock DTMSee above. A unit height can be specified for to a calculation of rock above andbelow this height compared with the surface DTM.Section templateIf you only are going to create terrain cross sections you do not have to use a sectiontemplate.346
DesignThe above dialogue also appears if anything is missing when you want to create thesections. If the data is all stored correctly, the following items will appear in adialogue box:Delete sectionsDelete selected sections.Substitute sectionsCreates new sections with this new section template. Note that it will not be possibleto interpolate between different sections using different section templates.Recalculate/updateThis function allows any sections to be selected and recalculated with any values.For example, if a digital terrain model has been changed, you can recalculate thesections where the DTM has been changed and you can choose to only recalculatethose sections and the specific part that actually needs to be recalculated. All definedvalues for the section will be stored even if you have made manual changes to thesection.347
<strong>Topocad</strong>Create lines in planFrom the cross sections it is simple and fast to create 3D lines in a plane drawing.You can either create them in an existing, currently open drawing or a new drawing.There are five different ways to display the cross sections in a plan drawing or aDTM:• Create lines in plan one by one• Create multiple lines• Create line for the outer slopes edge• Create cross sections in a plan view• Create a DTM348
DesignDialogue explanation:From section:Select the section from which you want to create plane data from the drop-down list.To section:Select the end cross section, up to which the plane data should be created.Store in:Select the drawing in which you want the plane data to be stored. You can select anexisting, opened drawing, a drawing you have previously created and saved or a newdrawing.Layer:Select the layer - enter an existing layer name or a new one.The procedure is as follows:1. Click on the point you want to create in the plane drawing.2. Go to the Construct|Create Line command in the drawing.3. Select the start and end sections to be created.4. Select the drawing and layer in which you want the line to be placed.5. Click OK.6. Repeat for the next point/line.Create multiple linesThis command is similar as the above one but you can create all lines in the sectionto a plan drawing at the same time. The figure shows your cross section, click oneach point and decide which layer the line shall end up in.Create slope edgeConstruct|Create slope edge349
<strong>Topocad</strong>This command inserts the outermost lines from the section into the drawing in 3D.You can select the drawing and layer in which you want to create the edges.Create sections in drawingConstruct|Create sections in drawingIt is also possible to create calculated sections in a drawing. This is the mostconvenient way to make a new DTM of the theoretical road.You can select the drawing and layer in which you want to create the sections.350
DesignCreate DTM from sectionsConstruct|Create DTM from sectionCreates a DTM directly from cross sections.Decide if you want to create a theoretical finished upper surface or the terrace.Modify menuEdit/InterpolateThis function enables you to edit multiple cross sections at the same time. This canbe useful if you want to make the same change to the cross sections or if you want tointerpolate between them. The same command is used to edit cross sections as toedit section templates.To modify several cross sections:1. Modify one of the sections to achieve the desired result.2. Activate the Modify|Modify/Interpolate command.3. Enter from which section and to which section you want to make this changein the sections. It is possible to modify from any section to any other section.4. Click OK.351
<strong>Topocad</strong>To interpolate between several cross sections:1. Edit the end sections of the interpolation to achieve the desired result. Forexample, if you are going to create a bus station along the road and want tointerpolate the additional offset from section 100 to 130, you need to modifysections 100 and 130. Make the necessary modifications.2. Activate the Modify|Modify/Interpolate command.3. Enter from which section and to which section (the last section is the currentsection) you want to make this change in the sections.4. Click Interpolate.5. Click OKNote 1: It is the current cross section that determines the outcome of the interpolation.Note 2: The modified element in the cross sections has to be of the same type. You cannot extend a slope in onecross section and a fixed element in another cross section.Delete point in cross sectionYou can easily delete a point in the cross section by clicking on the point you want toedit and then going to Modify|Delete point in the menu. Delete point is also in thetoolbox and the icon looks like an eraser. Please note that you cannot delete a pointthat any other point is related to.You can easily delete a complete cross section by going to Construct|Delete sectionin the menu. The complete cross section will be deleted. The volume calculation isthen performed on the adjacent sections with an increased length.Edit layers352
DesignEdit the layers in the cross sections. You can add, delete, rename and move them upand down. The layers are defined between the terrace and finished upper surface.Edit side lines (TCS)If you have used side lines in the section template, <strong>Topocad</strong> requires you to specifythe side lines in calculated sections. This is done using the Edit side lines command.You can have one side line (calculated roadline) along the entire section, defaultvalues only, multiple shorter side lines or a combination of these. You can also useprofiles and camber diagrams here if you also want the section template to controlthe height of the vector.Edit outer slopes353
<strong>Topocad</strong>Command for editing the outer slopes. You can edit different slopes for rock, soil andfill.View in sectionsView in calculated sections contains several options for viewing both toolboxes andparts of the section. These are the options:• Toolboxes• Select section• Sections• Select point in section• Element properties• Areas• Terrace layers• Superstructure layersDisplays all sections in the cross section calculation and the current section ismarked.354
DesignDisplays the area and horizontal length for current section. The area is interactivelycalculated during editing.Displays all the layers in the cross sections and you can turn them off and on fromthis command. Note! If all layers are turned off you will not see them in the dialoguebut they can be turned on if you click on them in the section.355
<strong>Topocad</strong>Print volumesTCS|File|Print outTCS|Settings|ReportTCS|View|VolumesTo print areas and volumes from the calculated sections (tcs file) click Print out.Select which form to use.It is possible to edit the report in Settings|Report.To print cross sections you will need to insert them into a drawing and print fromthere. See Drawing sections for more information.356
Net adjustmentFunctionInput data for net adjustmentLoad survey dataDescriptionNet adjustmentLoading of survey data into the net adjustmentprotocol.Settings for importing survey dataExplanation of termsSettings survey dataExplanations ofmeasurementsExplanation to the Netadjustment document:- Points New and known points- Instruments Selection of instruments, list- Summary Quick summary of the net- Results- Report Explanation of terms in the reportCalculating of netSettings calculationsTests and reports:- Search gross errors- Connection Error- Double measured points- Double measured heights- Post checking of heights- Automatic height test- Point numbering check- Connection error heights- Measurements- Test of known points Test of known pointsOther commands:Save polygon pointsSave net adjustment todrawingDisplay settingsLock heightsSimulation of net adjustment:- Import of known points- New points- ObservationsCalculate the netSettings for different net adjustment calculations.Structure of simulation calculation<strong>Topocad</strong> Net adjustment is based on calculations using the Least Squares Method,and a number of functions have been created for this to bring in data in appropriate357
<strong>Topocad</strong>ways and as methods for searching for errors. There are also a range of functions tocustomize the appearance of the results you want to present.Entry data is based on a purge having been made to <strong>Topocad</strong>'s survey data file usingthe SUR file format, and this data is then imported to the net adjustment; but enteringdata directly to the net adjustment measurements works equally well.The known points are loaded from the preset polygon point file (default is<strong>Topocad</strong>.PP) but you can also enter known coordinates under the New Points tab.Load survey data to net adjustmentThe net adjustment uses <strong>Topocad</strong>'s normal survey data protocol (*.SUR) as a basisfor the observation. The survey data file of individual observations, observationseries, free stations, traverses, detail observations as well as repeated observationsof the same object.To load the observation to thenet adjustment form:1. Create a new netadjustment file fromFile|New - Net adjustment.2. Import data fromFile|Import|File and selectyour survey data file. Notethat it must be closed3. Select the instrument youhave used.4. Select the stations and thetype of data for import. Seebelow.5. The importedmeasurements appearunder the Observations tab,6. where you can also enter or edit other measurements.InstrumentsEnter the instrument to be used in the survey data file. You must have defined the instrumentunder File|Project Settings|Instruments. Click the Add button to enter an instrument nameand then define the properties the instrument has. Note that the instrument must have beendefined before importing the survey data file.Settings for import - What kind of Stations would you like to import?• Known stations (polar configuration)• Free Stations358
Net adjustment• Traverse (standard mode, only the points that are highlighted with the traverse surveytype are usually calculated)• LevelingSettings - What kind of observations?• All observations - also includes detail points.• Observations that are part of the station establishment, i.e. those that have the surveytype "station" and have been coded with the point type backsight or polygon point.• Observations that are used for something else. This means those points that havebeen marked with the survey type "Other".SettingsYou can make several speed settings under Net adj.|Settings in the main menu. Thesesettings do not affect the survey data/measurements but only give the program instructionson how to calculate. This means that even though plane and height are to be calculated for ameasurement, the speed setting is to be set to plane alone.You can make these settings under three different tabs:GeneralType of adjustment:• Plane• Height• Plane and heightType of height adjustment: (only when adjusting height or plane and height)359
<strong>Topocad</strong>• Only leveling (only leveled survey data is included in the height adjustment)• Only trigonometric (only trigonometric observations included)• Leveling and trigonometric (both survey types included)AdvancedSpeed settingsThese speed settings control the calculation and take precedent over the settings made foreach individual observation under the observation tab. The advantage of this is that you aresure that the selected type of calculation really applies to all observations. In order to use theindividual settings for each individual observation, you must select Own settings in this list.Use project settingsUse the settings made under File|Settings|Project settings. It is principally the Coordinate tabthat is of interest when selecting the coordinate system. If this is not Local, an ellipsoidcorrection will occur (height correction projection of length of the ellipsoid) and the projectioncorrection for all observations.Own settingsUse the settings under the Observations tab exclusively, i.e. if the ellipsoid or projectioncorrection is to be calculated for each observation.Free adjustmentRelease all points to ensure the error for the known coordinates does not affect the net. Thisis good for a local net that is to be as tension free as possible, or if you suspect that there isan error in the known coordinates. If this adjustment gives good results in a well-balancednet, this indicates that all observations are OK, and that an error in a normal (forced)adjustment depends on an error in the known coordinates. Remember that an observation ina traverse of observations that ends at a known point is calculated as a detail observation infree adjustment, which means that gross errors cannot be traced for observations of this360
Net adjustmenttype. In order for a free adjustment to be implemented successfully, the net should bedesigned as loops or triangles. Traverses without loops may produce uncertain results.Projection and ellipsoid correction is deactivated for this adjustment. If you want to carry outa free adjustment with the corrections activated, you must use the speed setting Ownsettings instead; select Free adjustment under Detailed settings and then select Yes for allthe corrections for the observations in the observation tab.Free adjustment, local systemYou restrict the known points here to two and allow the program to calculate a bearing fromthe station point, which retains its coordinates. This method also removes tension in theknown points, but retains the station point coordinates (all known coordinates are affected ina totally free adjustment).Local coordinate systemDoes not use corrections for projection and ellipsoid.Unknown coordinate systemUses a free scale to eliminate the affect of a scale error on the lengths. This method is idealif you have major errors in the lengths and suspect that you have an incorrect Y-offset for thecoordinates (affects the projection correction) or has a length gauge with a scale error. If anadjustment with free scale drastically reduces the length errors, you may assume that youhave an error of this type.Correction dataThe values specified here are inactive (grey) if you have selected a speed setting optionwhere the values have either been loaded from the project settings (File|Settings|ProjectSettings) or are not used in the calculation.Earth radiusrequiredfor correction calculations. As a standard value 6370000 is used for Sweden. If youuse a RT90 coordinate system in the project settings and have specified the Use projectsettings speed setting, the program will calculate an earth radius as per the formulas in HMKGeodesi Stommätning (HMK Geodetics Control Point Surveying) Chap B.1.1 and data forBessel's ellipsoid.Geoid heighttheheight (water surface) of the geoid compared to the map projection's reference ellipsoid(Bessel's ellipsoid applies to RT90). If you use a RT90 coordinate system in the projectsettings and have specified the Use project settings speed setting, the program will calculatea geoid height using the geoid height model RN92.Y offsetoffsetin Y which is often 1,500,000 for RT90 coordinates to avoid negative Y values. It isvery important to check this value if you allow the net adjustment to calculate the projectioncorrection. If you use coordinates with the specified offset, but forget to specify it as Y offset,a length of 100 m will have an error of around 2.7m. In File|Settings|Projectsettings|Coordinate you select a system with a specified offset. This is often abbreviated; e.g.RT90 5 GON V 60: -1 means that you subtract 6,000,000 from the X-coordinate and add100,000 to the Y-coordinate. The projection correction formulas used are described in HMKGeodesi Stommätning Chap. C2.361
<strong>Topocad</strong>Refractiontherefraction of the light in the atmosphere. The standard value for the refraction coefficientis 0.140 for Swedish conditions. The refraction influences the calculation of the heightdifference and is used in calculations according to the definitions in HMK GeodesiStommätning Chap. C3.Mean heightifyou are to calculate the ellipsoid correction but do not have the z coordinates for yourpoints (required in the calculation), you can specify the mean height above sea level for thenet you want to calculate. For a length of 1,000m, a height error of 10m will result in acorrection error of just 2mm, so you only need an approximate height for the points; meteraccuracy is often enough. The height correction formulas are described in HMK GeodesiStommätning Chap. C1.Detailed settings: (active for the speed setting Open Settings)Use free scaleusedif you want to calculate the scale if it is unknown, for searching of scale errors in netswith major improvements for lengths, or for tests of a net with known scale to see if thespecified scale factor seems to tally.Use free adjustment-Use free adjustment- adjusts the net without taking fixed known coordinates intoconsideration. Good for nets that need to be free from tension. See Free adjustment underNetadj.|Settings Speed settings. As free adjustment here occurs under the Own settingsspeed setting, the ellipsoid and projection correction will be carried out for a certainobservation if you have specified the observation's row in the survey data tab.Use centering error for new pointsIf you have used forced centering consistently during the observations (had the tripod in thesame place but changed the places of instruments and prisms) you will be aiming at theexact same point that you measured from. In practice, this means that the effects of thecentering error will not influence the precision of the observations. The centering error isadded to the mean error of the calculated new points instead. However, when you connect toa known point, the centering point will have an effect as the known coordinates apply to thepoint on the ground and not the position of the tripod over the point. The program willtherefore include the centering error from known points in normal mode, but not new pointswhen calculating the observation's apriori mean error. This is closest to reality if forcedcenterings dominate in the net. However, if you take the tripod down for the majority of theobservations, you should also take the centering errors of the new points into considerationwhen calculating the apriori mean errors.To sum up this means the following: If you have used forced centering predominantly in thenet, the Use centering errors for new points box should NOT be checked; whereas is shouldbe checked in reverse position.Explanations for ObservationsAn explanation of the columns follows under the Observations tab:362
Net adjustmentFrom PointSelect from which point you have made the observation, i.e. the station point. This may beboth a known point and a free station, or a new point in the centre of the traverse.To pointMarks the point to which the measurement is made. This could be both a known or a newpoint.Series no.Normally you measure one direction series at a time per station and then change the stationpoint. If you have measured in this way, you do not need to worry about this column whichwill then have a default value of 1 for all observations. However, if a special case occurswhere you measure one more direction series from the same station straight after the firstseries, the series need to be separated from each other in some way. If this does nothappen, the program treats both series as one which may lead to errors. We differentiatebetween the series by manually assigning the value of 2 in the series column to the otherdirection series. If we have a third series from the same station immediately after the secondwe assign these observations the value of 3 etc. If several station establishments occur in arow from the same point in a survey data file, the net adjustment when importing will setdifferent series numbers automatically to separate the measurement series.Hor. angleHorizontal angle.Vert. angleVertical angle.LengthSlope distance. If the vertical angle field on the same row is blank, the length is treated ashorizontal.Height diff.Measure the height difference between the from and to point. Used primarily for levelingdata.BearingHere you can enter a known bearing between two points. It could either be a fictitiousbearing to give the net the desired orientation (turned facing north), or a bearing measuredusing gyrotheodolite.Instr. elevationHeight of instrument above the point.Refl. heightReflector (prism) height above the point.InstrumentsSpecify the instrument used, which in turn defines the precision of the observations(measured as accuracy), which is displayed under the instrument tab.Proj. corrProjection correction - specifies if this is to be used or not for the observation. Speed settingsare available in Settings (see this chapter for a more detailed description) if you haveselected Use project settings, which generally activates/deactivates this function for all363
<strong>Topocad</strong>observations regardless of what has been specified for each individual observation. Theprojection correction formulas used are described in HMK Geodesi Stommätning Chap. C2.Ellips. corrEllipsoid correction - specifies if this is to be used or not for the observation. The correctionreduces measured lengths to the ellipsoid. The height correction formulas used aredescribed in HMK Geodesi Stommätning Chap. C1. Just as for the projection correction, thespeed settings will take precedent over the individual settings for an observation.Atm. corr.Atmosphere correction to lengths. This function is affected in the same way as the projectioncorrection to the speed settings in Settings. The corrections are calculated as follows(obtained from instrument manuals from the manufacturer in question):Leicappm=281.5-((0.29035* pressure)/(1+0.00366* temp))Trimble/Geodimeterppm=275-((79.53*pressure)/(273+temp))Topconppm=279.6-((79.53*pressure)/(273.2+temp))Sokkia Laserppm=282.59-((0.2942*pressure)/(1+0.003661*temp))Sokkia Reflectorppm=278.96-((0.2904*pressure)/(1+0.003661*temp))Pressure and temperature are specified as mbar and degrees. The lengths are thencorrected by multiplying by the ppm figure. If the length is specified in km, the correction isgiven in mm.PressureAtmospheric pressure. Consideration is taken to this only if Yes had been entered in the Atm.corr. column. If you have the values in mmhg you recalculate them to mbar by multiplying by1.3333, which is simply done using the Search/Modify function that you activate by rightclicking.TempTemperature in degrees. Consideration is taken to this only if Yes has been entered in theAtm. corr.Weight f. lengthWeight factor length. Weights for lengths are automatically calculated through the formula P=1 / mf2, where mf is the observation's mean error that is obtained from the instrument data.This value does not need to be changed by the user. If you end up in a situation where youknow that an observation is worse than expected due to external circumstances (e.g.weather, light conditions, instrument errors), or if you, for whatever reason, would like certainobservations to have less of an effect on the results, you can reduce the weighting of theobservation. For lengths, this is done by changing the weight factor from 1 (=unaffected) to alower value. If we change to 0.5, for example, this particular length will affect the result halfas much as normal (the previously calculated weight is halved).364
Net adjustmentWeight f. angleWeight factor angle. See above for explanation.Weight f. heightWeight factor height. See above for explanation. Apart from leveled heights, this can also beused for an observation of the vertical angle and length if trigonometric heights are to beused. Weights for heights are calculated for leveling automatically using the formula P= k / Lwhere L is the length between the points in km. k is a constant that is set to one if only oneinstrument is used. If several instruments have been used, k is set for the observations withthe best instrument to one and for the others to one divided by how many times worse theobservation's instrument is compared to the best instrument (calculated from the instruments'apriori mean errors).Use observ.This tab has a number of selections and all of them specify the observations for the currentrow to be included in the calculations:ObservationNoneHor. AngleLengthHA + LengthHeightHA + HeightHA + L + HeightLength + HeightBearingDescriptionNo observation used for this rowOnly the horizontal angle is used.Only the length is used.The horizontal angle and the length are used from this row. Inother words, no height data.The height measurements are used, that is the vertical part of theslope distance or a leveled height difference.The horizontal angle and height are used but not the horizontalpart of the length if this is measured.Horizontal angle, length and height observations are used.Length and height are used but not the horizontal angle.Only the bearing is used.PointsUnder the points tab we can see all points (known and new) that are included in theadjustment. Known coordinates are loaded automatically from the current polygon point filewhen we import a survey data file or enter survey data directly in the net adjustment. Bothstation (from) and object (to) points are checked.It is also possible to change the coordinates of a known point manually, and to change pointsfrom known to new points if you want these to be calculated in the adjustment and not beused as fixed points (e.g. if you suspect that the known coordinates are wrong). A new pointcan be made known by entering the coordinates in the columns Known X, Y, or Z. To changethis, go to the Known column, where you can also enter a point as known in plane but not inheight or vice versa. If the coordinates for a point have been calculated, you can lock themby changing in the known column as mentioned previously. The calculated coordinates arethen copied to the columns for known coordinates.In addition to the coordinates, there are columns for centering errors X, Y, and Z. Here youcan enter a centering error that you know applies to the point irrespective of the instrument. Ifwe have blank cells here, the values we have entered for centering errors under Instruments365
<strong>Topocad</strong>will apply. For a normal tripod set up, 3mm is a normal error, but if we use wall prisms forexample it is lower. A free station point always has the centering error 0, but its coordinatesare usually of no interest.We can also use the centering error if we use calculated points as known points from an oldadjustment. Normally, all known points have a great accuracy, but by using the point meanerrors from the old adjustment, we can provide observations in relation to worse knownpoints with a little greater margin. As a result, uncertainty from these points (with greatermean errors from the old adjustment) will have less of an impact on our new adjustment.Following the completion of the calculation we see Calculated X, Y, and Z, as well as Meanerrors X, Y, and Z for the points, that tell us the calculated position of the new points and theprecision they have. For a more detailed explanation for these headings, see Report.InstrumentsA list appears under instruments showing those instruments that have been selected whenimporting one or more survey data files. The type of Instrument can then be selected foreach observation under the observations tab in the Instrument column.Data on the instruments can be obtained from the relevant supplier. The weights arecalculated from these values, which means that an observation with a good instrument willaffect the result more than the observations with an inferior result. The values you enter arethe instrument's factory tested apriori mean error (see Report).In general you could say that it is the standard mean error in particular that is directlyinfluenced by the instrument data, as it is a comparison with the capacity of the instrument(1.000 means that you have measured exactly at a level the instrument can handle). As aresult of this, the standard and observation mean errors as well as the sigma levels varydepending on the instrument data we choose. It should also be noted that the instrumentdata affects how the various observations are weighted in relation to each other, i.e. howmuch they affect the results. NOTE: It is therefore of the utmost importance that we havespecified the correct values for the instrument's data if we want reliable assessments of thequality of the net. Note that you may not specify a value to 0.0000 as this is an unreasonablevalue that would apply to a completely error free instrument, which makes the weightsimpossible to calculate.SettingsInstr.typeDifferent makes of instrument handle the corrections for pressure and temperature in366
Net adjustmentdifferent ways, which is taken into consideration under this setting. See also Atm. corr in theobservations chapter.HA AccuracyHorizontal angle accuracy. Entered in GON (adjustable to mgon or degrees)VA AccuracyVertical angle accuracy. Entered in GON (adjustable to mgon or degrees)Length accuracy (constant)Specified in meters (adjustable to millimeters)Length accuracy (PPM)Entered in PPMCentering error in planeA centering error can either be specified for each point or generally for from and to pointswhere the instrument is used. The centering error will give all observations that have beenmade using the instrument and offset in the accuracies specified above. E.g. the lengthaccuracy will be calculated as a bit worse depending on the effect the centering errors have.If a field is blank in the Centering error columns X and Y under the Points tab, the centeringerror specified for the instrument will be used.Centering error in heightSee above.Note that you may not specify a value to 0.00000 as this is an unreasonable value that wouldapply to a completely error free instrument, which makes the weights impossible to calculate.Calculating of netTo calculate a net, go to Net adjustment|Calculation, or click on one of the Graphics, Resultsor Report tabs. If a change has been made to the input data or if we make our initialcalculation, we see the message The net adjustment has been changed, do you want tocalculate the net? under these tabs, to which you answer yes.Note that the speed settings you have made in Netadj.|Settings apply. If you want to use yourown settings for atmosphere, ellipsoid and/or projection correction, the speed setting mustbe specified as Own settings.Calculation is made immediately and you can go to the Summary, Graphics, Results orReport tabs to see the results.View screen settingsAn appropriate size to symbolsfor the screen depends entirelyon how extensive the net is andwhat zoom setting you are in,which is why you have theoption of adjusting the symbolsize. The symbols are triangularfor known points in plane,367
<strong>Topocad</strong>circular for new points and triangular with a circle for known points in both plane and height.Measurements are marked with straight dashes for measured lengths and angles formeasured angles.Error ellipses are obviously shown by ellipses and height errors by a vertical dash throughthe point. If the ellipses had the same scale as the net they would not be visible. Instead youcan set the scale factor here that they are to be enlarged by in relation to the net. You canalso change the colors of the ellipses and symbols.It should also be noted that the same graphical functions are available under View as forother applications in <strong>Topocad</strong>, e.g. zoom, pan, drag, redraw etc.Point ID with possibilities to change the size of the text. The point symbols can also bechanged by going to File|Settings|System settings and selecting the Point info tab. ThePointID box you can change placement, font and size of the point symbols.TestsThis menu has a number of tests to see if our survey data contains gross errors. Thespecified tests observe the descriptions in HMK Geodesi Stommätning.Search for gross errorsSearching for gross errors enables you to run a quickcheck over the measurements in the net. By activatingthe Tests|Gross errors command, the program zooms inautomatically on the biggest error in the net, that is themeasurement (length or angle) that has the largeststandard improvement. This is calculated in line withHMK's definition as the so called sigma level, which isthe observation's improvement divided by theobservation's apriori mean error. For each measurementyou can determine whether you are to edit themeasurement, retain it, or erase (delete) it. Click Next toview the second largest error, and so on. If you want toreturn (to larger errors), click Previous.If you specify Edit, the program skips to the measurement tab and selects the currentmeasurement. It is then possible to edit and go back to the graphics, whereupon the questionis asked if the net is to be recalculated.368
Net adjustmentConnection errorThis check is manual and can be used for gross error searching by going traverse in the net.Start by clicking somewhere in the screen to form a square. By selecting point by point andthen returning to the starting point, the connection error is calculated for the loop. Thisprocess gives a safe and quick check of the net, and you can quickly find any errors by usingseveral different loops.Undo delete of the last added point, restart by clearing memorized points.Double measured distancesThis test method searches for all distances that are measured in both directions andcompares them with each other. The difference is then checked against a threshold specifiedin System settings. The program will immediately create a finished report with the testeddistances.Double measured heightsThis test method searches for all height differences that are measured in both directions andcompares them with each other. The difference is then checked against a threshold specifiedin System settings. The program will immediately create a finished report with the testedheight differences.Connection error between known heightsThis test method automatically calculates the height traverse between known heights theprogram can find in the net. The total height difference for the observations are comparedwith the height difference between the known heights. A report is created where acomparison to the threshold is made.Automatic test of height loopsThe program automatically calculates height loops that can be created in the net. Theconnection errors are compared to the thresholds and are printed in a report.Post checking of calculated heightsThis test method compares the adjusted heights with the observations that were included inthe adjustment. A comparison is made with the thresholds and the results are printed in areport.369
<strong>Topocad</strong>Point numberingThe test method checks to see if any points have similar coordinates, which may be a signthat they are actually different names for the same point. Similar point coordinates arecompared to a threshold in a report.MeasurementsThe test checks if any stations have fewer than four objects (not preferable in Banverket's(Swedish Rail Adm) lattice polygon), and lengths that are only measured in one direction.These stations are listed in a report.Known pointsIf we have carried out a forced adjustment (adjustment with known points locked) and hadseveral observations designated as incorrect, this does not always need to be due to theerror in the observations. It could instead be that the known points have incorrect positions.This could be due to them moving, that you have use the wrong error point, or that we havespecified the wrong coordinates. All known points are calculated in the adjustment as perfectand any errors they may have are interpreted as observation errors instead.In order to test the observations without any influence from coordinate errors, you shouldtherefore carry out a free adjustment (all points treated as new) in order to remove all errorsin the observations. This assumes that the net is linked in loops as far as possible traversesto connection points produce uncertain results for free adjustment.If you have removed all the observation faults in the net, it simply remains to test thepositions of the known points. You do this via the following steps:• If you have selected Plane or Plane and height under Netadj.|Settings|General theknown coordinates in plane are tested. If the selection is Height, the Z coordinatesare tested instead.• The test starts by selecting Tests|Known points. The following window appears:1. Here we select the points we want to test in the list first Lock/release known points.The points that are pre-checked will be included in the test. If we click the Extentsbutton, all points will be included. The None button releases all points allowing you tomake your own selection. This gives us the option of testing known points in a certainpart of the net, which can be useful in expansive nets.2. The program can then be set to stop when a calculation has been made (Onlyrelease point with greatest error) or release the worst point and recalculate until allpoints meet the threshold (Release points until the net is approved). The latter is asquick and easy as an initial test, but the final check should preferably be carried outpoint by point where you make a thorough analysis before proceeding.3. When the program calculates length observations, you can specify under Correctionsif the lengths are to be corrected for Ellipsoid and Projection. If you select Use projectsettings, the corrections apply that have been set generally for the project. Settingscan be checked under File|Settings|Project settings|Coordinate. If you selectAccording to settings, the settings are used for each individual observation'scorrections (the Projection and Ellipsoid columns) in the observations tab. Note thatthese selections apply regardless of what you have set as speed settings under Netadj.|Settings|Advanced.370
Net adjustmentIn order to describe other settings, we go through what happens if you start the test bypressing Calculate:• A free adjustment is carried out. For the points to be tested, the coordinates arepicked that the points were given in the free adjustment. These are incorrect in thatthey originate from a free adjustment, but if this is correct the points will be right inrelation to each other.• The program then takes test points coordinates from the free adjustment andtransforms them so they fit as well as possible with the known coordinates for thesame points.• This is done to test in plane by moving in X and Y, rotating and, if you have selected itin the program, scale changing. Do this by selecting Congruent or Helmert asTransformation. The latter type also adjusts the scale of the free net, which meansthat you remove the influence of the scale error at the length gauge. If you are surethat the scale of the lengths is correct, you should use Congruent, which retains thescale of the lengths. Otherwise there is a small risk of fitting errors at the points beingpartially interpreted as scale errors in the calculation instead.• For heights, the transformation takes place via the program calculating the averagevalues for both the known and the adjusted points. The mean value is then removedfrom known and adjusted coordinates making both averages zero (center of massreduction).• For heights, mean errors are also calculated for connection height fixes even thoughthey are not part of the free adjustment. The program then looks up the nearestadjusted height and uses the mean error's law of error propagation for the connectionobservations and the nearest adjusted point to set a mean error for the height fix youhave connected to. Naturally, this value does not have the same certainty as theheight mean error that is included in the free adjustment. However, excluding themwould mean that you would not get any connection height fixes at all in the test, whichis often a major disadvantage as this measurement situation occurs quite often.• In plane position only the known points that are included in the free adjustment, i.e.connection points are excluded from the test unless the observations are overdeterminedin relation to them. This is due to them being uncertain in relation to theother net, where at least two unchecked observations (angle and length) are used.However, it is normal in plane mode that the connection observations are overdeterminedto ensure the points are included in the free net. We also have situationswhen just one angle is measured in relation to a known point that is a backsight. Inthat case this point is impossible to test and is excluded from the test.• If the known coordinates are correct (and also the observations in the freeadjustment) the adjusted and known coordinates fit exactly with each other for atransformation. If any point is incorrect, this is noticeable by it having a fitting errorbetween the free and known coordinates. The fitting error is reported as an errordivided into X and Y as well as radial (total) errors. The problem now is where to drawthe boundary line for when a point is incorrect and, in connection with this, take intoconsideration the error sources included in the calculation. These are primarily themean errors of the points from the transformation and the free adjustment. A pointthat is at the edge of the net will be more uncertain in the transformation than one inthe middle.• In order to have a tool that is as certain as possible when identifying errors, a testquota is calculated. This specifies how large the fitting error is compared to the totalmean errors of the point from the transformation and the free adjustment in thedirection of the fitting error. This test value can be compared with standardizedimprovements (sigma levels) for observations. Following this, HMK's three levelprinciple can be applied in order to assess if a point is wrong or not. You can set theprogram if the limit for errors is set at factor 2 (95% error probability), 3 (99.8%) oryour own level.371
<strong>Topocad</strong>• When the calculation is complete, the number of points is reported that are locked orreleased following the calculation. In the Current point box you can see the worsepoint's ID and test quota together with the error in X and Y, radial (total) and thedirection (bearing) in which the point has moved.• If you click Edit, the program jumps to the point tab and positions itself on the row ofthe current point. This is to enable you to quickly check and, if necessary, correct anywrong coordinates for the current point. If you click Next, the second worse point isdisplayed and so on. Previous then goes in the other direction.• We can also tick the box if the point is to be known (Locked) or released in the nextcalculation.• You get a summary of a calculation by clicking Report. You then select the reporttemplate you want to use (normally Standard) and then get a summary of thecalculation. The report shows the following details first:Net adjustmentTransformation typeNumber of known pointsNumber of known pointstestedNumber of released pointsNumber of remaininglocked pointsNumber of remaininglocked points testedNumber of new pointsT-threshold for approvalName of net adjustment file.Helmert (scale change) or Congruent (no scale change).Number of known points overall in the net.Number of known points that are included as locked in thetest.Number of points released prior to or during the test.Number of points that are locked after the test.Number of points that are locked after the test and havebeen included.Number of calculated new points in the net.The threshold that defines whether a point is incorrect (theT-value for a point is a quota between the point's fittingerror and mean error)• The standard mean error is then displayed, HMK's approval limit, over-determinationsand K-Value for the free adjustment that form the basis of the test. Following this thesame parameters are shown for the forced adjustment with all points locked andfinally a forced adjustment with only the remaining locked points as known. The ideahere is that you can see if the deleted points improve the net as a whole at the lastadjustment.• The data is then displayed for the point(s) that have been released. The followingdata is displayed:Point IDdXdYRowmTraRmFriRmRTChange XChange YPoint nameFitting error in X axisFitting error in Y axisRadial (total) fitting errorsMean error from the transformation for the point in the direction ofthe fitting errorMean error from the free adjustment for the point in the direction ofthe fitting errorTotal mean error for the point in the direction of the fitting errorTest value, quota between the fitting error and mean error for apointA measurement of how much the point has moved in the X axis forthe adjustment after the incorrect points have been released.As above but in the Y axis.372
Net adjustmentDistance knownppmThe distance from the current point to the nearest known that isincluded as known in the adjustment and has not been released. Ifthere is a long way to a known point, the change described abovewill be greater.Comparison in mm/km between the radial (total) change and thedistance to the nearest remaining known point. Points that lie closeto a known point and that have moved a lot are a greater source oferrors than those that have the same change but are a long wayfrom the nearest known point. A high ppm value indicates that thepoint is uncertain and has a significant effect on the net.• The next part of the report is a record of each individual search and its results. If wehave set the program to only make one calculation, it is shown here. If we haveselected Release points until the net is approved all the separate calculations arereported. The following data is included:Number knownNumber releasedNumber lockedScaleStandard meanerror from thetransformation'scalculationPoint IDdXdYRowmTraRmFriRmRTIncorrect point orTest approvedNumber of known points overall in the net.Number of points released prior to the test.Number of points that are locked prior to the test.The scale factor calculated for the transformation between the freeand known points. If we have used congruent transformation, thescale is 1.000000. If we have selected Helmert, any majordeviations from one indicate that we have a scale error in thelengths.This value can be interpreted as the mean error that the pointshave on average from the transformation.Point nameFitting error in X axisFitting error in Y axisRadial (total) fitting errorsMean error from the transformation for the point in the direction ofthe fitting error.Mean error from the free adjustment for the point in the direction ofthe fitting error.Total mean error for the point in the direction of the fitting errorTest value, quota between the fitting error and mean error for apointResults from the test If a point is incorrect, it is reported here, plusthat it has a star in front of its ID• When you have finished analyzing the results, you can print or save the results file invarious formats using the icons top left. To return to the test settings, close the resultswindow and select OK, whereupon you return to the test's initial window. If pointshave been released during or after the latest calculation, they are now released in thelist Lock/release known points. We can now choose to change the settings, release orlock points, and recalculate.• When we have finished with the test, we press Apply. We are then asked if we wantthe points that have been released in the test to be released under the point tab aswell. To give known points new coordinates could be delicate and you should beaware of the consequences. The danger is that you could easily have different373
<strong>Topocad</strong>Summarycoordinates for a certain point in different projects, so the points that are releasedshould not be uncertain.When you have made a calculation you can see the general results by selecting theSummary tab. The calculation primarily specifies if a standard mean error is approved inplane and/or height (see Report). If this is not the case, either the error is specified as largebut the calculation was still possible or it was too large to allow an adjustment.We will then identify the most important results which means that you can assess if theadjustment is to be approved or not for plane and height. Here the net's standard mean erroris included, K-value, and the largest point mean error in plane (error ellipse large axis) andheight. You also get the observations' largest sigma level, improvement (for angle, length,and height difference) and lowest relative redundancy (individual K-value). See thedescription of these parameters in the Report chapter.In addition to this, a summary of the observations' sigma levels is listed to ensure that youcan assess whether the observations contain gross errors. The distribution of the sigmalevels is compared with the theoretical values that an average calculation would give.ResultsYou can view the most important values under results which specify how the latestadjustment went. In addition to received and permitted (as per HMK) standard mean errors,we see how many gross errors we are estimated to have in the net, and a comment thatdescribes how the adjustment went overall. If it was not possible to implement, the reason forthis is given.ReportThe report is divided into a number of main headings. If these headings are included, and thetype of data they cover, depends on the report settings you select. The data the program caninclude in the report are as follows:TotalTermK-ValueDescriptionEnter checkability value for the plane net, i.e. the number of overdeterminationsdivided by the number of observations. If you have374
Net adjustmentmeasured the exact number of observations required to get thecoordinates for the points, the K-value is 0, but HMK recommends0.5 and higher for the backbone net. The normal values for polygonnets are 0.1-0.2.No. over-determ.Standard meanerrorAppd thresholdfr. HMKScale factorIterationsSigma levelsNumber of over-determinations in plane or heightSize of net's standard mean errorThe threshold for the standard mean error that HMK has set up forthe backbone net to be regarded as approved.Calculated scale factor in plane for free scale. If this is not used thevalue 1.000000 is shownFor plane adjustment a calculation is made of how much you needto adjust the approximate values of the point coordinates in order forthe improved observations to correspond with them. If you havemajor errors in the net, the approximate values will be unsatisfactoryand the results will not be correct. You then use the calculatedcoordinates as approximate values and readjust. The procedurecontinues until the observations agree with the points, and thenumber of calculations are specified as the number of iterations. 1-3are normal values here, and the program has a maximum limit of 20iterations to enable it to carry out an adjustment. This is due to thefact that if the observations are unsatisfactory enough, you will getvalues that are progressively worse for each calculation and therebynever arrive at a result.The number of observations that are within the various sigma levelsare specified here. From a statistical perspective, 68% of theobservations should be below level one, 95% below level two and99.8% below level three. Observations with sigma levels abovethree are classed as gross errors, but also the levels between twoand three should be checked in accordance with HMK.StatisticsNumber&Here you specify the number of horizontal angles, vertical angles, direction series, horizontallengths, measured distances and known points in plane and height. Also shown are max,min and mean values for the following values: sigma levels, length improvements, horizontalangle and bearing improvements, height improvements, largest influence in plane and heightand point mean error in plane and height.Known pointsPointIDName of point.X, Y, Z coordinateSpecified known coordinates for the point.375
<strong>Topocad</strong>Centr. incorrect X, Y, ZSpecified centering error for the point.New pointsTermPointIDDescriptionName of point.X, Y, Z coordinate Specified known coordinates for the point.Mean error X, Y, ZCentr. incorrectX, Y, ZEllipse aEllipse bEllipse bearingCalculated mean error for the point including centering error.Specified centering error for the point in question.Error ellipse's large axis, i.e. the point's largest mean error in anydirection.Error ellipse's small axis, i.e. the point's smallest mean error in anydirection.The bearing for the error ellipse's large axis.ObservationsTermFrom PointTo pointSurvey typeSurvey valueCorrectionImprovementAposteriori meanerrorApriori mean errorSigma (level)DescriptionSpecifies from which point you have measured. Normal stationpointThe point to which the measurement runs.Shows length, horizontal angle, bearing or horizontal angle.For the actual observation, note that lengths, angles, bearings, andheights are separated, and that lengths are reported as horizontal.The direction series is reduced to zero for the backsightThe total correction for atmosphere, projection, and ellipsoid(height).How much the observation must be adjusted in order for it to tallywith the calculated and known points. The greater the value, theworse the result. These values are used primarily to search forgross errors.The calculated mean error for the measurement from theadjustment. If this error is greater than the apriori mean error forthe measurement, your measurements are worse than what theinstrument is capable of measuring.This mean error is measured in the factory and describes thetheoretical accuracy for angle, length, and height of the instrument.The mean error for heights varies depending on how long thelength is.Standardized mean error (1=the error is at level with the376
Net adjustmentSmallest det. errorLargest influenceRelativeredundancyWeight factorBearingLengthinstrument's performance, 2 = twice as large error as theinstrument's performance etc.). HMK specifies 3 as threshold inorder for the observation to be classified as a gross error.The smallest detectable error in the observation (inner reliability),i.e. the error that gives a sigma level of exactly 3.Errors that are smaller than the smallest detectable errors cannotbe eliminated. Here the maximum influence this error has on thecoordinates for the points it is measured between is specified.Note that this value only applies to this observation's influenceRelative redundancy - how much the error that remains with theobservation in the form of the improvement, (e.g. the value 0.43means 43% of the error). If the error we measure is 35mm, thiserror will be spread out over the other observations and affectthem. If we then have a K-Value of 0.43, the improvement will onlybe 15mm, i.e. the greatest share of the error remains, distributedover the other observations, and affects the results. This value isalso called individual K-ValueThe total calculated weight factor, which is calculated through 1/s²,i.e. A calculated apriori mean error square". For a mean error of 1milligon the weight factor will be 1,000,000. If we have thenspecified a weight constant other than 1 for the observation, thiswill also be calculated here.Approximate bearing for the measurement (comparative figure).Approximate length between from and to point (comparativefigure).Save polygon pointsBy placing yourself under the New points tab and then going to the Netadj.|Save points to PPcommand, the calculated points in the current polygon point file (.PP) are saved. Note thatyou must have selected the Points tab in order to use this function.You can select between saving all new points, the current point you have selected or a rangeof points. If you want to save points in a new file, you create a new polygon point file viaFile|New|Polygon points and then connect it to the project via File|Settings|Systemsettings|Observation whereupon you select the new file. Finish by saving the points as perthe description above.377
<strong>Topocad</strong>Lock all calculated heightsWhen the height adjustment has been carried out, you can then lock all calculated heights byselecting Netadj.|Lock all calculated heights. This locks all available heights, and can beused to trace all incorrect instrument heights and signal heights.Save net adjustment to drawingGoing to the Net adjustment|Save net adjustment to drawing command saves all detail pointsand also over-determined points down to an optional drawing. Here you specify the drawingby specifying a previous save, an open or a completely new drawing.Note that the codes of the points can be used to sort at different levels which is an excellentoption for separating data from each other.378
Net adjustmentSimulation of net adjustmentNet adjustment|Simulation<strong>Topocad</strong>'s net adjustment can generate simulations of nets. To do this you createtheoretical observations where you believe you can measure, and get to select thetype of observation you can make between different points. You can create points inan existing drawing, export them from here to PP or PXY coordinates and then importthem to a new or existing net adjustment. From the net adjustment, you point outwhere the observations will be made, which will result in theoretical values. Normalsettings are made for the net adjustment calculation and then a calculation is madeto mirror the quality of the net, but obviously not the observation.FunctionImport known pointsNew pointsObservationsDescriptionImport of known points to net adjustmentCreate new points immediately in the net adjustment.Identify where the observations can be made.Import known pointsPoints of the PP format (Polygon points) or PXY can be imported. Their pointnumbers are automatically lit and the settings for these are made underFile|Settings|Point info.New pointsNew points can be specified directly in the net adjustment. If you would like to usepoints from the drawing, you can import these via the "Import known points"command, but edit them in the "Points" tab so that they are unknown in one or twoplanes.379
<strong>Topocad</strong>ObservationsPoint out from where and to what points you believe you can measure. Select themeasurements that can be made and whether the observation can also be madefrom the other direction. Change station by clicking "Station". Also select theinstrument with its accuracy that you intend to use.When this has been done, the observations you have specified here are createdunder "Observations". These are then as good as they can be theoretically. Editingcan be done with respect to measurements. You then do a normal net adjustmentcalculation with its settings. See net adjustment calculation.380
Database connector for ArcGISArcGIS ServerCommandOpen mapDisconnectAdd DataSave DataSave selectionRefresh dataReconcile and Post(save)Version managerChange versionEdit AttributesGroup ObjectsSystem settings - ArcGenerate Subtype layersDescriptionOpens the database for the drawing.Disconnects the databaseAdds data from the database to the drawing.Saves the dataSaves a selection of new or modified objects.Refresh data, load from databaseReconciles and Posts data to the current version ofthe database.Manages different versions of the database.The command allows version change of selectedlayersEdit attributes handles domains and subtypes.Command to group single objects into one.Settings - including drawing method etc.Move subtypes in a layer to a subtype layerOpen map381
<strong>Topocad</strong>Opens the data from the database. Opens the complete map or parts of it usingdifferent search criteria.Open map by database search.Find: Search for a value's attribute, for example address or road name.In: Where to make the search.Select whether to find features that are similar to or contain the search stringAll fields/ In fields: Select if you want to search through All fields or a special field.Buffer: Default is 100 meters, which opens the map with a radius of 100 metersaround the selected attribute.DisconnectDisconnects the database The Arc license used is not free until you close <strong>Topocad</strong>.382
DatabasesAdd dataAdds data from different layers. An area is selected.Save dataSaves the data. Select from the alternatives All changes, New features only,Modified features only, New and modified features only or Deleted features only.383
<strong>Topocad</strong>Save selectionThe command allows the user to save a selection of new or modified objects. Deletedobject are not able to save.The dialogue shows concerned layers, how many marked object in each layer andalso the total amount of objects that will be saved.Refresh dataUpdate data and load new data from the database. You can ignore changes made inMapsuite+.384
DatabasesReconcile and PostReconciles and Posts data to the database.Any layers with differences from the database are displayed in a list. All layers withchanges are displayed with three numbers in brackets, e.g. (1, 2, 3), where the firstnumber indicates how many new objects are in this layer, the second numberindicates how many changed objects and the third number indicates how manydeleted objects - these must be deleted from both the drawing and the database.Reconcile against version. Select layer to reconcile with.Version managerA list of different versions of the database. New versions can be created by rightclicking.Change versionThe command allows version change of selected layers. All changes of existingobjects will be deleted. New object will not be affected.Edit AttributesEdit attributes handles domains and subtypes.385
<strong>Topocad</strong>Group objectRight click on objects and select group object. The object will now appear as onesingle object.Generate Subtype layersThe function moves subtypes in a layer to a subtype layer. The new subtype layer willbe named - 386
DatabasesISM adapterThe ISM adapter is a method of saving data from the drawing to an Oracle Spatialdatabase using the ISM (Independent Spatial Management) application. For moreinformation about this module please contact your dealer.ISM387
Index33 D view ............................................ 793D ............................................. 22, 1263D polylines ...................................... 423d view ............................................. 793D view in DTM .............................. 261AAbrupts ............................................. 10ACK/NACK ..................................... 111Activate ........................................... 228ACU .................................................. 98Add ............... 20, 75, 84, 120, 126, 135Quick list ....................................... 20Add points to DTM .......................... 278Add polylines to DTM ..................... 278Adjustment of net ............................ 357Affin ................................................ 197All Geodimeter .................................. 98Alt + F4 ............................................. 10Angle/distance ................................ 191Angles............................................... 31ANSI ................................................. 84Answer Yes ...................................... 22A-priori ............................................ 357Area ................................................. 77ASCII ............................................... 84ASCII button .................................. 106Attribute in symbol ......................... 160Attribute/s ...................................... 160Auto ............................................... 103AutoCAD's ....................................... 84Axis .................................................. 33BB 10, 22, 138, 201Back ............................................... 120Result ......................................... 120Back Point Id.................................. 126Back/Forward ................................. 126Backsight ................ 104, 106, 120, 126station ........................................ 126Backsights ........................ 60, 106, 120base point ...................................... 288Break ............................................. 201CC 10, 22, 24, 150C3 .................................................. 247CAD application ................................. 5calculate point ................................ 288389
<strong>Topocad</strong>Calculate points .............................. 295calculate section from point ............ 288Calculate section/offset .................. 296Calculated ............................... 126, 169calculated section ........................... 288Calculation ...................................... 120Camber ................................... 332, 333Camber|Create ............................... 332Cancel ............................................ 120Cannot ............................................ 120Centre ............................................... 12Centre Point ...................... 12, 139, 141help ............................................. 139Change ........................................... 207Change object order ....................... 208Change properties .......................... 209Change properties - by objectproperties .................................... 227Characteristics ................................ 250gives............................................ 250Check ............................................... 63Check Point ............................ 104, 106Checkability .................................... 126CHK ................................................ 247Circle segments ................................ 38Click Done ...................................... 146Click OK ......................................... 103CLOSE .......................................... 247Closed polyline .............................. 211Clothoide ................................ 143, 301point ........................................... 143Clothoide/spiral .............................. 143Clothoides ............................... 143, 301CLSRECT ...................................... 247Code .............................................. 211Collector/instrument ......................... 35Collectors/instruments ..................... 35Colour ............... 24, 135, 207, 211, 261Colour By ....................................... 207Colours .......................................... 207Column .......................................... 120Columns/fields ................................. 84Columns/tabs/fields ......................... 84Command ...................................... 201Comms .......................................... 101Comms Link ..................................... 92Communication ......................... 84, 101Communication menu ...................... 83Comparison between points .......... 186Computer/station ........................... 100Config ............................................ 106390
GlossaryConfiguration .................................. 104Leica ........................................... 104Connect ............................................ 92Psion ............................................. 92Connect Psion ................................ 101Connection error heights ................ 357Connection string to database .......... 50Construct - Section ......................... 333Construct & Modify ........................... 10Construct drawing view................... 165Construct/Dimension ...................... 183Construct|Arc .................................. 141Construct|Circle .............................. 139Construct|Clothoide ........................ 143Construct|Convert ........................... 162Construct|copy ................................ 150Construct|Create .................... 155, 158Construct|Define ............................. 160Construct|Divide ............................. 153Construct|DTM|Contours ................ 267Construct|DTM|Create DTM ........... 265Construct|DTM|Heights ur DTM ...... 271Construct|DTM|Volume .......... 272, 276Construct|Fill ................................... 148Construct|Fillet ................................ 152Construct|Group ............................ 185Construct|Insert ............................. 146Construct|Line ................................ 135Construct|Offset ............................. 151Construct|Point .............................. 138Construct|Polar .............................. 182Construct|Profile ............................ 168Construct|road ............................... 289Construct|Road line|Calculate ....... 295Construct|Road line|Quick ............. 298Construct|Road line|Save .............. 292Construct|Road line|Save Road ..... 292Construct|Road line|Section/Offset 296Construct|Road line|Sections ......... 293Construct|Road line|Surface .......... 297Construct|Section .......................... 169Construct|Sheet ............................. 164Construct|Slope ............................. 149Construct|Text ............................... 144Construct|View ............................... 165Contents ............................................ 1Continue ........................................ 120Contour lines .................................. 267Contour lines in layers ................... 267Contour texts ................................. 270391
<strong>Topocad</strong>Control codes ................................. 247Convert symbols ............................. 162points .......................................... 162Co-ordinate ......... 16, 74, 135, 141, 228Coordinate axis ................................. 33Coordinate decimals ......................... 35Co-ordinate grid .............................. 166Coordinate system .................... 37, 235Copy ....................................... 150, 191Copy by mirror ................................ 154Copy object ..................................... 150Copyright Chaos . 10, 92, 111, 151, 265Counter-clockwise ............................ 31Create camber diagram .................. 332Create contours .............................. 267Create coordinate grid .................... 166Create co-ordinate grid ................... 166Create crossfall ............................... 332Create drawing sheet ..................... 164Create drawing view ....................... 165Create DTM .................................... 265Create line type .............................. 158Create section ................................ 169Create sheet ................................... 164create shortcut ................................ 255Create symbol ................................ 155Create view .................................... 165Create/modify ................................ 213Cross ................................................. 7Cross section template .................. 333Cross sections ............................... 169Cross sections in drawing .............. 169Cross sections volumes ................. 276Crossfall .................................. 332, 333Ctrl button ...................................... 120Use ............................................. 120Ctrl-key ....................................... 7, 197keeping ...................................... 197pressing ......................................... 7DDatabase ......................................... 50Database connection ....................... 50Decimal character ............................ 35Decimals .......................................... 35Default ...................................... 16, 120Define attribute .............................. 160Degrees ........................................... 31Del ................................................... 10Delete . 20, 84, 106, 155, 190, 252, 261Quick list....................................... 20392
Glossarywant ............................................ 155wish ............................................. 261Delete Object .......................... 155, 190Design, section template ................ 333DH .................................................. 191DIAM .............................................. 247Difference between points .............. 186Digital Terrain Model .............. 261, 265select ........................................... 261Dimension ....................................... 183Direct ................................................ 90Mapsuite+s ................................... 90Display .............................................. 38Display/drawing .............................. 211Distance diff.Calculated .................. 126Distance/height ............................... 126Divide area ..................................... 188Divide DTM ..................................... 277Divide line ....................................... 153Divide surface ................................. 188Double measured points ................. 357Double Point Id ................................. 40Down .............................................. 120Draw arc ................................. 141, 155Draw Circle ..................................... 139Draw cross sections ....................... 169Draw line ........................................ 135Draw line/select ............................. 298Draw Point .............................. 138, 155Draw polyline .......................... 135, 155Draw profile form ........................... 168Drawing .................. 135, 138, 146, 155polyline ....................................... 135Drawing find entity ......................... 236Drawing line type ........................... 233Drawing of cross sections .............. 169Drawing scale ................................ 230Drawing settings .............................. 40Drawing sheet folder ........................ 41Drawing symbol ............................. 231Drawing|Baseline ........................... 228Drawing|Scale ................................ 230DRD ................................................. 84DRD Road ....................................... 84Drives/units ...................................... 20DTM .................. 79, 162, 261, 265, 298edit ............................................. 261DTM heights .................................. 271DTM, add points to ........................ 278DTM, extract .................................. 277393
<strong>Topocad</strong>DTM, update ................................... 278DTM, Z value .................................. 271DTR ................................................ 111DTS .................................................. 84Duplicate point id .............................. 40DVL .................................................. 84DWG ................................................. 84DWG export .................................... 112DWG import .................................... 112DXF .................................................. 84DY .............................. 44, 75, 150, 1910.0. ................................................ 44EEarthworks/design .......................... 297DTM ............................................ 261Point ............................................ 213Point Id ........................................ 126polyline ........................................ 211polylines ...................................... 211Edit attribute ................................... 213Edit DTM ......................................... 261Edit polyline .................................... 211Edit raster ....................................... 221edit road line ................................... 290Edit Station Id ................................. 126Edit text .......................................... 216editor .............................................. 290EER ............................................... 141Ellipsoid setting ................................ 37END .......................... 84, 106, 211, 247polyline ....................................... 211End + Start ..................................... 104End Point .......................... 12, 126, 288ENDCV .......................................... 247ENDONCV ..................................... 247Endpoint-centre Point-endpoint ..... 141help ............................................ 141Endpoint-Centre Point-Endpoint The................................................... 141Endpoint-endpoint-radius ............... 141help ............................................ 141Endpoint-Endpoint-Radius The ...... 141Enter key ................................ 144, 207Entity .............................................. 236Error message ................................. 53Excel file ........................................ 101Existing ..................................... 60, 252Point ........................................... 252Polygon Point file ......................... 60Exit ................................................... 27Expert .............................................. 84394
Glossaryopen .............................................. 84Explode............................. 73, 155, 202Point ............................................ 202Point Information ........................... 73polyline ........................................ 202Explode Point ................................. 202Export ......... 42, 84, 100, 101, 102, 103file ............................................... 102Leica ........................................... 102Psion ........................................... 101Sokkia ......................................... 100Export file .......................................... 84Export road profile .......................... 317Export settings .................................. 42Export till Trimble ............................ 103Export to PRF ................................. 317Extend ............................................ 203polyline ........................................ 203Extents.............................................. 24Extern Point .................................... 120External references ........................ 234External references in DWG file ..... 112Extract terrain model ...................... 277FF2 button ........................................ 135press .......................................... 135File .......................................... 102, 120File|Close ......................................... 18File|Exit ............................................ 27File|Export ............................... 102, 103File|Export|File ................................. 84File|Export|Geodimeter .................. 103File|Export|Leica ............................ 102File|Export|Psion ............................ 101File|Export|Sokkia .......................... 100File|Import ........................................ 92File|Import/Export ............................ 83File|Import|Files ............................... 84File|Import|Leica ....................... 94, 104File|Import|Psion .............................. 92File|Import|Sokkia ............................ 90File|Import|Trimble .................... 98, 106File|New ...................... 16, 92, 126, 301File|Open ......................................... 18File|Preferences .. 44, 59, 60, 62, 63, 73File|Preview ..................................... 19File|Print .................................... 24, 126File|Printer ....................................... 26File|Printer Setup ............................. 26File|Return ....................................... 19395
<strong>Topocad</strong>File|Save ................................... 18, 301File|Select ......................................... 20Fill area ........................................... 148Filled polyline .................................. 211Fillet ................................................ 152use .............................................. 152Find entity ....................................... 236Finds ............................................... 120Point ............................................ 120Finish ........................................ 84, 135First backsight ................................ 126First Point ....................................... 126FlatButtons ....................................... 63Folders.............................................. 41Font settings ..................................... 38From-system ................................... 197Frozen layer .................................... 224Full screen ........................................ 82GGDT .................................................. 84General ........................................... 120General functions ............................... 5General Import/Export ...................... 84Generic import/export ....................... 84GEO/Point ........................................ 84Geodat ...................................... 98, 103Geodimeter ....................... 98, 103, 106read ............................................ 106Geodimeter Do .............................. 108Geodimeter/Geodat ....................... 103Geodos ............................................ 84Geodos Do .................................... 108Get Style ........................................ 135GIF 10 ....................................... 94, 102GIF10 ................................ 94, 102, 111Gives ............................................. 250characteristics ............................ 250Global line type .............................. 233Global symbol ................................ 231GON .............................................. 193GONS .............................................. 31GRE3 ........................................ 94, 102GRE4 ........................................ 94, 102Group ............................................. 185Group objects ................................ 185Group/round................................... 126GSI ..................................... 84, 94, 102GSI 16 ........................................... 102GSI8 .............................................. 102G-trance ......................................... 219396
GlossaryGtrans ............................................. 219G-trans............................................ 219GVL Geosis .................................... 301HHandshake RTS ............................. 111Height ......................... 44, 73, 120, 144Height and/or Point ..................... 44, 73Height lines ..................................... 267Height on contours ......................... 270Height test ...................................... 357Height/station .................................. 126Heights from DTM .......................... 271Helmert ........................................... 197Help .................................... 1, 139, 141centre Point ................................. 139endpoint-centre Point-endpoint ... 141endpoint-endpoint-radius ............ 141tangent-tangent-radius ........ 139, 141Hhmmss ......................................... 120Hhmmss.ddd .................................. 120Hidden layer ................................... 224Horizontal ....................................... 126Horizontal Angle ............................. 126Horizontal Distance ........................ 126IId 98, 120, 126Image ...................................... 145, 221Import ....................... 84, 90, 92, 94, 98Import Database .............................. 83Import drawing ............................... 234Import from PRF ............................ 317Import from Topcon ....................... 114Import Map....................................... 83Import Raster ................................... 83Import road profile .......................... 317Import settings ................................. 42Import Toptrans ............................... 83Import/export .................................1, 42Imported to/from .............................. 84Ins .................................................... 10Insert ........................... 75, 84, 146, 193Insert coordinate grid ..................... 166Insert co-ordinate grid .................... 166Insert dimension ............................ 183Insert drawing sheet ...................... 164Insert drawing view ........................ 165Insert raster.................................... 145Insert sheet .................................... 164Insert symbol ................................. 146397
<strong>Topocad</strong>Insert view ...................................... 165Insertion Point ... 12, 144, 191, 193, 195Installation .......................................... 6Instrument ......................................... 52Instrument accuracy ......................... 52Instrument settings ........................... 52Intermittent ............................ 90, 92, 94Internet ......................................... 6, 22Intersection Point .............................. 12JJoin ................................................. 199Join polyline .................................... 199KKnown point file ................................ 50LLanguage .......................................... 43Last Point ........................................ 126Layer manager ............................... 224Least square method ...................... 357Leave .............................................. 211polyline ........................................ 211Leica ................... 83, 94, 102, 104, 111Configuration ............................... 104Export .......................................... 102Leica Do ......................................... 108Leica’s .............................. 94, 102, 104Leica's file ........................................ 84Lengthen ........................................ 205polyline ....................................... 205Limits ............................................... 53LIN ................................................... 84Line ................. 84, 90, 92, 94, 106, 252Start ............................................. 84Line no/Point ID .................... 90, 92, 94Line types ...................................... 233Line/end ........................................... 98Lines/road ...................................... 101Local linetype ................................. 233Local symbol .................................. 231locate entity.................................... 236Longitudinal section in drawing ...... 168MManagement of layers ................... 224<strong>Manual</strong>ly ........................................ 126MAP ................................................. 24Map charts ....................................... 48Map import ....................................... 48Map sheet ........................................ 48Maximize ......................................... 82Mb ...................................................... 6398
GlossaryMb RAM .............................................. 6Measure area ................................... 77Measurement/distance ..................... 75Medium height calculation ................ 37Memory/station ................... 94, 98, 120Metadata ......................................... 250Metadata file ................................... 250Metadata Mapsuite ......................... 250Microstation ...................................... 84Mid Point ........................................... 12Mirror .............................................. 154Misc .................................................. 10MODE ............................................. 111Modife|Scale ................................... 216Modify .... 191, 193, 195, 199, 201, 203,261Modify |Edit ..................................... 213Modify gtrans .................................. 219Modify raster ................................... 221Modify|Break ................................... 201Modify|Change ............... 207, 208, 216Modify|Change|Object .................... 208Modify|Change|Properties .............. 209Modify|Delete .................................. 190Modify|DTM .................................... 261Modify|Edit ...................................... 216Modify|Edit polyline ........................ 211Modify|Explode .............................. 202Modify|Extend ................................ 203Modify|Join ..................................... 199Modify|Lengthen ............................ 205Modify|Move ........................... 191, 216Modify|Rotate .......................... 193, 216Modify|Scale .................................. 195Modify|Transformation ................... 197Modify|Trim .................................... 204Move .............................................. 191Move object ................................... 191MPa ............................................... 250NNE or XY .......................................... 33Net ................................................. 357Net adjustment ............................... 357Net adjustment, simulation ............ 379New ................................................. 20New directory/New ........................... 20New document ................................. 16New layer ....................................... 224NEWCV ......................................... 247Next ............................................... 211Next Point ............................... 191, 195399
<strong>Topocad</strong>Next/Previous ................................. 211Number ..................................... 98, 126Number of decimals .......................... 35Number of divisions ........................ 188Numbering/coding ............................ 90OObject properties ............................ 227Object/s .......................................... 155Observation .................................... 120ODB .................................................. 84Offset ........................................ 12, 151Offset value to co-ordinates ............ 295On-Line ............................................. 22On-line-registration ........................... 22Open ........................................... 18, 84Expert ............................................ 84Orientation ...................................... 146Origo ............... 148, 191, 193, 195, 228select ........................................... 228PPage Down ....................................... 10Page Up ............................................ 10Parameters ..................................... 197Part ........................................... 16, 204<strong>Topocad</strong> ....................................... 16Paste ............................................. 216PC Card ......................................... 102Perpendicular snap, settings ........... 40Plot .................................................. 64Plot/print .......................................... 24Plotter/printer ................................... 24Plotting ............................................. 64attribute ...................................... 213clothoide ..................................... 143Convert symbols ........................ 162edit ............................................. 213existing ....................................... 252explodes ..................................... 202finds ........................................... 120Point Id ....................................... 213polyline ......................................... 12Select ......................................... 228type ............................................ 120use ............................................. 120want ............................................. 24Point Code ................ 44, 211, 213, 255Point code toolbars ........................ 255Point difference .............................. 186polyline ........................................ 204400
GlossaryPoint Id .... 44, 73, 84, 90, 94, 104, 120,126, 135, 138, 153, 186, 211, 213,301edit .............................................. 126Point ............................................ 213View .............................................. 73Point Info .................................... 44, 73Point Information .............................. 73explode ......................................... 73Point isn’t ........................................ 120Point size .......................................... 64Point style ......................................... 64Point/GEO ........................................ 84Points comparison .......................... 186Points/polyline ................................ 265Polar stake ...................................... 182Polar stake out ................................ 182Polygon............................................. 84Polygon Point ........................... 60, 120Polygon Point file .............. 60, 120, 126existing .......................................... 60Polyline .... 12, 135, 139, 141, 151, 152,201, 202, 203, 204, 205, 209, 211,265, 289draw ............................................ 135edit .............................................. 211end .............................................. 211explodes ..................................... 202extends ...................................... 203leave .......................................... 211Lengthens .................................. 205part ............................................. 204Point ............................................. 12splitting ....................................... 201trim ............................................. 204Polylines 12, 44, 78, 84, 151, 152, 155,199, 202, 203, 204, 211, 265editing ........................................ 211Port ......................................... 101, 102Portrait ............................................. 26PP ................................. 16, 60, 84, 126PP file ......................................... 50, 60PP-files ............................................ 16Preferences ................................... 146Presentation................................... 116survey data window .................... 116Press .......................... 7, 106, 135, 207Ctrl-key ........................................... 7F2 button .................................... 135Space bar ................................... 207Press Arrow Next ............................. 84Press Done ...................................... 84Press OK .................................. 84, 126401
<strong>Topocad</strong>Previous Point ................................ 211Previous/Next ................................. 126PRF .................................................. 84PRF Profile ..................................... 317PRG ................................................ 106Print .................................... 24, 64, 356volumes ....................................... 356Print out profile ............................... 168Print out sections ............................ 169Printer settings .................................. 26Pritn out cross sections................... 169Profile ....................................... 16, 297Profile file ........................................ 314Profile form in drawing .................... 168Profile TRP ..................................... 314Program/Sokkia/Mapsuite ................. 24Projections ...................................... 235Properties ....................................... 227PSI .................................................... 84Psion .................................. 83, 92, 101Connect ......................................... 92Export .......................................... 101QQuick list ........................................... 20Add ............................................... 20Delete ........................................... 20right .............................................. 20Quick profile ................................... 298RR 10Radius ............................................. 64Railroad settings .............................. 54Raster ..................................... 145, 221Raster image ................................. 221Raster model ................................. 272Read .............................................. 106Geodimeter ................................ 106Read only layer .............................. 224Ready ............................................ 135Receive ..................................... 92, 101Refraction setting ............................. 37Registration...................................... 22Relative .......................................... 333Relative Profile ............................... 333Remember Crossing window ........... 84Remove ......................................... 120Rename layer ................................ 224Report settings - folders ................... 41Result ............................................ 120back ........................................... 120402
GlossaryReturn ............................................... 19saved ............................................ 19Reverse objects .............................. 154Right ................................................. 20Quick list ....................................... 20Road ................. 84, 103, 108, 301, 314Road design, section template ....... 333road editor ...................................... 290Road geometry - drawing ............... 293Road Line ................................. 59, 292Road line - calculate points ............. 295Road line data ................................ 296Road line document ........................ 301road line editor ................................ 290Road line export till instrument ....... 108Road line manager ......................... 254Road line menu .............................. 289Road line, save ............................... 292Road line, section markers ............. 293Road profile ............................ 314, 317Road profile, print out ..................... 168Road profile|Import/Export .............. 317Roadline sections ........................... 293Roadline stake out .......................... 299Rotate ............................................. 193Rotate object.................................. 193SSave As ......................................... 301Save net adjustment ...................... 357Save polygon points ...................... 357Save road line ................................ 292Saved ......................................... 19, 84Return .......................................... 19Scale ............................... 195, 230, 250Scale import ................................... 112Screen ............................................. 38SDR/RDT ......................................... 84Section and offset towards road line................................................... 296Section markers, road line ............. 293Section Template ...................... 16, 333Section/offset .................. 289, 296, 301Section/offset to co-ordinates ........ 295Sections from road line .................. 293Sections in drawing ........................ 169See ................................................ 126See Explode3 ................................ 204See Free ........................................ 120See Traverse ................................. 126Select . 26, 44, 150, 155, 169, 197, 204,228, 261, 265403
<strong>Topocad</strong>Digital Terrain Model ................... 261dX ................................................. 44origo ............................................ 228Point ............................................ 228Select Auto ....................................... 24Select Base Point ... 150, 191, 193, 195Select button ..................................... 73Select colour ................................... 183Select DTM ..................................... 261Select Edit ...................................... 120Select FileImport|File ........................ 84Select Insertion Point .............. 146, 191Select Next Point .................... 150, 195Select object ............... 7, 191, 193, 195Select Organizer ............................. 108Select project .............................. 20, 84Select Start Point ............................ 146Select Survey|Calculate .................. 120Select View ..................................... 261Select Yes ...................................... 126Select/create ..................................... 84Send ....................... 101, 102, 103, 108Set out ............................................ 182Set out protocol .............................. 182Settings........................................... 120Settings, instrument ......................... 52Settings|Baseline ........................... 138Settings|Report .............................. 356Sheet import .................................... 48Sheet/Drawing sheet ..................... 164Shift ........................................ 211, 216Shift + Ctrl ........................................ 10Shift + F5 ......................................... 10Shift + L ........................................... 10Shift + U ........................................... 10Shift button .................................... 120Short .............................................. 152Short key F12 .................................. 18shortcut to point code .................... 255Show nodes ..................................... 78Simulation of net ............................ 357Simulation of net adjustment.......... 379Size .................................................. 24Skip Z ............................................ 265Slope ............................................. 126Slope Distance ............................... 126Slope hatches ................................ 149Snap ................................................ 12Sokkia ........................... 83, 84, 90, 100Export ......................................... 100404
GlossarySP ................................................... 247Space ............................................... 84Space bar ......................... 84, 199, 207press ........................................... 207Spline ............................................. 135Splines ............................................ 135Split DTM ........................................ 277Splitting ..................................... 75, 201polyline ........................................ 201Sprache ............................................ 43ST ................................................... 247Stake out ........................................ 182Stake out protocol ........................... 182Stand-alone .................................... 202Start ............................ 14, 84, 104, 106Line ............................................... 84Station .................................... 120, 126backsight ..................................... 126Station, Point .................................. 120Stretch ............................................ 206Stretch object .................................. 206Subdivide area ................................ 188Subdivide surface ........................... 188SUR ............ 16, 84, 90, 92, 94, 98, 126SUR file ............................................ 90Surface check ................................ 297Survey .................. 16, 60, 92, 120, 126Survey Data ............................ 120, 126Survey Data file ............................. 126Survey data window ....................... 116Presentation ............................... 116Survey data/drawing ........................ 84Survey data/drawing/Road line/Profile..................................................... 84Survey data|Administrative ............ 116Survey Type ................................... 120Survey|Construct ........................... 126Survey|Edit .................................... 120Survey|New ................................... 120Survey|Traverse ............................ 126Symbol with attribute ..................... 160Symbol, local/global ....................... 231Symbol/Line ................................... 252Symbols .................................. 155, 252Symbols in drawing ........................ 231System ........................................... 146System files ..................................... 62System|Attribute ............................ 250System|Control .............................. 247System|Symbols ............................ 252405
<strong>Topocad</strong>TTab ................................................... 84Tangent-tangent ............................. 143Tangent-tangent-radius .......... 139, 141help ..................................... 139, 141Tangent-tangent-radius The ... 139, 141Template, cross section .................. 333Terrain model, extract ..................... 277Terrain sections, volumes ............... 276Test of known points ....................... 357Text at contour lines ....................... 267Text on contours ............................. 270Theoretic cross section ................... 333Thermic colours .............................. 272These polylines ............................... 152three dimensions .............................. 79To/from ............................................. 16<strong>Topocad</strong> ........................................ 16Tolerance .......................................... 53Tolerance settings - folder ................ 41Toolbar ........................................... 255Toolbars ............................................ 63Toolbox ........................................... 141use .............................................. 141Toolbox Co-ordinates ............. 139, 141Toolbox|Co-ordinates ...................... 74TOP ...................................... 16, 84, 90Topcon ........................................... 114Toptrans ........................................ 114Track width ...................................... 54Transfer symbols ........................... 231Transform ............................... 120, 197Transform via Gtrans ..................... 219Transformation ............................... 197Traverse ........................................ 126Traverse|Add ................................. 126Traverse|Edit ................................. 126Trim ............................................... 204polyline ....................................... 204Trimble ........................................ 83, 98Trimble's file ..................................... 84TRL ................... 84, 101, 103, 108, 301TRP ................................ 101, 103, 314True Type ........................................ 44TRV ............................................... 126TST ................................................ 333TTR ......................................... 139, 141TTU .................................................. 16Type ........................................ 120, 169Point ........................................... 120406
GlossaryUU.D.S. ............................................. 106Use ............................................. 106Update DTM ................................... 278Upper/Ignore ................................... 250Use ......................... 106, 120, 141, 152Ctrl button ................................... 120Fillet ............................................ 152Point ............................................ 120Toolbox ....................................... 141U.D.S. ......................................... 106User Defined System ...................... 106VValue .............................. 191, 193, 195Base Point ................... 191, 193, 195Vertical............................................ 126Vertical Angle ................................. 126View .............. 63, 73, 82, 120, 138, 261Point Id .......................................... 73View Info ......................... 191, 193, 216View Info Command ....................... 213View Point ......................................... 73View/Drawing view ......................... 165View|Area ......................................... 77View|Coordinate ............................. 228View|Point ........................................ 73View|Show ....................................... 78View|Tool box|Co-ordinates ... 135, 138,228View|XYZ ......................................... 74Visible layer ................................... 224Volume ..................................... 16, 356Print ............................................ 356Volume by model calculation ......... 272Volume calculation sections frommodels ....................................... 276Volume model ................................ 272Volume model calculation .............. 272Volumes from model, by sections .. 276WWant ......................................... 24, 155Delete ......................................... 155Point ............................................. 24Warnings ......................................... 53Window ............................................ 82Windows ....................... 24, 63, 84, 103Windows 2000 ................................... 6Windows 95 ....................................... 6Windows ANSI ................................. 84Windows ANSI-file ........................... 84Windows NT 3.5 ................................ 6407
<strong>Topocad</strong>Windows XP ....................................... 6Wish ............................................... 261Delete .......................................... 261Workabout ...................................... 108Write ............................................... 144Write text ........................................ 144Wrong ............................................. 301XX-co-ordinate .................................... 84xref ................................................. 234XY or NE ........................................... 33YY-scales ......................................... 146ZZ difference DTM ->....................... 271Z value from DTM .......................... 271Z/Min Z .......................................... 265Z-co-ordinate ................................... 84Zoom ............................................... 10Zoom Previous ................................. 10Zoom Window .................................. 10Z-value ........................................... 162408
GlossaryAArcGIS: ArcGIS is applications from ESRI. <strong>Topocad</strong> communicates with the ArcGISapplications via the ArcSDE database interpretator and to the personal Geodatabase.CAD: Computer Aided Design, a common word for creation of intelligent drawings.DTM: Digital terrain model, a TIN (Triangular Irregular Network) built on points andpolylines and is a base for many different calculations in <strong>Topocad</strong>.CDGGPS: Global Positioning System, <strong>Topocad</strong> imports data from GPS systems, both inobservations and coordinates.ISM: Indepnedent Spatial Management, a specific application for communicationfrom and to <strong>Topocad</strong> to oracle Spatial database. ISM is an application fromSpatial Technology.I409