Operations and Financial Review - Mewah Group
Operations and Financial Review - Mewah Group
Operations and Financial Review - Mewah Group

You also want an ePaper? Increase the reach of your titles
YUMPU automatically turns print PDFs into web optimized ePapers that Google loves.
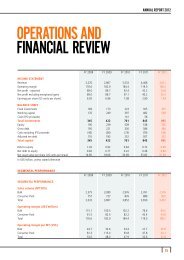
Building Capabilities<strong>Operations</strong> <strong>and</strong> <strong>Financial</strong> <strong>Review</strong>Destinations47%Ex Malaysia/Singapore53%Ex Malaysia / Singaporevs. Destination47% (FY 2010: 45%) ofsales directly to destinationmarkets other thanRest of Asia14%Middle East8% Rest of World7%Bulk Sales29% (FY 2010: 27%) of Bulksales directly to destinationmarkets other thanMalaysia/ Singapore71%MiddleEast22%Europe15%Africa24%Rest of World24%Destination SalesPacificOceania3%Americas3%Consumer Pack SalesMiddle East25%Well diversified salesthroughout the world withstrong presence in Africa<strong>and</strong> Middle EastRest of Asia27%60% (FY 2010: 71%) ofConsumer Pack sale toAfrica <strong>and</strong> Middle EastEurope contribution: 15%(FY 2010: 7%)Asia19%Well diversified sales revenueOur total sales revenue of US$4,468 million in 2011was 26.5% higher than last year on the back of higherselling prices. Sales revenue for the bulk segment grewby 24.6% <strong>and</strong> consumer pack segment registeredrevenue growth of 31.3%. Bulk segment contributed71.4% of total sales revenue, while Consumer Packsegment contributed 28.6% of the revenue.We strive to diversify our sales revenue across theglobe <strong>and</strong> our efforts continued in 2011. Mostof our bulk sales are made to customers withbilling address in Malaysia <strong>and</strong> Singapore, who inturn carry the products to destination markets.Consumer Pack sales are made largely directly todestination markets.In 2011, 47% of total sales were made to customerswith billing addresses of destination markets, i.e.countries other than Malaysia or Singapore, upfrom 45% last year.Of total destination sales, we were able to furtherdiversify our sales to Africa, Middle East, Rest of Asia<strong>and</strong> Rest of World contributing 24%, 25%, 27% <strong>and</strong>24% respectively, compared to 35%, 24%, 23% <strong>and</strong>18% respectively last year.For the Bulk segment, we achieved 29% sales todestination markets, up from 27% last year. For theConsumer Pack segment there were significantimprovements in sales to Middle East <strong>and</strong> Europewhich contributed 22% <strong>and</strong> 15% of the segmentsales compared to 15% <strong>and</strong> 7% respectively last year.Our reliance on Africa reduced from 56% to 38%.Africa38%23
<strong>Operations</strong> <strong>and</strong> <strong>Financial</strong> <strong>Review</strong>Operating MarginThe <strong>Group</strong> measures <strong>and</strong> tracks the performancein terms of Operating Margin per MT of salesvolume <strong>and</strong> resultant total operating margin. OM iscalculated as revenue, less cost of sales (excludingdepreciation), selling <strong>and</strong> distribution expenses <strong>and</strong>foreign exchange gains or losses.Operating Margin (US$ in Millions)176.6182.961.582.4184.482.2119.0Over the period of last five decades, we havedeveloped a proven integrated business model ofparticipating in the midstream <strong>and</strong> downstreamparts of the value chain in the attractive palmoil industry, built inherent operational flexibility,developed sound risk management practices, <strong>and</strong>established our own br<strong>and</strong>s <strong>and</strong> global distributioncapabilities that have helped us to deliver robust <strong>and</strong>consistent operating margins during all the ups <strong>and</strong>downs of economic cycles.79.639.939.7FY 2007115.1FY 2008Consumer PackBulk100.5FY 2009102.2FY 201042.476.6FY 2011For 2011, we achieved operating margin of US$32.6per MT, down from US$47.9 per MT achieved last year.Bulk division which consists mainly of refining <strong>and</strong>trading margin was more resilient achieving US$27.7per MT compared to US$34.4 per MT last year. Butthe margins for consumer pack division, that includebr<strong>and</strong>ing <strong>and</strong> distribution margins suffered more dueto macro economic conditions <strong>and</strong> tough marketconditions particularly in Africa. Under falling pricesconditions during the year, buyers at destinationmarkets ended up holding high priced inventories<strong>and</strong> resulted in losses. It prompted them to reduce<strong>and</strong> delay their purchases <strong>and</strong> also negotiate harderat the time of new purchases. Our joint venturecompany, through its subsidiary, being the importer<strong>and</strong> distributor of our consumer pack products in WestAfrica <strong>and</strong> other subsidiaries in Europe continued toexperience slow dem<strong>and</strong> resulting in higher inventorycarrying cost <strong>and</strong> pressure on margins. Resultantlyoperating margin of Consumer Pack division camedown to US$47.8 per MT compared to US$93.8per MT achieved last year. Bulk <strong>and</strong> Consumer Packsegments contributed 64.4% <strong>and</strong> 35.6% respectivelyof total operating margin.Bulk64.4%Operating Margin per MT (US$)SegmentalContributionin OperatingMarginConsumer Pack35.6%FY 2007 FY 2008 FY 2009 FY 2010 FY 2011Total 22.2 53.0 48.0 47.9 32.6Bulk 13.4 44.7 32.6 34.4 27.7Consumer Pack 65.6 81.3 113.4 93.8 47.824
Building Capabilities<strong>Operations</strong> <strong>and</strong> <strong>Financial</strong> <strong>Review</strong>Debt to equity <strong>and</strong> Net debt to equity1.211.04 1.030.920.820.770.640.720.46Strong Balance SheetThe <strong>Group</strong> was listed on the Mainboard of the (SGX-ST) on November 24, 2010 raising net proceedsof US$184 million, significantly strengthening ourbalance sheet to support our growth plans. Cash<strong>and</strong> cash equivalents remained healthy at US$136.8million, which includes unutilised IPO proceeds ofUS$58 million.FY 2007 FY 2008 FY 2009 FY 2010 FY 2011Cycle time17FY 2007Return on EquityROE8Debt to equityNet debt to equity1810FY 2008Adjusted for Readily Marketable InventoriesProfitmarginProfit after tax (2)_________________Sales revenue42.2_________________4,467.937FY 2009AssetturnoverSales revenue_________________Capital employed (3)4,467.9_________________844.8Notes1) ROE is based on opening Shareholders funds.2) Profit after tax attributable to equity holders of the Company.3) Capital employed = Total equity + Net DebtFY 2010LeverageCapital employed (3)_________________Shareholders’ equity844.8_________________507.78.3% 0.9% 5.3 times1.7 times27430.22234221FY 2011We manage our capital structure very actively bylooking at the debt to equity ratio, for the fixedinvestment, for current investment <strong>and</strong> total for thebusiness. Due to nature of investments, we targetto keep net debt to equity ratio to be less than1.0 for fixed investments, less than 2.0 for currentinvestments <strong>and</strong> less than 1.5 on overall basis. Wemaintained healthy debt to equity ratio of 0.72 or netdebt to equity ratio of 0.46 leaving enough scope toraise additional debt to support our growth plans.We maintain adequate working capital credit linesto support increased working capital requirementsresulting from market opportunities or increase inprices. Our target is to have utilisation to be less than75% of total credit lines available. During 2011, wehave further increased <strong>and</strong> diversified our borrowingto provide operational <strong>and</strong> financial flexibility. Ourcurrent working capital lines utilisation remains atvery comfortable 36% of total credit lines available.Our efficient, large scale, integrated productionfacilities <strong>and</strong> strong distribution network continuedto help us to keep our cycle time very short of 42days in 2011, similar to 43 days in 2010. ExcludingReadily Marketable Inventories, our cycle time wasonly 21 days, down from 23 days in 2010.Return on EquityWe achieved return on equity of 8.3% for FY2011.We actively strive to maximising the return on theequity by increasing our profit margin, increasingasset turnover <strong>and</strong> optimising leverage.25