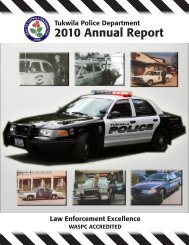
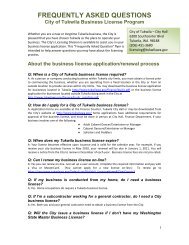
2013-2014 Biennial Budget <strong>City</strong> <strong>of</strong> <strong>Tukwila</strong>, Washington<strong>Tukwila</strong> School District5.1542%Flood Control0.121%Property Tax by JurisdictionHospital District0.504%<strong>City</strong> <strong>of</strong> <strong>Tukwila</strong>$2.9524%<strong>City</strong> <strong>of</strong> <strong>Tukwila</strong>WA StateKing County LibraryPort <strong>of</strong> SeattleEmergency Medical Service<strong>Tukwila</strong> School DistrictFlood ControlHospital DistrictEmergency Medical Service0.302%Port <strong>of</strong> Seattle0.232%King County Library0.575%WA State2.4220%Utility Tax (RCW 82.16)The <strong>City</strong> implemented a 6% solid waste tax and 10% interfund utility tax in 2009, which have sincebecome <strong>the</strong> <strong>City</strong>’s third largest tax revenue source at $5.8 million, or 9.7% in 2013, and $5.9 million in2014, or 10.5%, <strong>of</strong> <strong>the</strong> total revenue supporting <strong>the</strong> General Fund. The <strong>City</strong> <strong>of</strong> <strong>Tukwila</strong> has a 6% utilitytax on cable, electricity, telephones, cellular phones, natural gas, and garbage.Detail <strong>of</strong> Utility Tax Budget2013 2014Electric $ 1,620,240 $ 1,668,847Gas 688,840 709,505Solid Waste/Recycling 349,000 349,000Cable 230,000 230,000Telephone 1,400,000 1,400,000Utility Taxes 4,288,080 4,357,352Interfund Utilities 1,486,000 1,585,500Total Utility Taxes $ 5,774,080 $ 5,942,852O<strong>the</strong>r RevenuesIn addition to <strong>the</strong> three major revenue sources and o<strong>the</strong>r ongoing general fund revenue, <strong>the</strong> 2013-2014biennial budget also includes one-time revenue <strong>of</strong> $8.5 million in 2013 for Local Improvement District(LID) project cost reimbursement proceeds and anticipated property sales <strong>of</strong> $4.4 million in 2014. Thesefunds will be used for capital improvements throughout <strong>the</strong> <strong>City</strong>.Page 61
2013-2014 Biennial Budget <strong>City</strong> <strong>of</strong> <strong>Tukwila</strong>, Washington2013-2014 GENERAL FUND REVENUEGeneral Fund revenue for 2013 and 2014 excluding fund balances is $59.5 million and $56.4 millionrespectively; a 9.4% increase in 2013 from <strong>the</strong> 2011-2012 Adopted Budget and a -5.2% reduction in 2014over <strong>the</strong> 2013 proposed budget.General Fund Revenues2010 2010-2011 2011 2011-2012 2012 2012-2013 2013 2013-2014 2014General Fund Revenues Actual % Change Actual % Change Budget % Change Budget % Change BudgetREVENUESProperty Taxes $ 13,188,942 1.8% $ 13,427,445 3.3% $ 13,868,250 -0.4% $ 13,814,401 3.7% $ 14,321,617Sales and Use Taxes 10,294,939 56.5% 16,113,733 -6.6% 15,048,000 1.7% 15,298,721 2.5% 15,679,916RGRL Tax - 0.0% 1,641,239 20.3% 1,975,000 -11.4% 1,750,000 1.0% 1,767,500Admissions Tax 583,213 -11.9% 513,611 27.3% 654,000 -6.4% 612,000 0.0% 612,000Utility Taxes 4,063,953 -0.3% 4,052,264 19.4% 4,840,000 -11.4% 4,288,080 1.6% 4,357,352Interfund Utility Tax 1,497,782 -8.4% 1,372,380 11.0% 1,524,000 -2.5% 1,486,000 6.7% 1,585,500Excise Taxes 2,109,827 -27.8% 1,524,172 73.3% 2,641,303 -20.6% 2,097,274 5.2% 2,207,274Penalties/Interest 81 657.1% 616 -89.1% 67 0.0% 67 0.0% 67Tax Total 31,738,736 21.8% 38,645,460 4.9% 40,550,620 -3.0% 39,346,543 3.0% 40,531,227Business Licenses and Permits 550,416 20.6% 663,598 21.6% 807,227 -4.4% 772,089 1.0% 780,089Building Permits and Fees 1,068,414 9.4% 1,169,073 -5.8% 1,101,339 -0.6% 1,095,000 1.9% 1,116,100Licenses & Permits Total 1,618,830 13.2% 1,832,671 4.1% 1,908,566 -2.2% 1,867,089 1.6% 1,896,189Sales Tax Mitigation 1,239,127 -1.8% 1,217,418 -1.4% 1,200,000 -2.9% 1,165,641 2.9% 1,200,000Seattle <strong>City</strong> Light franchise fee 2,070,541 1.9% 2,109,617 -2.8% 2,050,000 7.6% 2,206,344 2.0% 2,250,471O<strong>the</strong>r State shared revenues 319,126 28.0% 408,639 -24.5% 308,504 1.4% 312,874 5.4% 329,860O<strong>the</strong>r intergovernmental 847,075 20.5% 1,020,359 -42.6% 585,643 92.3% 1,126,433 -35.0% 731,915Intergovernmental Total 4,475,869 6.3% 4,756,033 -12.9% 4,144,147 16.1% 4,811,292 -6.2% 4,512,246General Government 64,447 -18.8% 52,344 16.4% 60,951 -10.8% 54,363 0.0% 54,363Security 458,008 -6.0% 430,307 23.9% 533,134 8.7% 579,725 4.3% 604,725Engineering Services 6,200 11.6% 6,922 764.9% 59,867 -50.1% 29,867 0.0% 29,867Transportation 166,950 8.3% 180,789 -12.5% 158,149 5.6% 167,000 1.2% 169,000Plan Check and Review Fees 718,860 -23.1% 552,996 55.2% 858,500 -28.0% 618,500 1.6% 628,500Culture and Rec Fees 701,216 -18.8% 569,571 7.4% 611,500 -15.0% 519,755 0.0% 519,755Charges for Services Total 2,115,681 -15.3% 1,792,930 27.3% 2,282,101 -13.7% 1,969,210 1.9% 2,006,210Fines and Penalties Total 227,552 1.0% 229,907 -7.2% 213,270 10.1% 234,829 0.0% 234,829Miscellaneous Total 532,467 9.4% 582,694 3.4% 602,760 11.1% 669,375 0.6% 673,375Indirect Cost Allocation 2,396,806 -5.0% 2,276,584 29.3% 2,942,695 -30.8% 2,035,740 2.4% 2,085,208LID reimbursement proceeds - 0.0% - 0.0% - 0.0% 8,500,000 0.0% -Real Property sales - 0.0% 6,507 10234.0% 672,382 0.0% - 0.0% 4,355,000MPD Operating Loan payback - 0.0% - 0.0% - 0.0% 81,000 49.9% 121,457O<strong>the</strong>r Financing 159,884 -90.3% 15,468 7014.5% 1,100,500 0.0% - 0.0% -O<strong>the</strong>r Sources Total 2,556,690 -10.1% 2,298,559 105.2% 4,715,577 125.1% 10,616,740 -38.2% 6,561,665Total Revenues & Transfers $ 43,265,826 15.9% $ 50,138,254 8.5% $ 54,417,041 9.4% $ 59,515,079 -5.2% $ 56,415,741Page 62
- Page 1:
City of Tukwila, Washington2013-201
- Page 4 and 5:
2013-2014 Biennial Budget City of T
- Page 6 and 7:
2013-2014 Biennial Budget City of T
- Page 8 and 9:
2013-2014 Biennial Budget City of T
- Page 10 and 11:
2013-2014 Biennial Budget City of T
- Page 12 and 13: 2013-2014 Biennial Budget City of T
- Page 14 and 15: 2013-2014 Biennial Budget City of T
- Page 16 and 17: 2013-2014 Biennial Budget City of T
- Page 18 and 19: 2013-2014 Biennial Budget City of T
- Page 20 and 21: 2013-2014 Biennial Budget City of T
- Page 22 and 23: 2013-2014 Biennial Budget City of T
- Page 24 and 25: 2013-2014 Biennial Budget City of T
- Page 26 and 27: 2013-2014 Biennial Budget City of T
- Page 28 and 29: 2013-2014 Biennial Budget City of T
- Page 30 and 31: 2013-2014 Biennial Budget City of T
- Page 32 and 33: 2013-2014 Biennial Budget City of T
- Page 34 and 35: 2013-2014 Biennial Budget City of T
- Page 36 and 37: 2013-2014 Biennial Budget City of T
- Page 38 and 39: 2013-2014 Biennial Budget City of T
- Page 40 and 41: 2013-2014 Biennial Budget City of T
- Page 42 and 43: 2013-2014 Biennial Budget City of T
- Page 44 and 45: 2013-2014 Biennial Budget City of T
- Page 46 and 47: 2013-2014 Biennial Budget City of T
- Page 48 and 49: 2013-2014 Biennial Budget City of T
- Page 50 and 51: 2013-2014 Biennial Budget City of T
- Page 52 and 53: 2013-2014 Biennial Budget City of T
- Page 54 and 55: 2013-2014 Biennial Budget City of T
- Page 56 and 57: 2013-2014 Biennial Budget City of T
- Page 58 and 59: 2013-2014 Biennial Budget City of T
- Page 60 and 61: 2013-2014 Biennial Budget City of T
- Page 64 and 65: 2013-2014 Biennial Budget City of T
- Page 66 and 67: 2013-2014 Biennial Budget City of T
- Page 68 and 69: 2013-2014 Biennial Budget City of T
- Page 70 and 71: 2013-2014 Biennial Budget City of T
- Page 72 and 73: 2013-2014 Biennial Budget City of T
- Page 74 and 75: 2013-2014 Biennial Budget City of T
- Page 76 and 77: 2013-2014 Biennial Budget City of T
- Page 78 and 79: 2013-2014 Biennial Budget City of T
- Page 80 and 81: 2013-2014 Biennial Budget City of T
- Page 82 and 83: 2013-2014 Biennial Budget City of T
- Page 84 and 85: 2013-2014 Biennial Budget City of T
- Page 86 and 87: 2013-2014 Biennial Budget City of T
- Page 88 and 89: 2013-2014 Biennial Budget City of T
- Page 90 and 91: 2013-2014 Biennial Budget City of T
- Page 92 and 93: 2013-2014 Biennial Budget City of T
- Page 94 and 95: 2013-2014 Biennial Budget City of T
- Page 96 and 97: 2013-2014 Biennial Budget City of T
- Page 98 and 99: 2013-2014 Biennial Budget City of T
- Page 100 and 101: 2013-2014 Biennial Budget City of T
- Page 102 and 103: 2013-2014 Biennial Budget City of T
- Page 104 and 105: 2013-2014 Biennial Budget City of T
- Page 106 and 107: 2013-2014 Biennial Budget City of T
- Page 108 and 109: 2013-2014 Biennial Budget City of T
- Page 110 and 111: 2013-2014 Biennial Budget City of T
- Page 112 and 113:
2013-2014 Biennial Budget City of T
- Page 114 and 115:
2013-2014 Biennial Budget City of T
- Page 116 and 117:
2013-2014 Biennial Budget City of T
- Page 118 and 119:
2013-2014 Biennial Budget City of T
- Page 120 and 121:
2013-2014 Biennial Budget City of T
- Page 122 and 123:
2013-2014 Biennial Budget City of T
- Page 124 and 125:
2013-2014 Biennial Budget City of T
- Page 126 and 127:
2013-2014 Biennial Budget City of T
- Page 128 and 129:
2013-2014 Biennial Budget City of T
- Page 130 and 131:
2013-2014 Biennial Budget City of T
- Page 132 and 133:
2013-2014 Biennial Budget City of T
- Page 134 and 135:
2013-2014 Biennial Budget City of T
- Page 136 and 137:
2013-2014 Biennial Budget City of T
- Page 138 and 139:
2013-2014 Biennial Budget City of T
- Page 140 and 141:
2013-2014 Biennial Budget City of T
- Page 142 and 143:
2013-2014 Biennial Budget City of T
- Page 144 and 145:
2013-2014 Biennial Budget City of T
- Page 146 and 147:
2013-2014 Biennial Budget City of T
- Page 148 and 149:
2013-2014 Biennial Budget City of T
- Page 150 and 151:
2013-2014 Biennial Budget City of T
- Page 152 and 153:
2013-2014 Biennial Budget City of T
- Page 154 and 155:
2013-2014 Biennial Budget City of T
- Page 156 and 157:
2013-2014 Biennial Budget City of T
- Page 158 and 159:
2013-2014 Biennial Budget City of T
- Page 160 and 161:
2013-2014 Biennial Budget City of T
- Page 162 and 163:
2013-2014 Biennial Budget City of T
- Page 164 and 165:
2013-2014 Biennial Budget City of T
- Page 166 and 167:
2013-2014 Biennial Budget City of T
- Page 168 and 169:
2013-2014 Biennial Budget City of T
- Page 170 and 171:
2013-2014 Biennial Budget City of T
- Page 172 and 173:
2013-2014 Biennial Budget City of T
- Page 174 and 175:
2013-2014 Biennial Budget City of T
- Page 176 and 177:
2013-2014 Biennial Budget City of T
- Page 178 and 179:
2013-2014 Biennial Budget City of T
- Page 180 and 181:
2013-2014 Biennial Budget City of T
- Page 182 and 183:
2013-2014 Biennial Budget City of T
- Page 184 and 185:
2013-2014 Biennial Budget City of T
- Page 186 and 187:
2013-2014 Biennial Budget City of T
- Page 188 and 189:
2013-2014 Biennial Budget City of T
- Page 190 and 191:
2013-2014 Biennial Budget City of T
- Page 192 and 193:
2013-2014 Biennial Budget City of T
- Page 194 and 195:
2013-2014 Biennial Budget City of T
- Page 196 and 197:
2013-2014 Biennial Budget City of T
- Page 198 and 199:
2013-2014 Biennial Budget City of T
- Page 200 and 201:
2013-2014 Biennial Budget City of T
- Page 202 and 203:
2013-2014 Biennial Budget City of T
- Page 204 and 205:
2013-2014 Biennial Budget City of T
- Page 206 and 207:
2013-2014 Biennial Budget City of T
- Page 208 and 209:
2013-2014 Biennial Budget City of T
- Page 210 and 211:
2013-2014 Biennial Budget City of T
- Page 212 and 213:
2013-2014 Biennial Budget City of T
- Page 214 and 215:
2013-2014 Biennial Budget City of T
- Page 216 and 217:
2013-2014 Biennial Budget City of T
- Page 218 and 219:
2013-2014 Biennial Budget City of T
- Page 220 and 221:
2013-2014 Biennial Budget City of T
- Page 222 and 223:
2013-2014 Biennial Budget City of T
- Page 224 and 225:
2013-2014 Biennial Budget City of T
- Page 226 and 227:
2013-2014 Biennial Budget City of T
- Page 228 and 229:
2013-2014 Biennial Budget City of T
- Page 230 and 231:
2013-2014 Biennial Budget City of T
- Page 232 and 233:
2013-2014 Biennial Budget City of T
- Page 234 and 235:
2013-2014 Biennial Budget City of T
- Page 236 and 237:
2013-2014 Biennial Budget City of T
- Page 238 and 239:
2013-2014 Biennial Budget City of T
- Page 240 and 241:
2013-2014 Biennial Budget City of T
- Page 242 and 243:
2013-2014 Biennial Budget City of T
- Page 244 and 245:
2013-2014 Biennial Budget City of T
- Page 246 and 247:
2013-2014 Biennial Budget City of T
- Page 248 and 249:
2013-2014 Biennial Budget City of T
- Page 250 and 251:
2013-2014 Biennial Budget City of T
- Page 252 and 253:
2013-2014 Biennial Budget City of T
- Page 254 and 255:
2013-2014 Biennial Budget City of T
- Page 256 and 257:
2013-2014 Biennial Budget City of T
- Page 258 and 259:
2013-2014 Biennial Budget City of T
- Page 260 and 261:
2013-2014 Biennial Budget City of T
- Page 262 and 263:
2013-2014 Biennial Budget City of T
- Page 264 and 265:
2013-2014 Biennial Budget City of T
- Page 266 and 267:
2013-2014 Biennial Budget City of T
- Page 268 and 269:
2013-2014 Biennial Budget City of T
- Page 270 and 271:
2013-2014 Biennial Budget City of T
- Page 272 and 273:
2013-2014 Biennial Budget City of T
- Page 274 and 275:
2013-2014 Biennial Budget City of T
- Page 276 and 277:
2013-2014 Biennial Budget City of T
- Page 278 and 279:
2013-2014 Biennial Budget City of T
- Page 280 and 281:
2013-2014 Biennial Budget City of T
- Page 282 and 283:
2013-2014 Biennial Budget City of T
- Page 284 and 285:
2013-2014 Biennial Budget City of T
- Page 286 and 287:
2013-2014 Biennial Budget City of T
- Page 288 and 289:
2013-2014 Biennial Budget City of T
- Page 290 and 291:
2013-2014 Biennial Budget City of T
- Page 292 and 293:
2013-2014 Biennial Budget City of T
- Page 294 and 295:
2013-2014 Biennial Budget City of T
- Page 296 and 297:
2013-2014 Biennial Budget City of T
- Page 298 and 299:
2013-2014 Biennial Budget City of T
- Page 300 and 301:
2013-2014 Biennial Budget City of T
- Page 302 and 303:
2013-2014 Biennial Budget City of T
- Page 304 and 305:
2013-2014 Biennial Budget City of T
- Page 306 and 307:
2013-2014 Biennial Budget City of T
- Page 308 and 309:
2013-2014 Biennial Budget City of T
- Page 310 and 311:
2013-2014 Biennial Budget City of T
- Page 312 and 313:
2013-2014 Biennial Budget City of T
- Page 314 and 315:
2013-2014 Biennial Budget City of T
- Page 316 and 317:
2013-2014 Biennial Budget City of T
- Page 318 and 319:
2013-2014 Biennial Budget City of T
- Page 320 and 321:
2013-2014 Biennial Budget City of T
- Page 322 and 323:
2013-2014 Biennial Budget City of T
- Page 324 and 325:
2013-2014 Biennial Budget City of T
- Page 326 and 327:
2013-2014 Biennial Budget City of T
- Page 328 and 329:
2013-2014 Biennial Budget City of T
- Page 330 and 331:
2013-2014 Biennial Budget City of T
- Page 332 and 333:
2013-2014 Biennial Budget City of T
- Page 334 and 335:
2013-2014 Biennial Budget City of T
- Page 336 and 337:
2013-2014 Biennial Budget City of T
- Page 338 and 339:
2013-2014 Biennial Budget City of T
- Page 340 and 341:
2013-2014 Biennial Budget City of T
- Page 342 and 343:
2013-2014 Biennial Budget City of T
- Page 344 and 345:
2013-2014 Biennial Budget City of T
- Page 346 and 347:
2013-2014 Biennial Budget City of T
- Page 348 and 349:
2013-2014 Biennial Budget City of T
- Page 350 and 351:
2013-2014 Biennial Budget City of T
- Page 352 and 353:
2013-2014 Biennial Budget City of T
- Page 354 and 355:
2013-2014 Biennial Budget City of T
- Page 356 and 357:
2013-2014 Biennial Budget City of T
- Page 358 and 359:
City of TukwilaCapital Improvement
- Page 360 and 361:
City of TukwilaCapital Improvement
- Page 362 and 363:
2013-2014 Biennial Budget City of T
- Page 364 and 365:
2013-2014 Biennial Budget City of T
- Page 366 and 367:
2013-2014 Biennial Budget City of T
- Page 368 and 369:
2013-2014 Biennial Budget City of T
- Page 370 and 371:
2013-2014 Biennial Budget City of T
- Page 372 and 373:
2013-2014 Biennial Budget City of T
- Page 374 and 375:
2013-2014 Biennial Budget City of T
- Page 376 and 377:
2013-2014 Biennial Budget City of T
- Page 378 and 379:
2013-2014 Biennial Budget City of T
- Page 380 and 381:
2013-2014 Biennial Budget City of T
- Page 382 and 383:
2013-2014 Biennial Budget City of T