A Socio-Economic Baseline Survey of Communities - Nature Uganda
A Socio-Economic Baseline Survey of Communities - Nature Uganda
A Socio-Economic Baseline Survey of Communities - Nature Uganda

You also want an ePaper? Increase the reach of your titles
YUMPU automatically turns print PDFs into web optimized ePapers that Google loves.
A SOCIO-ECONOMIC BASELINE SURVEY OFCOMMUNITIES ADJACENT TO LAKE BISINA/OPETAAND LAKE MBURO/NAKIVALI WETLAND SYSTEMS2010A <strong>Socio</strong>-<strong>Economic</strong> <strong>Baseline</strong> <strong>Survey</strong> <strong>of</strong> <strong>Communities</strong>Adjacent to Lake Bisina/Opeta and Lake Mburo/Nakivali Wetland SystemsA
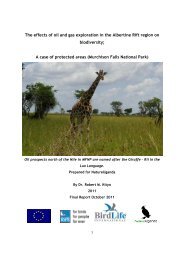
Cover Photo: Multiple wetland resource uses on Lake Bisina wetlandsin Katakwi District – a challenge to sustainable exploitation amidstcompeting resource uses.BA <strong>Socio</strong>-<strong>Economic</strong> <strong>Baseline</strong> <strong>Survey</strong> <strong>of</strong> <strong>Communities</strong>Adjacent to Lake Bisina/Opeta and Lake Mburo/Nakivali Wetland Systems
A SOCIO-ECONOMIC BASELINE SURVEY OFCOMMUNITIES ADJACENT TO LAKE BISINA/OPETAAND LAKE MBURO/NAKIVALI WETLAND SYSTEMSProviding baseline information for the implementation <strong>of</strong> theCOBWEB project in Western and Eastern/North-Eastern <strong>Uganda</strong>Compiled byIvan AmanigaRuhangaLucy IyangoContributing authorsJulius Mafumbo, Wetlands Management Department, MWEMark Jordahl, <strong>Uganda</strong> Wildlife SocietyJuliet Nabulumbi, <strong>Uganda</strong> Wildlife SocietyJoseph Mwesigye, Isingiro District Local GovernmentSarah Madanda, Sironko District Local GovernmentJames Malinga, Bukedea District Local GovernmentBernard Arinaitwe, Wetlands Management Department - MWERobert Bagyenda, International Union for Conservation <strong>of</strong> <strong>Nature</strong>A <strong>Socio</strong>-<strong>Economic</strong> <strong>Baseline</strong> <strong>Survey</strong> <strong>of</strong> <strong>Communities</strong>Adjacent to Lake Bisina/Opeta and Lake Mburo/Nakivali Wetland Systemsi
iiA <strong>Socio</strong>-<strong>Economic</strong> <strong>Baseline</strong> <strong>Survey</strong> <strong>of</strong> <strong>Communities</strong>Adjacent to Lake Bisina/Opeta and Lake Mburo/Nakivali Wetland Systems
AcknowledgmentsThe importance <strong>of</strong> wetlands in <strong>Uganda</strong> and world over has been emphasized.The COBWEB project seeks to bring together all stakeholders in an effort torevive the enjoyment <strong>of</strong> wetland goods and ecological services for the good<strong>of</strong> humans and the environment. The socio-economic survey was conductedto generate baseline data on community, its livelihood base, institutional andlegal issues in order to create a foundation upon which to gauge progress and toevaluate impact at the end <strong>of</strong> the four year period <strong>of</strong> the COBWEB project.The IUCN, <strong>Uganda</strong> Wildlife Society/<strong>Nature</strong> <strong>Uganda</strong> and Wetlands ManagementDepartment present this survey report conducted under the COBWEB project inEastern and Western <strong>Uganda</strong>. First all, we thank the United Nations DevelopmentProgramme (UNDP) for their continued support and specifically for funding thisproject, which made it possible for this study to be undertaken.Our sincere appreciation to all the respondents in the survey areas for sharinginformation and their invaluable ideas, but also for their heartiest cooperationduring our field visits. The authors deem their heartfelt gratitude to all DistrictEnvironment/Wetland Officers who took <strong>of</strong>f time to guide the survey team intheir respective districts.Special thanks go to the IUCN staff in <strong>Uganda</strong> for doing a commendable jobin coordinating the logistics for fieldwork in a pr<strong>of</strong>essional manner as well astheir continuous guidance to the survey team both in Kampala and the districtsconsidered for COBWEB activity implementation. Without you exhibiting thislevel <strong>of</strong> commitment, we would never have had this product in a timely andexcellent shape.We are greatly indebted to the survey team for their devotion even amidst theirbusy schedules. Without your support, efforts to make this survey a success wouldhave been elusive. Thanks to the survey team including Ivan AmanigaRuhanga,Julius Mafumbo, Mark Jordahl, Juliet Nabulumbi, Tim Osire Frankie, SarahMadanda, James Malinga, Bernard Arinaitwe and Joseph Mwesigye.A <strong>Socio</strong>-<strong>Economic</strong> <strong>Baseline</strong> <strong>Survey</strong> <strong>of</strong> <strong>Communities</strong>Adjacent to Lake Bisina/Opeta and Lake Mburo/Nakivali Wetland Systemsiii
Table <strong>of</strong> ContentsAcknowledgmentsList <strong>of</strong> TablesList <strong>of</strong> figuresList <strong>of</strong> photographsList <strong>of</strong> AcronymsExecutive SummaryKey <strong>Survey</strong> Findings – a summaryiiiviviiviiiixxxi1.0 PREAMBLE 11.1 Background 11.2 Objectives <strong>of</strong> the survey 21.2.1 Broad objectives 212.2 Specific objectives 21.3 Specific tasks 21.3 Expected Outputs 32.0 SURVEY MATERIALS AND METHODS 42.1 Sampling procedure 42.2 Data collection methods 62.2.1 Questionnaires 62.2.2 Literature review 62.2.3 Focus Group Discussions 62.3 Data processing and analysis 62.4 Quality control 73.0 SURVEY FINDINGS: PRESENTATION AND DISCUSSION 83.1 Description <strong>of</strong> survey area 83.1.1 Lake Opeta – Bisina Wetlands 8a) Bukedea District 10b) Sironko District 11c) Kumi District 11d) Soroti District 12e) Katakwi District 12f) Nakapiripiriti District 123.1.2 Lake Mburo – Nakivali Wetlands 13a) Mbarara District 15b) Isingiro District 15c) Kiruhura District 15d) Rakai District 163.2 Basic socio-economic and demographic features <strong>of</strong> respondents 16ivA <strong>Socio</strong>-<strong>Economic</strong> <strong>Baseline</strong> <strong>Survey</strong> <strong>of</strong> <strong>Communities</strong>Adjacent to Lake Bisina/Opeta and Lake Mburo/Nakivali Wetland Systems
3.2.1 Position <strong>of</strong> respondents in households and communities 163.2.2 Education level 183.2.3 Sex <strong>of</strong> respondents 183.2.4 Age 193.2.5 Settlement 203.2.6 Ethnicity and ethnic groups 213.2.7 Household size 223.2.8 Wealth status 233.3 <strong>Economic</strong>s and Livelihoods <strong>of</strong> Households in the COBWEBProject Sites 243.3.1 Sources <strong>of</strong> income in Lake Opeta-Bisina area 243.3.1 Sources <strong>of</strong> income in Lake Opeta-Bisina area 18i) Sironko District 25ii) Bukedea District 26iii) Kumi District 27iv) Soroti District 29v) Katakwi District 29vi) Nakapiripiriti District 303.3.2 Sources <strong>of</strong> income in Lake Mburo-Nakivali area 32a) Mbarara District 33b) Isingiro District 34c) Rakai District 35d) Kiruhura District 353.4 Value attachment to wetlands 383.4.1 What drives people into the wetlands? 403.4.2 Viability <strong>of</strong> alternatives 403.4.3 Interventions to ensure sustainable utilization <strong>of</strong> wetlands 413.4.4 Community training needs 423.5 Factors affecting communities in surveyed areas 444.0 RCOMMENDATIONS 454.0 Interventions/recommendations to address the emerging issues 465.0 CONCLUSIONS 49REFERENCES 50APPENDICES 51Appendix I: Indicators generated to monitor progress in achievingthe project aim, objectives and outcomes 51Appendix II: Wealth categorization criterion 52Appendix III: Sub-counties sampled for the survey in the project sites 53Appendix IV: <strong>Survey</strong> instrument used during the field interactions 54A <strong>Socio</strong>-<strong>Economic</strong> <strong>Baseline</strong> <strong>Survey</strong> <strong>of</strong> <strong>Communities</strong>Adjacent to Lake Bisina/Opeta and Lake Mburo/Nakivali Wetland Systemsv
List <strong>of</strong> TablesTable 1: The position <strong>of</strong> respondents within the households interviewedTable 2: Education level <strong>of</strong> Household Head by systemTable 3: Showing age distribution <strong>of</strong> respondents in the survey areaTable 4: Ethnic groups in the survey areaTable 5: Sources <strong>of</strong> income for communities around Lake Bisina-OpetasystemTable 6: Sources <strong>of</strong> income for communities around Lake Mburo-NakivalisystemTable 7: Sources <strong>of</strong> income aroung Bisina-Opeta * Sources <strong>of</strong> income aroundMburo-Nakivali; a cross-tabulationTable 8: Correlating sources <strong>of</strong> income in the different project sites to establishthe possibility <strong>of</strong> a relationshipTable 9: Ranking the occupations/sources <strong>of</strong> household income for thesurveyed householdsTable 10: Showing responses to wetland products communities highlightedTable 11: Aspects in which communities need trainingviA <strong>Socio</strong>-<strong>Economic</strong> <strong>Baseline</strong> <strong>Survey</strong> <strong>of</strong> <strong>Communities</strong>Adjacent to Lake Bisina/Opeta and Lake Mburo/Nakivali Wetland Systems
List <strong>of</strong> figuresFig 1:Fig 2:Fig 3:Fig 4:Fig 5:Fig 6:Fig 7:Fig 8:Fig 9:Fig 10:Sampling procedureDistribution <strong>of</strong> respondents according to genderSex <strong>of</strong> respondentsLength <strong>of</strong> stay in the survey areaSize <strong>of</strong> sampled households in the survey areasNumbers <strong>of</strong> domestic animals in the possession <strong>of</strong> households in thesurvey areasSources <strong>of</strong> income in communities around Lake Bisina-Opeta siteCompeting wetland uses: a recipe for conflictsMain sources <strong>of</strong> income in the communities around Lake Mburo–Nakivali siteSome community needs only satisfied by wetlandsA <strong>Socio</strong>-<strong>Economic</strong> <strong>Baseline</strong> <strong>Survey</strong> <strong>of</strong> <strong>Communities</strong>Adjacent to Lake Bisina/Opeta and Lake Mburo/Nakivali Wetland Systemsvii
List <strong>of</strong> photographsCover photo: Showing competing wetland uses between fishing, domesticwater uses, cattle watering, all <strong>of</strong> them at the same pointPhoto 2: Wetland contamination/pollution: Local alcohol brewingcontainers in a wetland from where the local brew is preparedand cooled in Mukura S/C, Kumi districtPhoto 3:Photo 5:Photo 6:Photo7:A group <strong>of</strong> respondents with researchers in Namalu S/C,Nakapiripirit District ManagementThe wetland in Korir S/C, Bukedea district is used to connect toLake Bisina for water transportRice growing in wetlands in Bunambutye S/C, Sironko DistrictJulius Mafumbo (WMD) in an interview with community membersin Kapujan S/C in Katakwi districtviiiA <strong>Socio</strong>-<strong>Economic</strong> <strong>Baseline</strong> <strong>Survey</strong> <strong>of</strong> <strong>Communities</strong>Adjacent to Lake Bisina/Opeta and Lake Mburo/Nakivali Wetland Systems
List <strong>of</strong> AcronymsCOBWEBCWMPDDPDWOEIAENRSDPIBAIUCNLGMDGMEANEMANRMPAPITPWDSDPUBOSUGXUNDPUWSWMDWSSPCommunity Based Wetland Biodiversity conservation ProjectCommunity-based Wetland Management PlanDistrict Development PlanDistrict Wetlands OfficerEnvironmental Impact AssessmentEnvironment and Natural ResourcesSub-county Development PlanImportant Bird AreaInternational Union for Conservation <strong>of</strong> <strong>Nature</strong>Local GovernmentMillennium Development GoalsMillennium Ecosystem AssessmentNational Environment Management AuthorityNatural Resources ManagementProtected AreaProject Implementation TeamPersons With DisabilitiesSub-county Development Plan<strong>Uganda</strong> Bureau <strong>of</strong> Statistics<strong>Uganda</strong> ShillingsUnited Nations Development Programme<strong>Uganda</strong> Wildlife SocietyWetlands Management DepartmentWetland Sector Strategic PlanA <strong>Socio</strong>-<strong>Economic</strong> <strong>Baseline</strong> <strong>Survey</strong> <strong>of</strong> <strong>Communities</strong>Adjacent to Lake Bisina/Opeta and Lake Mburo/Nakivali Wetland Systemsix
Executive Summary<strong>Uganda</strong> covers a total area <strong>of</strong> about 241500 sq. km, <strong>of</strong> which 30105 sq. km arewetlands (NEMA 2000). The Ramsar Convention <strong>of</strong> 1971 defines wetlands as“areas <strong>of</strong> marsh, fen, peat land or water whether artificial or natural, permanentor seasonal with water that is static or flowing, fresh, brackish or salt, includingareas <strong>of</strong> marine water the depth <strong>of</strong> which at low tide does not exceed 6meters.”Wetlands represent one <strong>of</strong> the vital natural resources <strong>Uganda</strong> is endowed with.They provide ecological services (climate modification, water purification, wastewater treatment, flood control and water storage and distribution in space andtime); direct uses such as water for domestic purposes, livestock watering, source<strong>of</strong> fish, medicinal plants and animals and various materials. Although the overallvalue <strong>of</strong> wetlands in <strong>Uganda</strong> has not been quantified, it is clear that they havevital attributes such as biological diversity, gene pool research materials, culturalvalues and aesthetic values. They are among the most productive ecosystemsand directly or indirectly support millions <strong>of</strong> people and provide goods andservices to them. They facilitate important processes like the movement <strong>of</strong> waterinto streams and oceans; decay <strong>of</strong> organic matter; release <strong>of</strong> nitrogen, sulfur, andcarbon into the atmosphere; removal <strong>of</strong> nutrients, sediment and organic matterfrom water moving into the wetland; and the growth and development <strong>of</strong> allorganisms dependent on them. The direct benefits <strong>of</strong> wetlands are in the form<strong>of</strong> products such as fish, agriculture, fuelwood, recreation and water supply,etc. and their indirect benefits arise from functions performed by the ecosystemsuch as flood control, ground water recharge and storm protection. They aredynamic ecosystems, continually undergoing natural changes due to infillingwith sediments and nutrients, subsidence, rise in sea level, etc. They sustain alllife and perform some useful functions in the maintenance <strong>of</strong> overall balance<strong>of</strong> nature.Rapid urbanisation, reducing soil fertility, effects <strong>of</strong> climate change, increasinghuman population and their various activities have contributed to the decline <strong>of</strong>quality and quantity <strong>of</strong> wetlands due to pressure beyond the ecosystem carryingcapacity. Hence, it is imperative to focus on conservation <strong>of</strong> these endangeredhabitats to achieve ecological sustainability.This study was undertaken to identify and analyze the socio-economic aspects<strong>of</strong> communities adjacent to wetlands in COBWEB implementation areas. Assuch, ten (10) districts Kumi, Bukedea, Soroti, Sironko, Katakwi, Nakapiripiritand Mbarara, Kiruhura, Isingoro, Rakai, which are adjacent to the two wetlandxA <strong>Socio</strong>-<strong>Economic</strong> <strong>Baseline</strong> <strong>Survey</strong> <strong>of</strong> <strong>Communities</strong>Adjacent to Lake Bisina/Opeta and Lake Mburo/Nakivali Wetland Systems
systems <strong>of</strong> Lake Mburo-Nakivali in Western <strong>Uganda</strong> and Lake Opeta-Bisina inEastern and parts <strong>of</strong> North-Eastern <strong>Uganda</strong> respectively for the baseline. Thisreport provides the ‘before project’ situation as well as data to be used forproject impact monitoring.The findings <strong>of</strong> the study indicate that the surrounding communities are largelydependent on wetlands as the main source <strong>of</strong> income and food security, althoughin varying degrees in the direct, indirect, option and existence values/benefitsto the communities. It also indicates that the ecological services availed bywetlands include the long lake shoreline <strong>of</strong> water, aquatic resources and moistsoils to many, barrier against erosion and siltation <strong>of</strong> water (water purification),water storage, habitat to biodiversity where dense covers <strong>of</strong> papyrus, Typha,Vossia and Phragmites under moist cover provide zones <strong>of</strong> food, reproduction,rest and passage for fish, birds and mammals. Additionally, the wetland systemsare the main sources <strong>of</strong> water, provide the trans-boundary water transport facility,fishing and recreation ground (swimming) to many. To the riparian communityand beyond, fish/fishing is an important source <strong>of</strong> food/proteins, income andrecreation. The terrestrial and wetland areas are cultivated with food cropse.g. rice, beans, maize, sorghum, cassava and bananas, sweet potatoes, Irishpotatoes, ground nuts, soya beans, vegetables and fruits, animals are also keptand they include cattle, goats and sheep.Key <strong>Survey</strong> Findings – a summary• Wetlands provide the basic means <strong>of</strong> survival to the majority <strong>of</strong> thehouseholds in Eastern and Western <strong>Uganda</strong>.• There are a number <strong>of</strong> wetland resource conflicts that impedeconservation efforts.• The level <strong>of</strong> awareness about the importance <strong>of</strong> wetland conservationis slowly growing but is not yet adequate.• A number <strong>of</strong> community wetland activities are not necessarilyecologically acceptable and pose a variety <strong>of</strong> conservationchallenges.• Stakeholder roles in wetland resources management are not clearlydelineated.• More than 90 percent <strong>of</strong> the respondents were found to be engaged inwetland-supported farming and petty trade.• The appreciation <strong>of</strong> the regulating services <strong>of</strong> wetlands is stillinadequate amongst local communities.• The two survey areas were over populated in some parts and had anumber <strong>of</strong> human activity with the associated ecological footprint.A <strong>Socio</strong>-<strong>Economic</strong> <strong>Baseline</strong> <strong>Survey</strong> <strong>of</strong> <strong>Communities</strong>Adjacent to Lake Bisina/Opeta and Lake Mburo/Nakivali Wetland Systemsxi
• Former predominantly pastoral communities in the Karamoja regionare gradually turning to cultivation, thus increasing the pressure onwetlands.• Wetland issues do not feature prominently in Local Governmentplanning whether at district or sub-county level• <strong>Communities</strong> do not have viable alternative sources <strong>of</strong> products andservices they obtain from wetlands.• There is a total lack <strong>of</strong> incentives for wetland resources conservation(especially) at community level• Respondents think that proper boundary marking and a stronggovernance infrastructure will go a long way in securing wetlandsanity while at the same time maximizing community benefits.Further, the analysis <strong>of</strong> data collected indicates total dependency <strong>of</strong> 78%, 18%moderate and 4% less with a variety <strong>of</strong> livelihood activities including cultivation(54%), cattle keeping (28%), crafts making (4%), fishing (7%), brick making(4%) and firewood collection at 3%. Against this background, the economicvalue <strong>of</strong> wetlands to the neighbouring communities cannot be underrated. Itexplains the way community members interact with wetlands and consequentlydetermines the efforts that can be used to ensure the wise management <strong>of</strong> theseecosystems.In both systems, wetlands are threatened by the already high and increasingpopulation density <strong>of</strong> both humans and livestock, the reduced soil fertilityelsewhere, the effects <strong>of</strong> climate change (prolonged droughts), changingcommunity lifestyles, pollution <strong>of</strong> surface water sources, the unpredictable andlow rainfall, the de-vegetation/deforestation, the limited access to clean water/sanitation and the inappropriate and degrading fishing practices.Therefore, in an effort to ensure the wise-use <strong>of</strong> wetland ecosystem goods andservices and improved livelihood, the COBWEB project must seek to bringon board all stakeholders, key to the project being local communities whoseinvolvement or neglect has the power to lead the project to the achievement <strong>of</strong>its set goal or not. Relatedly, the project should be able to advise on livelihoodalternatives for strategic purposes <strong>of</strong> reducing the ecological footprint. Atpolicy level, COBWEB should make an effort in encouraging the inclusion <strong>of</strong>wetland issues in planning and decision-making frameworks such as DistrictDevelopment Plans (DDP) as well as Sub-county Development Plans (SDP) togive wetland management some mandatory backing.xiiA <strong>Socio</strong>-<strong>Economic</strong> <strong>Baseline</strong> <strong>Survey</strong> <strong>of</strong> <strong>Communities</strong>Adjacent to Lake Bisina/Opeta and Lake Mburo/Nakivali Wetland Systems
1.0 PREAMBLEThe COBWEB project is a multi-stakeholder implemented 4-year project on amission to strengthen <strong>Uganda</strong>n National Protected Area network by expandingthe coverage <strong>of</strong> the PA network to include the country’s biologically importantwetland ecosystems through piloting the model at 2 wetland sites adjacent to 2Protected Areas (East & West) by means <strong>of</strong> targeting 3 outcomes that contributeto the WSSP, Strategic Objective 5, 6 and 7. This survey was conducted asa requirement to establish baseline information on the economics <strong>of</strong> thecommunities that the project seeks to benefit during and after its life span. Thesocio-economic survey falls under outcome II <strong>of</strong> the project, which is “Wise-usestrategies for bio-diverse wetlands are implemented without loss <strong>of</strong> biodiversityfunction”This is a report <strong>of</strong> a <strong>Socio</strong>-<strong>Economic</strong> survey <strong>of</strong> selected sites around the wetlands<strong>of</strong> Lake Mburo – Nakivali and Lake Bisina – Opeta system, a COBWEB projectfocus area covering ten districts <strong>of</strong> Mbarara, Kiruhura, Isingiro, Rakai in western<strong>Uganda</strong>; and Kumi, Soroti, Nakapiripirit, Bukedea, Katakwi and Sironko inthe Eastern region. As will later be seen in the methodology section, two subcountiesin each <strong>of</strong> the districts were purposively sampled and visited duringdata collection.1.1 BackgroundThe National Environmental Statute (1995) defines wetlands (or swamps) asareas, which are permanently or seasonally flooded with water and where plantsand animals have become adapted. In general, a wetland can be defined as ashallow water body with teaming life <strong>of</strong> complex fauna and flora.Wetlands cover 30,105km2 <strong>of</strong> <strong>Uganda</strong>’s total land area <strong>of</strong> 241,500km2. Withthe coverage <strong>of</strong> 13% <strong>of</strong> the total land area, they represent one <strong>of</strong> the most vitalecological and economic resources the country is endowed with. These wetlandsare a storehouse <strong>of</strong> globally significant biodiversity. Wetland biodiversity valuesare highlighted by both the diversity in the bird, fish and plant communities,and in habitat richness (beta diversity). Unfortunately their importance isassociated more with the direct consumptive use value like crop cultivation,human settlement, and extraction <strong>of</strong> useful materials. The essential life supportprocesses for example stabilization <strong>of</strong> hydrological cycle and microclimates,A <strong>Socio</strong>-<strong>Economic</strong> <strong>Baseline</strong> <strong>Survey</strong> <strong>of</strong> <strong>Communities</strong>Adjacent to Lake Bisina/Opeta and Lake Mburo/Nakivali Wetland Systems1
protection <strong>of</strong> riverbanks, nutrient and toxin retention and, sewage treatmentare the least recognized because <strong>of</strong> their indirect nature. Destruction <strong>of</strong> theseecosystems is a serious environmental problem the country is currently facedwith. The problem has reached alarming levels in Eastern <strong>Uganda</strong> where about20% <strong>of</strong> wetlands have been degraded. For instance, in 2006, with the exception<strong>of</strong> two Ramsar sites, about 20 community wetlands managed under communitybased management plans and pockets <strong>of</strong> wetlands in various protected areas, alarge portion <strong>of</strong> the wetland still face degradation (Apunyo, 2008).1.2 Objectives <strong>of</strong> the survey1.2.1 Broad objectivesThe overall objective <strong>of</strong> the survey was to collect baseline socio-economicinformation on conditions around Lake Mburo/Nakivali and Lake Bisina/Opetawetland systems.12.2 Specific objectivesThe specific objectives were:• To provide the COBWEB project and other conservation and developmentagencies working on wetland issues with information on socio-economicaspects to guide the planning <strong>of</strong> their activities;• To determine the economic dependency <strong>of</strong> people living in the surveyarea on wetlands;• To explore suitable restoration and conservation strategies based oncurrent use and value attached to wetlands; and,• To provide a monitoring framework to assess project impact during theproject mid-term review and end <strong>of</strong> project evaluation.1.3 Specific tasksDevelopment <strong>of</strong> the questionnaire, design tools and checklists for datacollection and analysisConducting a survey <strong>of</strong> the wetland benefits, users and beneficiaries.2A <strong>Socio</strong>-<strong>Economic</strong> <strong>Baseline</strong> <strong>Survey</strong> <strong>of</strong> <strong>Communities</strong>Adjacent to Lake Bisina/Opeta and Lake Mburo/Nakivali Wetland Systems
Documenting the current wetland problems and threats to people’swellbeing.Documenting any existing threats to the wetland system in question.Developing key indicators for monitoring changes.Performing data analysis <strong>of</strong> the findings.1.3 Expected OutputsThe study was expected to result in a final report documenting socio-economicactivities, wetland benefits and status <strong>of</strong> livelihoods <strong>of</strong> people around selectedwetland areas that will serve as an instrument for monitoring impacts <strong>of</strong> theinterventions arising from the management planning processes as under the design<strong>of</strong> the COBWEB project. Specifically the outputs included:a. Activities in which resource users are involved, benefits accruing andbeneficiaries.b. Numbers and pr<strong>of</strong>iles <strong>of</strong> resource users differentiated by resource use,gender, age and origin.c. Training needs to harness sustainable utilization <strong>of</strong> wetland resources.d. The output, resource viability and relative importance <strong>of</strong> major/smallscale resource userse. Effects <strong>of</strong> activities on resource sustainability and the environment.f. Interventions to enhance community livelihoods from wetland productsg. Proposals for implementation strategies <strong>of</strong> the identified approaches forsustainable utilization and management <strong>of</strong> the selected wetlands.A <strong>Socio</strong>-<strong>Economic</strong> <strong>Baseline</strong> <strong>Survey</strong> <strong>of</strong> <strong>Communities</strong>Adjacent to Lake Bisina/Opeta and Lake Mburo/Nakivali Wetland Systems3
2.0 SURVEY MATERIALS ANDMETHODSThe study used both primary and secondary data sources. It blended qualitativeand quantitative methods <strong>of</strong> inquiry buttressed by participatory research/surveytechniques. Qualitative data was largely (but not exclusively) generated by keyinformant interviews and focus group discussions, putting in consideration issues<strong>of</strong> gender. Quantitative data was elicited largely from <strong>of</strong>ficial reports/documentsand publication.2.1 Sampling procedureThe survey was conducted in six districts <strong>of</strong> Eastern and North-Eastern <strong>Uganda</strong>(Sironko, Bukedea, Soroti, Katakwi, Kumi and Nakapiripririt) and four districts<strong>of</strong> Western <strong>Uganda</strong> (Mbarara, Kiruhura, Isingiro and Rakai). The methodologyused in this work was especially guided by the terms <strong>of</strong> reference and availabledocumentation on wetland management in the above districts <strong>of</strong> surveyconsideration. A multistage purposive sampling procedure was employed in theselection <strong>of</strong> the survey population. The main sampling unit <strong>of</strong> the survey was thehousehold. The team relied on the opinion <strong>of</strong> the local leadership to select trulyrepresentative but feasible samples, given the limited time frame and coverage <strong>of</strong>the exercise. Purposive sampling <strong>of</strong> the study areas was used (from Sub-county,Parish and up to village level). The purposive sampling method employed in thissurvey was based on the understanding that communities are not homogenousparticularly in terms <strong>of</strong> levels <strong>of</strong> wetland utilization, conservation challenges,socio-economic values attached and development concerns and threats.Subsequently random sampling was done in identified villages to selecthouseholds to participate in the survey as respondents. Two sub-counties ineach District <strong>of</strong> consideration were identified for the survey. On reporting tothe sub-counties sampled, the study team held discussions with the Sub countyleadership (Chief and LCIII Chairperson) who then provided lists <strong>of</strong> parisheswithin the selected sub-counties that are adjacent to the wetlands. After selectingthe Parish, a list <strong>of</strong> all villages within that Parish was obtained from the parishchief. Using the lottery method <strong>of</strong> random sampling, two villages were selectedfrom each <strong>of</strong> the two parishes in each sub-county under consideration.4A <strong>Socio</strong>-<strong>Economic</strong> <strong>Baseline</strong> <strong>Survey</strong> <strong>of</strong> <strong>Communities</strong>Adjacent to Lake Bisina/Opeta and Lake Mburo/Nakivali Wetland Systems
Overall, a total <strong>of</strong> ten (10) districts, twenty (20) sub-counties, forty (40) parishes,eighty (80) villages and three hundred and twenty (320) households wereconsidered representative enough for the socio-economic survey in the tworegions <strong>of</strong> project operation. The figure below illustrates a summary <strong>of</strong> thesampling procedure.Fig. I: Sampling procedure (Also see Appendix III)2.2 Data collection methods2.2.1 QuestionnairesThe basic method used in this survey was qualitative/key informant interviews.Using this method the researchers held several interviews various stakeholdersin the development and management <strong>of</strong> wetland resources around the projectsites. Although respondents were randomly selected, every attempt was made toA <strong>Socio</strong>-<strong>Economic</strong> <strong>Baseline</strong> <strong>Survey</strong> <strong>of</strong> <strong>Communities</strong>Adjacent to Lake Bisina/Opeta and Lake Mburo/Nakivali Wetland Systems5
get a balanced opinion <strong>of</strong> the socio-economic issues in the study areas and howthey affect wetland management, putting issues <strong>of</strong> gender, age and disability inconsideration.2.2.2 Literature reviewThe researchers also used secondary data content analysis. In this method,published research work about wetlands in <strong>Uganda</strong> in general, and the wetlandsystems <strong>of</strong> Lake Mburo - Nakivali and Lake Opeta – Bisina in particular wasanalyzed to assess trends and analyze changes and correlate such data with thecurrent facts on ground.2.2.3 Focus Group DiscussionsSubsequently, group discussions were conducted as a follow-up to the contentanalysis and individual interactions in interviews. FGD were conducted atthe community level mainly with people whose depend largely on wetlands.This helped researchers to identify, enumerate and analyze occurrences anddevelopments in the wetlands sub-sector in addition to corroborating informationin the different reports reviewed.2.3 Data processing and analysisA data code sheet was developed by the team, and used to code the datauniformly for data entry purposes. The data was then entered and analyzed usingthe SPSS program. MS Excel was also used for data analysis. The research teamspecified the most crucial questions to be analyzed and the kind <strong>of</strong> analysisthey needed. Some <strong>of</strong> the survey questions allowed the respondent to give morethan one response. The advantage <strong>of</strong> this method <strong>of</strong> inquiry is that it allows therespondent to give all possible responses to the issue in question. The analysis<strong>of</strong> such data used the method <strong>of</strong> aggregating the various responses according totheir frequencies.2.4 Quality controlInterviewers were instructed to check questionnaire completeness and accuracyon interview site. At the end <strong>of</strong> each day, questionnaire debriefing sessions wereheld between the supervisor and all interviewers, to identify any complications,and to agree on common definitions. Interviewers were asked to write downall additional qualitative information, which was analyzed by the team per6A <strong>Socio</strong>-<strong>Economic</strong> <strong>Baseline</strong> <strong>Survey</strong> <strong>of</strong> <strong>Communities</strong>Adjacent to Lake Bisina/Opeta and Lake Mburo/Nakivali Wetland Systems
wetlands under consideration. This was important in capturing important datathat would have otherwise been left out by the restrictive design <strong>of</strong> the researchinstruments.Overall, the assessment <strong>of</strong> socio-economic conditions involved identification<strong>of</strong> frontline stakeholders, competing uses, wetland based economic activities,social interactions and overall contribution <strong>of</strong> wetland systems to the local socioeconomicconditions <strong>of</strong> the households. Field consultations were focused onunderstanding the key livelihood needs communities obtain from the wetlandsystems, and the associated values they attach to them. Using baseline indicatorsthis study would then generate an M&E framework for the project against whichthe project measurement <strong>of</strong> process and impact will be done.A <strong>Socio</strong>-<strong>Economic</strong> <strong>Baseline</strong> <strong>Survey</strong> <strong>of</strong> <strong>Communities</strong>Adjacent to Lake Bisina/Opeta and Lake Mburo/Nakivali Wetland Systems7
3.0 SURVEY FINDINGS: PRESENTATIONAND DISCUSSION3.1 Description <strong>of</strong> survey area3.1.1 Lake Opeta – Bisina WetlandsThe wetland system covers a total <strong>of</strong> six (6) Districts <strong>of</strong> Eastern and North-Eastern<strong>Uganda</strong>. On one hand, the Lake Bisina section is situated in Kumi, Katakwi andSoroti districts in eastern <strong>Uganda</strong> in the shadow <strong>of</strong> Mt.Elgon between 01°43’Nand 033°54’E. Lake Bisina wetland system covers an area <strong>of</strong> 54,229 ha and it isan Important Bird Area (IBA).Lake Bisina is a shallow fresh water lake with a thin strip <strong>of</strong> fringing papyrusswamp. Water lilies and a declining habitant dominate the shallow area whichis important for its diversity <strong>of</strong> macrophytes. It is used as a feeding ground forwading birds including the globally vulnerable shoebill (balaeniceps rex). Thesystem is also important as refuge for fish species that have gone extinct in themain <strong>Uganda</strong>n lakes such as Lake Victoria and Kyoga. The lake is very importantfor the surrounding communities in terms <strong>of</strong> fishing, transport and supply <strong>of</strong>water for domestic use and livestock. It is especially critical during times <strong>of</strong>famine (e.g. a rhizome <strong>of</strong> the Nymphea genus is used as food during droughts).The site falls under the Karamoja Protected Area system. A Community basedWetland Management Plan (CWMP) has been prepared for Bisina wetlandsystem (RIS information, 2006).8A <strong>Socio</strong>-<strong>Economic</strong> <strong>Baseline</strong> <strong>Survey</strong> <strong>of</strong> <strong>Communities</strong>Adjacent to Lake Bisina/Opeta and Lake Mburo/Nakivali Wetland Systems
Map <strong>of</strong> Bisina Wetland System showing administrativeboundariesSource: <strong>Nature</strong><strong>Uganda</strong> (2009)On the other hand is the Lake Opeta part <strong>of</strong> the wetland system which islocated in North Eastern <strong>Uganda</strong> between 01°42’N 034°14’E.in the districts <strong>of</strong>Nakapiripiriti, Sironko, Katakwi, kumi and Bukedea with a coverage <strong>of</strong> 68,912ha. It is predominantly an extensive swamp <strong>of</strong> Vossia cuspidate to the east andsouth graduating into dry hyparrhenia grassland savannas. The wetland is <strong>of</strong>great importance for the conservation <strong>of</strong> birds (e.g. fox’s weaver) and for itslife support functions for the survival <strong>of</strong> human and wildlife. The informationbelow summarizes the pr<strong>of</strong>iles <strong>of</strong> the districts covered by Lake Bisina/Opetawetland system.A <strong>Socio</strong>-<strong>Economic</strong> <strong>Baseline</strong> <strong>Survey</strong> <strong>of</strong> <strong>Communities</strong>Adjacent to Lake Bisina/Opeta and Lake Mburo/Nakivali Wetland Systems9
Map <strong>of</strong> Opeta wetland system showing administrativeboundariesa) Bukedea DistrictSource: <strong>Nature</strong><strong>Uganda</strong> (2009)Covering a total land area <strong>of</strong> 1,049.34 Sq. Kms, Bukedea district bordersMbale and Sironko districts in the East, Kumi district in the north, Katakwi andNakapiripirit districts in the North-East and Pallisa District in the South. Thedistrict is generally a flat land with a large coverage <strong>of</strong> wetlands. Based on the2002 Population and housing census, there are 122,433 people in the district,with 63835 females and 58,598 males.In terms <strong>of</strong> economic engagement, over 84% <strong>of</strong> the households are engaged inagriculture, and particularly in subsistence farming. In addition to crop farming,there is animal rearing mainly <strong>of</strong> the local Zebu cattle, sheep, pigs and poultry.10A <strong>Socio</strong>-<strong>Economic</strong> <strong>Baseline</strong> <strong>Survey</strong> <strong>of</strong> <strong>Communities</strong>Adjacent to Lake Bisina/Opeta and Lake Mburo/Nakivali Wetland Systems
) Sironko DistrictIn terms <strong>of</strong> location, Sironko borders the districts <strong>of</strong> Kapchorwa in the East, Kumiin the West, Nakapiripiriti in the North and Mbale in the South. The districtcovers a geographical area <strong>of</strong> 1,090.8 Sq. km and lies at an approximate altitude<strong>of</strong> between 1,299m – 1,524m above sea leveLake In addition the district receivesrainfall totaling 1,191mm per annum and low temperature within a subtropicalclimatic zone.According to the 2002 Housing and Population census, Sironko has a population<strong>of</strong> 309,000 people; 157,300 female, 151,700 male – whose main economicactivity is agriculture with emphasis on;i. Food crops: Millet, sorghum, ground-nuts, cassava, sweet potatoes,beans and Irish potatoesii. Cash crops: Cotton and c<strong>of</strong>feeiii. Fruits: Passion fruitsiv. Vegetables: Tomatoes, onions and cabbagesc) Kumi DistrictWith an area <strong>of</strong> 2,848 Sq. Km, Kumi borders the districts <strong>of</strong> Bukedea in the East,Pallisa in the South, Soroti in the West, Katakwi in the North and Nakapiripiritiin the North-East. Lakes Bisina and Opeta form Kumi’s border with Katakwidistrict.In terms <strong>of</strong> climate and relief, Kumi district lies at an approximate altitude <strong>of</strong>between 1,036m and 1,127 above sea level in a modified equatorial climaticzone with both heavy rainfall and high temperature. Based on the populationprojections <strong>of</strong> 2006 there are 333,067 people in the district. Agriculture is themain economic activity in the district with emphasis on food crops such as;finger millet, ground-nuts, sweet potatoes, cassava, sorghum, rice, cow peas,soy beans, bananas, sunflower and onions; and cash crops such as cotton.d) Soroti DistrictLocated in Eastern <strong>Uganda</strong>, Soroti borders the districts <strong>of</strong> Kaberamaido in theWest, Kumi in the East, Katakwi in the North, with a geographical coverage <strong>of</strong>3,373.8 Sq Km. The district lies at an approximate altitude <strong>of</strong> 1,036m – 1,127mabove sea level with rainfall totals <strong>of</strong> up to 1,000 – 1,500mm per annum andhigh temperatures.A <strong>Socio</strong>-<strong>Economic</strong> <strong>Baseline</strong> <strong>Survey</strong> <strong>of</strong> <strong>Communities</strong>Adjacent to Lake Bisina/Opeta and Lake Mburo/Nakivali Wetland Systems11
Like most other districts in <strong>Uganda</strong>, agriculture remains the main economicactivity in the area with emphasis on food crops and cotton as the main cashcrop. Finger millet, sorghum, ground-nuts, cassava, cowpeas, sweet potatoes,maize, soy beans, simsim (sesame) and sunflower form the main source <strong>of</strong> foodfor households, while fruits (such as passion fruits, oranges and mangoes) andvegetables such as tomatoes, onions and cabbages are also grown in the districtwhose population estimates stand at 445,800 people, with 228,000 female,217,800 male.e) Katakwi DistrictWith its geographical location in North-Eastern <strong>Uganda</strong>, Katakwi district bordersthe districts <strong>of</strong> Moroto to the North-East, Nakapiripirit in the East, Amuria in theWest; Lake Bisina forms its border with Kumi on the south. The district covers anarea <strong>of</strong> 2,477.13 Sq Km.In terms <strong>of</strong> climate, relief and vegetation, the district located on the Northernplateau. It is characterized by extensive flat plains with grassland savannahand frequent shrub vegetation. There is a marked long dry season and rainfallis relatively low, ranging from 850mm – 1500mm, with the Northern partsreceiving less rainfall.The National Housing and Population Census (2002) put its population figuresat 137,200 people – 70,900 female, 66,300 male. This population survives onagriculture, cultivation <strong>of</strong> food crops (sorghum, finger millet, ground-nuts, sweetpotatoes, cassava, bananas, soya beans, simsim, maize, cow peas and vegetables),cash crops (cotton) and cattle rearing are the main economic, activities.f) Nakapiripiriti DistrictBordering the districts <strong>of</strong> Moroto in the North, Katakwi in the West, Sironko andKapchorwa in the South, Nakapiripiriti District in North-Eastern <strong>Uganda</strong> coversan area <strong>of</strong> 5,825.3 Sq. Km with a population <strong>of</strong> 192,300 people (94,400 female,97,900 male) according to UBOS (2002).A look at climate, relief and vegetation shows that the district lies at anapproximate altitude <strong>of</strong> 1,356m – 1,524m above the sea level with rainfalltotaling 400 - 600mm per annum and average temperatures <strong>of</strong> around 30°C. Thisarea is semi arid and the vegetation includes isolated thorny trees and shrubs.With the main economic activity being cattle rearing, agriculture has somepotential as exhibited in the small-scale farming <strong>of</strong> sorghum, ground-nuts,12A <strong>Socio</strong>-<strong>Economic</strong> <strong>Baseline</strong> <strong>Survey</strong> <strong>of</strong> <strong>Communities</strong>Adjacent to Lake Bisina/Opeta and Lake Mburo/Nakivali Wetland Systems
sunflower, sweet potatoes, cassava, and fruits and vegetables as the area’s cashcrops. Of recent, rice growing in the district has picked for both subsistence andcommercial purposes.3.1.2 Lake Mburo – Nakivali WetlandsCovering an area <strong>of</strong> 26,834ha and lying on the geographical coordinates <strong>of</strong>30 o 49’ – 31 o 04” E and 00 o 33’ – 00 o 47” S, Lake Mburo – Nakivali wetlandscomprise <strong>of</strong> open and wooded savanna, seasonal and permanent wetlands andfive lakes <strong>of</strong> which Lake Mburo is by far the largest. Most <strong>of</strong> the wetland systemlies in Lake Mburo National Park, gazetted in 1982. The other part lies outsidethe National Park and covers Lake Nakivali and the surrounding swamps in thesub-counties <strong>of</strong> Rugaaga, Kashumba, Ngarama and Kabingo. The wetlands are aunique habitat, which lie at the convergence zone <strong>of</strong> two biogeographical zones- the Lake Victoria regional mosaic and the Guinea-Congolian biogeographicregion.It supports globally threatened species <strong>of</strong> birds, including two <strong>of</strong> the endangeredcichlid fish species which have gone extinct in the main lakes and it is the onlysystem in <strong>Uganda</strong> in which the Impala is found. The system also provides refugiato 22 species <strong>of</strong> Palaearctic and Afro-tropical migrant birds during adverseconditions, within the wooded Savanna with Acacia/Commiphora thicket andgrasslands. The Lake Mburo wetland system is <strong>of</strong> immense socio-economicvalue. It is a source <strong>of</strong> water for domestic use, livestock and wildlife. The systemis a source <strong>of</strong> pasture for the local herds during droughts, a source <strong>of</strong> fish andraw materials for crafts and thatching.A <strong>Socio</strong>-<strong>Economic</strong> <strong>Baseline</strong> <strong>Survey</strong> <strong>of</strong> <strong>Communities</strong>Adjacent to Lake Bisina/Opeta and Lake Mburo/Nakivali Wetland Systems13
Map <strong>of</strong> Lake Mburo-Nakivali wetland system showing subcounties<strong>of</strong> coverageSource: <strong>Nature</strong><strong>Uganda</strong> (2009)The Lake Mburo – Nakivali Wetland System covers the districts <strong>of</strong> Isingiro andRakai, Kiruhura and Mbarara in Western <strong>Uganda</strong>. Presented below are briefdistrict pr<strong>of</strong>iles.a) Mbarara DistrictMbarara borders the district <strong>of</strong> Kiruhura in the East and North East, Ibanda inthe North, Isingiro in the South-East, Ntungamo in the South and Bushenyi in14A <strong>Socio</strong>-<strong>Economic</strong> <strong>Baseline</strong> <strong>Survey</strong> <strong>of</strong> <strong>Communities</strong>Adjacent to Lake Bisina/Opeta and Lake Mburo/Nakivali Wetland Systems
the West. The district covers an area <strong>of</strong> 1,788.24 Sq. Km. with a population <strong>of</strong>396,300 people – 202,800 female, 193,500 male (UBOS, 2002).The district lies at an altitude <strong>of</strong> between 129m – 1,524m above sea level withtemperatures averaging between 25º – 27°C and rainfall <strong>of</strong> up to 1,200mm perannum in some areas. The vegetation is a combination <strong>of</strong> bush and short grasswhich is good for animal rearing. The main economic activity in the district isagriculture with emphasis on;i. Food crops: beans, sorghum, millet, maize, cassava, sweet potatoes, irishpotatoes, ground-nuts, bananas and peas;ii. Cash crop: c<strong>of</strong>feeiii. Fruits: passion fruitsiv. Vegetables: tomatoes, onions and cabbagev. Ranching and diary farming.b) Isingiro DistrictFormerly part <strong>of</strong> Mbarara district, Isingiro borders the districts <strong>of</strong> Rakai in theEast, Kiruhura and Mbarara in the North, Ntungamo in the West and the UnitedRepublic <strong>of</strong> Tanzania in the South. With a total population <strong>of</strong> 350,100 people(180,700 female, 169,400 males), the district covers an area <strong>of</strong> 2657.18 Sq. Km.In terms <strong>of</strong> climate, relief and vegetation, the district has a hilly terrain withvegetation characterized by a combination <strong>of</strong> bush and short grass which issuitable for animal rearing. The area receives rainfall <strong>of</strong> about 957mm annually,which support crop and animal production. In addition, the district has a highpotential in terms <strong>of</strong> mining and lumbering.c) Kiruhura DistrictKiruhura district was curved out from Mbarara district and it borders the districts<strong>of</strong> Rakai to the East, Mbarara to the South, Ibanda to the West, Sembabule andKyenjojo to the North. As per the 2002 National Housing and Population Census,the population stood at 241,000 people (119,600 female, 121,400 male) sittingon an area <strong>of</strong> 4,607.98 Sq Km.The district is generally flattish with undulating hills covered with savannahgrass lands. It is located in the cattle corridor, and cattle keeping is the maineconomic activity, with banana growing and apiary supplementing food securityand household incomes.A <strong>Socio</strong>-<strong>Economic</strong> <strong>Baseline</strong> <strong>Survey</strong> <strong>of</strong> <strong>Communities</strong>Adjacent to Lake Bisina/Opeta and Lake Mburo/Nakivali Wetland Systems15
d) Rakai DistrictWith an area <strong>of</strong> 4,908.5 Sq. Km. Rakai borders the districts <strong>of</strong> Lyantonde andMasaka in the North and North-East, Mbarara in the West, Lake Victoria in theEast and the United Republic <strong>of</strong> Tanzania in the south. The district lies in amodified equatorial climatic zone with high temperatures and heavy rainfallalmost all year round.Based on population projections <strong>of</strong> 2006 there are 433,561 people in Rakaidistrict. Agriculture is the main economic activities with a bias towards foodcrops such as beans, sorghum, millet, maize, cassava, sweet potatoes, Irishpotatoes, ground-nuts, bananas; cash crops such as c<strong>of</strong>fee; fruits and vegetablessuch as passion fruits, tomatoes, onions, pineapples and cabbage in addition tocattle keeping.3.2 Basic socio-economic and demographic features <strong>of</strong>respondents3.2.1 Position <strong>of</strong> respondents in households and communitiesThere was a deliberate effort made to interview the household head in most<strong>of</strong> the households sampled and this formed 64.4%. Similarly, the team gaveconsideration to special groups and <strong>of</strong> the total number <strong>of</strong> respondents, 31.8%were women interviewed in the survey, while 4.7% <strong>of</strong> the respondents were theelderly in communities. 7.0% were youths while the People with Disabilities(PWD) formed 0.9% <strong>of</strong> the participants in the survey. As such, the informationgathered is considered representative <strong>of</strong> all community groups, since most <strong>of</strong> therespondents were responsible persons within the households.1%64%29%6%ElderlyWomenYouthMenFig 2: Showing the percentage <strong>of</strong> household heads interviewed16A <strong>Socio</strong>-<strong>Economic</strong> <strong>Baseline</strong> <strong>Survey</strong> <strong>of</strong> <strong>Communities</strong>Adjacent to Lake Bisina/Opeta and Lake Mburo/Nakivali Wetland Systems
Table 1: Position <strong>of</strong> respondent within the householdinterviewedPosition <strong>of</strong> respondent Frequency (f) %Household Head 223 69.6Wife to head 65 20.3Husband to head 4 0.1Child 20 6.5Other 8 2.5Total 320 100.03.2.2 Education levelMajority <strong>of</strong> the sampled households were headed by people educated up toprimary level (52.8%). About 28% had no formal education at all, while only17.2% were educated above secondary level. Only 2% had attained tertiaryeducation. Similarly, the respondents were mainly primary level-educatedpeople (65.7%). Over a fifth <strong>of</strong> them (21.3%) had no formal education at all,while only 13% had secondary education and above. This demonstrates that theformal education levels <strong>of</strong> the communities are not very high in general.These statistics may well reflect the national average where 24.3% <strong>of</strong> people <strong>of</strong> 15and above years do not have formal educational attainment. Therefore wetlandadjacent communities do not necessarily have lower education attainment thanother rural communities. However the fact that a fifth <strong>of</strong> the household decisionmakers have no formal education and a half have only primary educationhas implications for the type <strong>of</strong> resource use and subsequently the wetlandmanagement and conservation strategy they can ably practise.Analyzed by system, there were more heads <strong>of</strong> households without formaleducation around the Bisina-Opeta (68.8%) as compared to Mburo-Nakivali(31.2%). The table below summarizes the education attainment levels <strong>of</strong>household heads in the two wetland systems under survey.A <strong>Socio</strong>-<strong>Economic</strong> <strong>Baseline</strong> <strong>Survey</strong> <strong>of</strong> <strong>Communities</strong>Adjacent to Lake Bisina/Opeta and Lake Mburo/Nakivali Wetland Systems17
Table 2: Education level <strong>of</strong> Household Head by systemEducational Bisina-Opeta Mburo - Nakivali TotallevelNone 42 19 61Primary 58 36 92Secondary 25 18 43Tertiary 16 09 25Total 141 82 221 13.2.3 Sex <strong>of</strong> respondentsA deliberate effort was made to give consideration to sex in the samplingprocess to choose respondents in the survey. This was based on the backgroundthat women and men interface with wetlands differently and the associatedchallenges that come with this interaction are different for women from men.Although it was not possible to balance the numbers in the distribution, views<strong>of</strong> 118 women were captured out <strong>of</strong> the total 320 respondents to the surveyquestions. The figure below illustrates this distribution.MALE63%FEMALE37%Fig. 3: Sex <strong>of</strong> respondents18A <strong>Socio</strong>-<strong>Economic</strong> <strong>Baseline</strong> <strong>Survey</strong> <strong>of</strong> <strong>Communities</strong>Adjacent to Lake Bisina/Opeta and Lake Mburo/Nakivali Wetland Systems
3.2.4 AgeResults regarding the age <strong>of</strong> households in the study were found to be interesting.Age was found to have implications on wetland utilisation. Four categories <strong>of</strong>age groups were used to analyse the age data. Almost half <strong>of</strong> the respondentswere youths (18-39 years), and it was also revealed that most households wereheaded by youths aged between 18 and 35 years old.Table 3: Age distribution <strong>of</strong> respondents in the survey areaAge (yrs) Bisina/Opeta %age Mburo/Nakivale % ageFreq (n)Freq (n)Below 20 5 3.9 3 1.620-29 14 10.9 28 14.630-39 32 25 62 32.340-49 56 43.8 71 36.950+ 21 16.4 28 14.63.2.5 SettlementAn investigation into the history <strong>of</strong> settlement shows that very few households(1.8%) have settled in the survey areas for the Mburo/Nakivali wetlands in thelast year, while the figure is slightly less (1.4%) for the Bisina/Opeta site. A total<strong>of</strong> 21.6% had settled in the surroundings <strong>of</strong> Lake Mburo/Nakivali wetlands and23.2% in communities around Lake Bisina/Opeta wetlands in the last 5 years.On average, slightly more than a quarter <strong>of</strong> the households (25.2%) had settledin the last 10 years. This is cause for concern, because it demonstrates significantimmigration into the areas adjacent to wetlands. This implies that the pressureon the resources is increasing gradually. The bulk <strong>of</strong> the households (51.4%) hadlived in their localities for more than 20 years or were in their ancestral homes.The graph below illustrates the length <strong>of</strong> stay.A <strong>Socio</strong>-<strong>Economic</strong> <strong>Baseline</strong> <strong>Survey</strong> <strong>of</strong> <strong>Communities</strong>Adjacent to Lake Bisina/Opeta and Lake Mburo/Nakivali Wetland Systems19
Fig.4: Length <strong>of</strong> stay in the survey area3.2.6 Ethnicity and ethnic groupsThere is a diversity <strong>of</strong> ethnic groups in the surveyed areas. The most diverse areawas the Western (with Banyankole, Bakiga, Banyarwanda, Bahima, Baganda)around the Lake Mburo-Nakivali site, while the North-Eastern site was relativelyhomogeneous in terms <strong>of</strong> ethnicity (mainly with Itesots and Karimojong and afew Bagisu). The differences may partly be due to high levels <strong>of</strong> immigrationand refugee resettlement schemes to most parts <strong>of</strong> western <strong>Uganda</strong> andthe variety <strong>of</strong> livelihood activities that provide means <strong>of</strong> survival to the vastmajority. As will be discussed later, this has a bearing on wetland resourceuse and management dynamics both at community and policy/planning level.Table 4: Ethnic groups in the survey areaEthnicity in Bisina-Opeta siteValidValid PercentCumulativeItesotsPercentFrequency Percent101 52.6 52.6 52.6Karimojong59 30.7 30.7 83.3Bagisu 32 16.7 16.7 100.0Total192 100.0 100.020A <strong>Socio</strong>-<strong>Economic</strong> <strong>Baseline</strong> <strong>Survey</strong> <strong>of</strong> <strong>Communities</strong>Adjacent to Lake Bisina/Opeta and Lake Mburo/Nakivali Wetland Systems
Ethnicity in Mburo-NakivaliFrequencyPercentValidPercentCumulativePercentValid Banyankole 82 42.7 64.1 64.1Bakiga 22 11.5 17.2 81.3Banyarwanda16 8.3 12.5 93.8Baganda 8 4.2 6.3 100.0Total 128 66.7 100.0Missing System 64 33.3Total 192 100.03.2.7 Household sizeIt was found out that most <strong>of</strong> the sampled households had 6-10 residents (70.3%).This shows that majority <strong>of</strong> the households are large, implying high demandfor food and other household sustenance needs. Again, this implies increasingpressure on the wetland resources to satisfy basic needs. For householdsalready involved in wetland utilisation, this may translate into further wetlandexploitation. The fact that cultivation is the major economic and social activityfor the majority <strong>of</strong> the communities adjacent to wetlands is a confirmation thatpressure on the natural resource base is high. Most respondents indicated thatmore that 90% <strong>of</strong> the households were supported by wetland-based agriculture(as will be seen later) and that it was one <strong>of</strong> their top five priority economicactivities. The discussion <strong>of</strong> this issue also synthesizes the question <strong>of</strong> whetheror not wetland agriculture, in the current form that it is done is sustainable or notand points to the next steps.A <strong>Socio</strong>-<strong>Economic</strong> <strong>Baseline</strong> <strong>Survey</strong> <strong>of</strong> <strong>Communities</strong>Adjacent to Lake Bisina/Opeta and Lake Mburo/Nakivali Wetland Systems21
OCCUPANTGROUPINGSHousehold size in the survey areas11-15 people6-10 people3-5 people1-2 people0 50 100 150 200 250Number <strong>of</strong> respondents per age groupingSeries1Fig. 5: Size <strong>of</strong> sampled households in the survey areas3.2.8 Wealth statusThere has not been any effort to quantify community wealth status. The surveyteam therefore agreed on a simple criterion upon which judgement was madeto qualify a particular household to be well-<strong>of</strong>f, moderate, poor, or very poor.However given that a detailed wealth ranking was not carried out, determination<strong>of</strong> the wealth <strong>of</strong> individual households could have been influenced by personalbiases <strong>of</strong> the research team members. It should also be recalled that the Subcountiesincluded in the survey were purposively sampled according to theirproximity to wetlands. This aside, it is our deep conviction that the results givea fair picture <strong>of</strong> the wealth status <strong>of</strong> households visited. According to the criteriaset in this study for wealth indication (see appendix II), and according to theregional contexts, majority <strong>of</strong> the surveyed households were classified as poor(62.4%) and moderately well <strong>of</strong>f (26%). Very few households (3.1%) qualifiedto be classified as well <strong>of</strong>f and only (8.5%) fell under the category <strong>of</strong> very poor.The wealth status <strong>of</strong> wetland adjacent communities has a lot <strong>of</strong> implications forresource management/utilization especially when it is indicated that majorityare poor. This leaves them with limited alternatives, the most convenient beingwetland exploitation.There are a number <strong>of</strong> differences in terms <strong>of</strong> natural, physical, financial, socialand human capital. As such, it is important to note that the results given from the22A <strong>Socio</strong>-<strong>Economic</strong> <strong>Baseline</strong> <strong>Survey</strong> <strong>of</strong> <strong>Communities</strong>Adjacent to Lake Bisina/Opeta and Lake Mburo/Nakivali Wetland Systems
criterion used in the survey to determine wealth status is limited in its scope andis largely context specific. Consequently, for instance households categorisedas poor in one wetland system may be considered well-<strong>of</strong>f in another systemand vice-versa. The most important finding under this aspect as revealed by theresults is that more than half <strong>of</strong> all households across the sites were assessed aspoor; with gross implications <strong>of</strong> this status for wetland management. The majorindicators <strong>of</strong> poverty to quality the assessment <strong>of</strong> the survey team included poorhousing status, lack <strong>of</strong> sanitary facilities, inability to have enough food in thehouse, inability to have adequate dressing materials and malnutrition in childrenamong others (see appendix II). At least 78% <strong>of</strong> respondents in the Bisina-Opetasite were found to be staying in grass-thatched temporary and semi-permanentstructures with no sanitation facilities.Types <strong>of</strong> domestic animalsNo AnimalsHas ChickenHas SheepHas GoatsHas Cows1727647109 21 1047118 3760 50 100 150 200 250 300Number <strong>of</strong> respondentsLake Mburo/NakivaleLake Bisina/OpetaFig 6: Showing numbers <strong>of</strong> domestic animals in the possession <strong>of</strong>households in the survey areasSome <strong>of</strong> the other indicators <strong>of</strong> wealth were, for instance, possession <strong>of</strong> a car,bicycle, television and an iron sheets ro<strong>of</strong>ed house. As earlier indicated, theyardstick upon which wealth was judged was not all encompassing and so couldhave a number <strong>of</strong> criticisms. But in the figure above for example, it was not easyto convince the survey team that one is in the ‘poor’ category when they have80 cows. In fact this was also relative, depending on which site we are talkingabout. For instance someone with 80 zebu or long horned cows in Nakapipirit(Lorachat sub-county) might not necessarily be more well-<strong>of</strong>f than the other inMbarara (Kakiika division) with 5 Friesian cows.A <strong>Socio</strong>-<strong>Economic</strong> <strong>Baseline</strong> <strong>Survey</strong> <strong>of</strong> <strong>Communities</strong>Adjacent to Lake Bisina/Opeta and Lake Mburo/Nakivali Wetland Systems23
3.3 <strong>Economic</strong>s and Livelihoods <strong>of</strong> Households in theCOBWEB Project Sites3.3.1 Sources <strong>of</strong> income in Lake Opeta-Bisina areaAs earlier indicated, the main sources <strong>of</strong> livelihood in the districts around LakeBisina-Opeta in Eastern and North-Eastern <strong>Uganda</strong> have connections withcultivation and livestock rearing. By extension, the relationship with wetlandscovers crafts making, fishing and brick laying, as presented below, morecomprehensively.7060Count50403020100Milk andlivestockFarmproduceBrewingalcoholFishingCasuallabourPetty tradeBrick layingFig 7: Sources <strong>of</strong> income in communities around Lake Bisina-Opeta sitei) Sironko DistrictThe survey interviews indicated that communities in Sironko are dominatedby poor natural resource dependent communities, who mainly rely on rainfedagriculture and wetland-supported cultivation during the dry seasons.When asked about the main sources <strong>of</strong> their income, respondents from Sironkoindicated that much <strong>of</strong> the earnings came from sale <strong>of</strong> agricultural produce,livestock, firewood and charcoal, horticulture, crafts and poultry in that order.However, this is not without challenges and the average monthly householdincome for those generating income from these sources was computed to beUGX 400,000, yet with most <strong>of</strong> the crops seasonal in nature. Rice was found24A <strong>Socio</strong>-<strong>Economic</strong> <strong>Baseline</strong> <strong>Survey</strong> <strong>of</strong> <strong>Communities</strong>Adjacent to Lake Bisina/Opeta and Lake Mburo/Nakivali Wetland Systems
to be the crop grown most, for commercial and subsistence purposes and itwas found to do well in wetlands. The other crops predominantly grown inBunambutye and Muyembe sub-counties include; beans, maize, and groundnuts. There is also considerable reliance on sand mining and extraction, withgross implications on the status on wetlands in the area. The report expounds onissues <strong>of</strong> value attachment in greater detail in the subsequent sections.There are a number <strong>of</strong> unsustainable practices in the wetlands <strong>of</strong> Sironko districtthat participants raised as impeding efforts towards achieving meaningful wetlandresource use and conservation. It was noted that local community members wereengaged in some unsustainable farming practices such as spraying in the wetlands,cultivating in the wetlands, overgrazing, and conflicting over resource use due tocompeting wetland uses. Captured as perceived by respondents in the survey,this impacts negatively on water quality, eases disease spread, leads to loss <strong>of</strong>biodiversity and fuels food insecurity at household and community level.Some <strong>of</strong> the emerging issues in Sironko include accelerated wetland drainage,raising levels <strong>of</strong> awareness on wetland uses, increasing numbers <strong>of</strong> livestockwhose survival is supported by wetlands, prolonged drought periods andimmigration that is increasing pressure on natural resources.ii) Bukedea DistrictThe focus <strong>of</strong> the team in Bukedea District was concentrated in the sub-counties <strong>of</strong>Korir and Malera. Whereas the socio-economics <strong>of</strong> the land were not significantlydifferent from those in Sironko District, the Ateso culture brought in livelihoodissues that stood out. In addition to crop farming, there was a considerable level<strong>of</strong> engagement in cattle keeping and bee keeping in Bukedea. More to this, riceand millet growing is predominant in the district together with fishing, both <strong>of</strong>which require water that can only be reliably provided by wetlands.In Bukedea, activities such as charcoal burning and rice growing were identifiedas the most instrumental in wetland degradation.The wetlands were found to be utilized for domestic needs such as water forhousehold use while they also play a role <strong>of</strong> contributing towards householdincome with regard to the products communities derive from them forcommercial purposes. Although dependent communities identified a number<strong>of</strong> problems with a bearing on their socio-economic way <strong>of</strong> life they face dueto their close proximity to the ecosystems, they said that they were short <strong>of</strong>solutions, mainly due to lack <strong>of</strong> financial capacity and poor skills. Some theA <strong>Socio</strong>-<strong>Economic</strong> <strong>Baseline</strong> <strong>Survey</strong> <strong>of</strong> <strong>Communities</strong>Adjacent to Lake Bisina/Opeta and Lake Mburo/Nakivali Wetland Systems25
problems they mentioned include flooding during rainy seasons and a highincidence <strong>of</strong> malaria due to mosquitoes harboured in the wetlands. In addition,for all the benefits they derive from wetlands, communities did not have viablealternatives. They intimated that their lives were inseparable from wetlands andhad no idea <strong>of</strong> how life would be without the functions <strong>of</strong> these ecosystems intheir area. In a way, this pointed to the need to build capacity <strong>of</strong> communitymembers in livelihood options either away from wetlands or in sustainablewetland-based means <strong>of</strong> livelihood.iii) Kumi DistrictAgriculture defines the socioeconomicway <strong>of</strong> life <strong>of</strong>communities in Kumi districtgenerally and specifically about97% <strong>of</strong> households in the subcountiessampled for the surveyin the district. It is important tonote that in addition to beingless plentiful, rainfall in Kumiis more concentrated over ashorter period, with onset <strong>of</strong>the main rains coming later,leaving a longer dry periodfrom December to February orMarch.The soils are generally lighterand poorer, being mainlysandy sediments with somesand loams. Following thisgeophysical make up, cropcultivation does not yield muchSome <strong>of</strong> the products communities inKorir and Malera obtain from wetlands• Water for domestic use• Water for livestock• Papyrus for crafts making• Fish for household feeding• Fish for sale• Fertile land for crop growing• Honey from beekeeping• Poles for construction• Sand for construction• Sand for sale• Pasture for grazing animals• Firewood for cooking• Firewood for saleoutside wetlands especially during the dry seasons. As such, crop cultivation isone <strong>of</strong> the most pronounced causes <strong>of</strong> wetland degradation in the district. Cattlekeeping, which is the next ranking economic activity also relies on wetlands forthe supply <strong>of</strong> water and pasture to animals.26A <strong>Socio</strong>-<strong>Economic</strong> <strong>Baseline</strong> <strong>Survey</strong> <strong>of</strong> <strong>Communities</strong>Adjacent to Lake Bisina/Opeta and Lake Mburo/Nakivali Wetland Systems
Photo 2: Wetland contamination/pollution: Local alcohol brewing containersin a wetland from where the local brew is prepared and cooled in Mukura S/C,Kumi districtThe past decade has seen a lot <strong>of</strong> vegetation clearance for settlement andcharcoal burning, leaving the landscape bear with short grass. In the course<strong>of</strong> the discussions in the district, participants revealed that wetlands are theonly remaining source <strong>of</strong> biomass to rural communities. This has negativeimplications on the survival <strong>of</strong> the resource and faunal and foral species thereinwith a possibility <strong>of</strong> extinction. However a warning was sounded with regardto the escalating levels <strong>of</strong> bush burning and tree cutting for charcoal, whichraises a number <strong>of</strong> questions about the sustainability <strong>of</strong> such ecosystem servicesunder unregulated resource use. It calls for enactment and enforcement <strong>of</strong>stringent regulatory mechanisms (laws), and strengthening <strong>of</strong> the institutionalinfrastructure mandated to manage natural resources in the district.A deeper investigation into what is being done to foster wise use <strong>of</strong> wetlandsand wetland resources in the district pointed to the fact that the district has awetland ordinance which was passed by the district council to control wetlandmanagement challenges. Whereas the production department <strong>of</strong>ficials are proudto be the only one with such a piece <strong>of</strong> legislation in the country, it has not beenfully implemented due to financial and personnel challenges.A <strong>Socio</strong>-<strong>Economic</strong> <strong>Baseline</strong> <strong>Survey</strong> <strong>of</strong> <strong>Communities</strong>Adjacent to Lake Bisina/Opeta and Lake Mburo/Nakivali Wetland Systems27
Table 5: Sources <strong>of</strong> income for communities around LakeBisina-Opeta systemValid CumulativeFrequency PercentPercent PercentValid Milk and livestock 49 25.5 25.5 25.5Farm produce 66 34.4 34.4 59.9Brewing alcohol 8 4.2 4.2 64.1Fishing 21 10.9 10.9 75.0Casual labour 18 9.4 9.4 84.4Petty trade 17 8.9 8.9 93.2Brick laying 13 6.8 6.8 100.0Total 192 100.0 100.0The table above indicates that more than a quarter <strong>of</strong> the survey population(25.5%) around Lake Bisina/Opeta depend on Livestock, while 34.4% dependon crop cultivation. Considering that both <strong>of</strong> the activities are wetland supportedand that the current practices are unsustainable, it therefore emerges that thesurvival <strong>of</strong> these ecosystems is at stake.iv) Soroti DistrictIn Soroti district, it emerged that rural communities and wetlands are virtuallyinseparable. The farming households formed 69% <strong>of</strong> our sample in the district,the cattle keepers (26%) and the beekeepers (4%) in Soroti. These categories <strong>of</strong>resource users attach a lot <strong>of</strong> importance to wetlands in terms <strong>of</strong> provision <strong>of</strong>water, pasture and other ecological functions that facilitate the survival <strong>of</strong> life.The growing <strong>of</strong> rice, cassava, sweet potatoes, millet and sim-sim, ground nuts,cow peas and beans as well as cattle keeping is all wetland supported especiallyduring the long dry seasons that affect the region.Due to effects <strong>of</strong> climate change, partly characterized by long drought periods,the food security history has been affected. The pressure <strong>of</strong> wetlands hasmounted as people desperately look for moist and fertile lands for crop growing.The respondents indicated that they earn some income from their small-scaleeconomic activities, which when computed averages to UGX 265,000 permonth. They noted that their stay in close proximity with wetlands is associatedwith a number <strong>of</strong> problems. These include diseases, flooding <strong>of</strong> their farm landsand scarcity <strong>of</strong> arable land for farming. Despite these, participants noted thatbenefits outweigh the problems and that given more skills on how best to use theavailable land meaningfully, their monthly incomes could drastically rise.28A <strong>Socio</strong>-<strong>Economic</strong> <strong>Baseline</strong> <strong>Survey</strong> <strong>of</strong> <strong>Communities</strong>Adjacent to Lake Bisina/Opeta and Lake Mburo/Nakivali Wetland Systems
The analysis <strong>of</strong> gender interaction with wetlands shows an almost balanced level<strong>of</strong> involvement although roles and responsibilities <strong>of</strong> men and women are clearlydelineated in their respective communities. The only marked difference came inwhen it came to expressing themselves about their personal involvement withwetlands. Whereas women were open and free to share their points, men werea bit shy, something that could easily be attributed to their nature <strong>of</strong> interfacewith the ecosystem that is not ecologically sound e.g. in brick laying, charcoalburning and bush burning for pasture.v) Katakwi DistrictIn this district, the main economic activities include cattle keeping, alcoholbrewing and crop growing. With 87% <strong>of</strong> the households assessed as poor, most<strong>of</strong> the production is at household level to meet subsistence needs with only littlefinding its way to the market. The Ateso culture which is pastoralist in natureis dominant in the district, even when households do not have enough landfor such an activity. As a result, wetlands present the only way out for cattlerearing. More to this, a number <strong>of</strong> wetland resource conflicts can be noticedin the district, with domestic water needs competing with livestock rearing,crop cultivation and fishing. The competition is fueled by the ‘tragedy <strong>of</strong> thecommons’ as wetlands are public trust resources and therefore not under theownership <strong>of</strong> any individual.From the diagram on theleft, it is seen that a singlenatural resource can be put tovarious uses to meet humanand livestock needs, both forcommercial and domesticpurposes. It is important to notethat such natural resources aswetlands have a limited carryingcapacity and the regenerationcapacity <strong>of</strong> wetland resourcesneeds to be considered. As aresult, there is a limit to the level<strong>of</strong> foot print that such a wetlandcan accommodate beyond whichit loses its ecosystem values andfunctions.A <strong>Socio</strong>-<strong>Economic</strong> <strong>Baseline</strong> <strong>Survey</strong> <strong>of</strong> <strong>Communities</strong>Adjacent to Lake Bisina/Opeta and Lake Mburo/Nakivali Wetland Systems29
Fig. 8: Competing wetland uses: a recipe for conflictsHousehold income levels in the surveyed sub-counties are still low, with minimaldiversification <strong>of</strong> wetland-based means <strong>of</strong> livelihood. On average, a householdwas found to raise UGX 154,000 only per month. We asked communitymembers about the possibility <strong>of</strong> living the same lifestyles without going tothe wetlands. To this, they said it would need intensive training in alternativelivelihoods and that should not be expected to be easy to change. They alsonoted that such a change would have an effect on their culture, which makes itnear impossible to happen. As a team, we felt that such a community needs apackage <strong>of</strong> innovations in economically viable alternative livelihood enterprisesthat neither conflict with their culture nor the sustainability <strong>of</strong> wetland benefits(goods, services and functions).vi) Nakapiripiriti DistrictThis semi-desert region in the Karamoja region is dominated by pastoralcommunities with most households owning cows, goats or sheep. Wetlandconservation efforts by the district technical staff in the past have come inconflict with their culture, especially when residents were advised to reduceanimal numbers to sustainably utilize wetland resources. They derive incomesfrom the sale <strong>of</strong> milk and livestock. During the interviews, it was observedthat respondents did not have keen interest in matters to do with wetlandconservation, something that may be attributed to their nomadic nature <strong>of</strong> life.They keep large numbers and practice the free range system <strong>of</strong> grazing, in someinstances leading to the degradation <strong>of</strong> one grazing areas. Unfortunately, thisdoes not leave out wetlands, which are a source <strong>of</strong> water for the animals. As aresult, some wetlands have dried out, while others have shrunk and continue todry out due to the effect <strong>of</strong> the large numbers <strong>of</strong> livestock dependent on thesewetlands some <strong>of</strong> which are seasonal in nature.30A <strong>Socio</strong>-<strong>Economic</strong> <strong>Baseline</strong> <strong>Survey</strong> <strong>of</strong> <strong>Communities</strong>Adjacent to Lake Bisina/Opeta and Lake Mburo/Nakivali Wetland Systems
Photo 3: AmanigaRuhanga, the team leader plays with a dog after a Focus GroupDiscussion with pastoralists in Namalu S/C, Nakapiripiriti district during the surveyThe homesteads are mostly grass-thatched temporary huts, with high numbers<strong>of</strong> children. The homesteads however lack sanitation facilities and have highincidences <strong>of</strong> diseases such as diarrhea, malaria and skin diseases. A householdwith 150 cows, 80 goats and with an average monthly income <strong>of</strong> UGX 450,000is still housed in a grass-thatched hut and would prefer to be considered poorin this survey, as per the responses. Thatching materials are mostly obtainedfrom wetlands, this partly explains the high levels <strong>of</strong> wetland degradation inNakapiripiriti district. The wetlands <strong>of</strong> the area are most appreciated by thecommunity for their socio-economic importance particularly direct productssuch as poles for construction, fuel wood, food/fodder, herbal medicine and rawmaterials for handcrafts.One <strong>of</strong> the interesting findings is that Karamoja region, where the survey areais located, formerly known for cattle keeping is slowly shifting to crop growing.For instance Nakapiripiriti district is a known producer <strong>of</strong> Rice and Irish potatoesin the region. Considering that this area has semi arid characteristics, these cropsare grown in areas where they can be supported by swampy conditions for theirsurvival and yielding.A <strong>Socio</strong>-<strong>Economic</strong> <strong>Baseline</strong> <strong>Survey</strong> <strong>of</strong> <strong>Communities</strong>Adjacent to Lake Bisina/Opeta and Lake Mburo/Nakivali Wetland Systems31
3.3.2 Sources <strong>of</strong> income in Lake Mburo-Nakivali areaJust as in equal measure as crop cultivation, cattle keeping is an importanteconomic activity in the area. This area relatively food secure through out theyear and it is considered a food basket for city dwellers There are a number <strong>of</strong>wetlands both within and outside the Lake Mburo National Park that supportthese economic activities. During the dry season, the local communitiesnormally graze and water their animals in the park in accordance with termsand conditions stipulated in the Memorandum <strong>of</strong> Understanding with <strong>Uganda</strong>Wildlife Authority. The local community uses the nearby wetlands as a source <strong>of</strong>water for both domestic use and livestock feeding.Photo 4: Community initiatives for Natural Resource ManagementOne <strong>of</strong> the tree nurseries established by the community inKashumba S/C with the technical support <strong>of</strong> Isingiro District Wetlands OfficeLocal communities also harvest the natural herbaceous vegetation e.g. papyrusfor crafts and for production <strong>of</strong> fish-mats by fishermen. The lakes (especiallyLake Mburo) are an important source <strong>of</strong> fish proteins for domestic consumptionas well as commercial purposes. Fishing is a long established activity in the LakeMburo – Nakivali area and remains one <strong>of</strong> the area’s most significant economicactivities in addition to cattle keeping and banana growing. Fishing therefore<strong>of</strong>fers considerable employment opportunities to a number <strong>of</strong> fishermen in thenearby villages.32A <strong>Socio</strong>-<strong>Economic</strong> <strong>Baseline</strong> <strong>Survey</strong> <strong>of</strong> <strong>Communities</strong>Adjacent to Lake Bisina/Opeta and Lake Mburo/Nakivali Wetland Systems
The communities in this area have started to appreciate the need for wetlandmanagement and have, accordingly, taken it on proactively. For instance inIsingiro district a community is raising seedlings to plant along Lake Nakivali tocurtail further degradation.The discussion below focuses on the specifics <strong>of</strong> each district and their socioeconomiclifestyles in this COBWEB project site.RESPONSES70605040302010OFig. 9: Main sources <strong>of</strong> income in the communities around Lake Mburo – Nakivalisystema) Mbarara DistrictMbarara is one <strong>of</strong> the urban districts in the western region. On her part, localpeople in Mbarara district are engaged in trade, crop growing and cattle keeping,while the private sector and business community are involved in large scalebusinesses, manufacturing and production. The survey carried out in Kakiikaand Kakoba divisions <strong>of</strong> the municipality shows that most respondents fell in the‘well-<strong>of</strong>f’ and ‘moderately well-<strong>of</strong>f’ categories <strong>of</strong> wealth status (as per the teamswealth assessment criteria).Although it may be said that there is minimal direct interaction with wetlandsin Mbarara, a visit to Rwemigina Parish in Kakiika division showed that farmershad cultivated up to the wetlands in the area, thus gradually reducing their size.In an interview with the District Wetlands Officer, emerging water quality issuesdownstream were attributed to negative human activity in wetlands. In addition,Mbarara is seen as the source <strong>of</strong> silting in Isingoiro district with an upstreamimpact on Lake Nakivali and the adjacent wetlands. Apart from the sensitizationprogrammes conducted by the district about wetlands, there is nothing muchA <strong>Socio</strong>-<strong>Economic</strong> <strong>Baseline</strong> <strong>Survey</strong> <strong>of</strong> <strong>Communities</strong>Adjacent to Lake Bisina/Opeta and Lake Mburo/Nakivali Wetland Systems33
eing done at community level to counter the destructive/degrading practices inwetlands in the district.b) Isingiro DistrictFormerly part <strong>of</strong> Mbarara district, Isingiro hosts Lake Nakivali and the Governmentrefugee resettlement programme. The latter presents a multiplicity <strong>of</strong> culturaland socio-economic factors owing to the differences in ways <strong>of</strong> life <strong>of</strong> peoplethat converge in the resettlement camp. Fishing is a key economic activity in thearea, with limited regulation <strong>of</strong> the activity. Due to reduced fish stocks in thelake, communities have resorted to wetlands especially for mudfish. Wetlandsalso serve as sources <strong>of</strong> water for cattle and fertile land for crop cultivation.In Isingiro, the degradation <strong>of</strong> wetlands had received district and communityattention, and some restorative measures have been put in place. For instancethe communities together with Isingiro Local Government have raised treenurseries to restore the lost vegetation and also reduce pressure on wetlandsby providing alternative sources <strong>of</strong> wood, poles and biomass sources thatcommunities currently harvest from wetlands. It is also believed that once theseedlings are planted, it will create an opportunity for wetlands areas to recover,and also perform their functions once again.However, participants noted that a combination <strong>of</strong> lack <strong>of</strong> clear wetlandboundaries and lack <strong>of</strong> wetland by-laws to foster compliance poses a challengeto implementation <strong>of</strong> efforts towards the wise use and conservation <strong>of</strong> wetlandsin the district. Indeed, opportunistic and direct observation showed that bushburning and cultivation inside the wetlands was considered normal with hardlyany concern about the ecological functions and services at stake.c) Rakai DistrictIn Rakai district, the hilly terrain leaves little productive land for crop cultivationand cattle keeping, which in addition to fishing are the main economic activities<strong>of</strong> communities in the district, and in the sub-counties <strong>of</strong> Kyarurangila andKakyeera in particular. During the dry seasons, Rakai is one <strong>of</strong> the districtsin <strong>Uganda</strong> that are affected by famine and this drives farmers to wetlandsfor moisture. In addition, interviews also indicated that their soils are gettingexhausted and that wetlands remain the only alternative for cultivation.About 72.8% <strong>of</strong> the households interviewed fell into the ‘poor category’ andjust above a quarter were found to be ‘moderately well-<strong>of</strong>f’ according to thesurvey team’s grading criteria. The sources <strong>of</strong> income included the sale <strong>of</strong> farmproduce, fish, milk and livestock, and providing casual labour – in that order.On average, monthly household income were found to be in the range <strong>of</strong> UGX60,000 – 270,000 only.34A <strong>Socio</strong>-<strong>Economic</strong> <strong>Baseline</strong> <strong>Survey</strong> <strong>of</strong> <strong>Communities</strong>Adjacent to Lake Bisina/Opeta and Lake Mburo/Nakivali Wetland Systems
Unlike most <strong>of</strong> the other districts visited, the awareness about degradingpractices in wetlands was very noticeable amongst respondents. As put by aninterviewee,“…charcoal burning, brick laying and burning grass in wetlands forpasture are the main causes <strong>of</strong> wetland degradation, yet there isnoeffort to stop those involved”.- Orishaba Madinah, 30, Rwambajjo – Kyarurangila in Rakai -Whereas respondents reported that there have been some attempts, such as,sensitization campaigns by the district to advise wetland resource users on bestuser practices in wetlands. These were not adequate enough to effect changesin the ways local communities utilize wetlands. This points to the need for morecapacity development and strengthening community engagements on wise usestrategies for wetland resources.d) Kiruhura DistrictThe survey was conducted in the sub-counties <strong>of</strong> Sanga and Kanyaryeru in Kiruhuradistrict. The two sub-counties were sampled because they are representativeenough <strong>of</strong> the socio-economic setup <strong>of</strong> the entire district. The area has a verysparse population ranging between 16-48 persons/sq km. This could be becausea big part <strong>of</strong> the population are pastoralists, who own relatively large pieces <strong>of</strong>land, and much <strong>of</strong> the remaining land in Sanga sub-county land is occupied byLake Mburo National Park in the south and the government ranches to the north.The population here is mixed with pastoralists and cultivators living side by side.Due to large cattle herds kept in this mainly dry cattle corridor, the seasonalwetlands are completely overgrazed in the dry season, but get flooded in the wetseason. The district experiences extreme dry periods here and wetlands becomean important life support system for humans, livestock and wildlife. Whereasaccess to resources in the permanent wetland within Lake Mburo National Parkis regulated by issuance <strong>of</strong> permits, the rest <strong>of</strong> the wetlands outside the PA aresubjected to the open access regime, which fuels resource overexploitation andconsequent degradation.Crop growing and fishing are the other economic activities in this area thatdeserve a mention. Catfish fish (Clarias gariepinus) locally known as emale inparticular serve both commercial and household purposes. <strong>Communities</strong> getpapyrus and water from these wetlands as and when need arises. Papyrus isan important ro<strong>of</strong>ing material, and is also used to weave mats and baskets forsale. Wetland grass and poles are also important for thatch and constructionrespectively.A <strong>Socio</strong>-<strong>Economic</strong> <strong>Baseline</strong> <strong>Survey</strong> <strong>of</strong> <strong>Communities</strong>Adjacent to Lake Bisina/Opeta and Lake Mburo/Nakivali Wetland Systems35
Table 6: Sources <strong>of</strong> income around Bisina-Opeta * Sources <strong>of</strong> income aroundMburo-Nakivali CrosstabulationSources<strong>of</strong> incomearoungBisina-OpetaMilk andlivestockSources <strong>of</strong> income around Mburo-NakivaliMilk andlivestockFarmproduceCommercialbusinesses FishingTotal40 9 0 0 49Farmproduce0 54 0 0 54Brewingalcohol0 6 2 0 8Fishing 0 0 5 12 17Total 40 69 7 12 128From the crosstabulation <strong>of</strong> sources <strong>of</strong> income in the two sites in the tableabove, it emerged that wetlands support the main means <strong>of</strong> livelihood withcattle keeping, cultivation and fishing overlapping responses both in Eastern/North Eastern <strong>Uganda</strong> as well as Western <strong>Uganda</strong> project sites.Table 7: Correlating sources <strong>of</strong> income in the different project sites toestablish the possibility <strong>of</strong> a relationshipCorrelationsSources <strong>of</strong> incomearoung Bisina-OpetaSources <strong>of</strong> incomearound Mburo-NakivaliSources <strong>of</strong>income aroundBisina-OpetaSources <strong>of</strong> incomearound Mburo-NakivaliPearson1 .918(**)CorrelationSig. (2-tailed) . .000N 192 128PearsonCorrelation.918(**) 1Sig. (2-tailed) .000 .N 128 128** Correlation is significant at the 0.01 level (2-tailed).36A <strong>Socio</strong>-<strong>Economic</strong> <strong>Baseline</strong> <strong>Survey</strong> <strong>of</strong> <strong>Communities</strong>Adjacent to Lake Bisina/Opeta and Lake Mburo/Nakivali Wetland Systems
Pearson correlation (in the table above) indicates a significant relationshipbetween the two project sites in terms <strong>of</strong> economic engagements for householdincome. This is explained by the involvement <strong>of</strong> communities in crop growingand cattle keeping, which feature in both sites predominantly.Table 9: Ranking the occupations/sources <strong>of</strong> householdincome for the surveyed households1 st Rank 2 nd Rank 3 rd Rank 4 th Rank 5 th Rank<strong>Economic</strong> Activity f % f % f % f % f %Crop farming 125 39.0 42 14.3 16 11.3 8 11.7 09 16.4Business 18 5.65 32 10.7 14 9.80 14 20.6 06 10.9Salaried employment 08 2.50 06 2.00 10 7.00 0 0.0 01 1.80Livestock farming 67 20.9 98 32.7 15 10.5 06 8.70 0 0.0Casual labour 09 2.80 13 4.30 05 3.50 0 0.0 2 3.60Building/construction 21 6.60 04 1.30 0 0.0 01 1.5 0 0.0Rental income 04 1.20 11 3.60 02 1.40 0 0.0 0 0.0Brewing (local alcohol) 06 1.80 11 3.60 04 2.80 02 3.00 04 7.20Remittances fromrelatives07 2.10 04 1.30 01 0.70 02 3.00 1 1.80Fuel wood sale 08 2.50 09 3.00 2 1.40 0 0.0 0 0.0Fishing 24 7.50 10 3.30 10 7.00 07 10.3 2 3.60Fish farming 03 0.90 06 2.00 0 0.0 02 3.00 0 0.0Charcoal burning 01 0.30 03 1.00 08 5.70 01 1.50 01 1.80Craft making 05 1.50 10 3.30 09 6.40 04 5.8 02 3.60Poultry farming 02 0.60 11 3.60 22 15.5 09 13.2 14 25.5Forestry/woodlot 01 0.30 03 1.00 0 0.0 0 0.0 0 0.0Brick making 09 2.86 21 7.30 16 11.3 10 14.7 12 22.0Bee keeping 02 0.60 05 1.7 08 5.70 02 3.00 01 1.80Total 320 100 299 100 142 100 68 100 55 100A <strong>Socio</strong>-<strong>Economic</strong> <strong>Baseline</strong> <strong>Survey</strong> <strong>of</strong> <strong>Communities</strong>Adjacent to Lake Bisina/Opeta and Lake Mburo/Nakivali Wetland Systems37
3.4 Value attachment to wetlandsThe survey reveals that communities derive a number <strong>of</strong> benefits from wetlands,which they say contribute enormously to their livelihoods. Asked for theiropinions on whether or not the wetland areas in their respective localitiesshould be maintained in the same kind <strong>of</strong> land use, 99.1% answered in theaffirmative while 0.9% did not seem to care. However, the appreciation seemedto be largely limited to tangible benefits derived from wetlands. Only 11.9% <strong>of</strong>the respondents were able to articulate some intrinsic values <strong>of</strong> wetlands in theproject areas where the survey was conducted.The inability to adequately comprehend wetland values in totality is on the onehand a signal for a gap in the awareness campaigns spearheaded by districtwetland <strong>of</strong>fices, while on the other hand it is an eye opener for COBWEBimplementation on urgent requirements for the success <strong>of</strong> the project. Takingthe ‘first things first approach’, then the PIT could prioritize such informationneeds to lay a firm foundation for other project outcomes.Table 10: Responses to wetland products highlighted bycommunitiesWhich wetland resource does thishousehold use?Frequency(f)Percentage(%)Rank1. Water for domestic use 262 81.8 12. Water for irrigation 68 21.2 143. Water for brewing 24 7.50 204. Water for livestock 196 61.2 35. Land for cultivation 228 71.5 26. Land/pasture for grazing livestock 184 57.5 47. Land for growing trees (woodlots) 0 0.00 258. Fish 171 53.4 59. Land for settlement 6 1.80 2210. Building materials 98 30.6 1011. Papyrus 105 32.8 912. Hunting 27 8.40 1913. Crafts materials 120 37.5 814. Grass 72 22.5 1338A <strong>Socio</strong>-<strong>Economic</strong> <strong>Baseline</strong> <strong>Survey</strong> <strong>of</strong> <strong>Communities</strong>Adjacent to Lake Bisina/Opeta and Lake Mburo/Nakivali Wetland Systems
15. Fibre 38 11.8 1716. Wild fruits 4 1.25 2317. Medicinal herbs 66 20.6 1518. Rattan cane 2 0.60 2419. Palm leaves 18 5.60 2120. Bee keeping 79 24.6 1221. Fish farming 39 13.2 1622. Cultural activities 31 9.60 1823. Clay 132 41.2 724. Sand 87 27.2 1125. Firewood 163 50.9 63.4.1 What drives people into the wetlands?Discussions were held on what drives people into wetlands with the purpose<strong>of</strong> establishing what value the respondents attach to the wetland ecosystem.This was intended to gauge the level <strong>of</strong> flexibility in terms <strong>of</strong> accessing andusing wetland goods and services. The findings indicate that some communitymembers chose the current locations because <strong>of</strong> the presence <strong>of</strong> a wetland.Important to note also is that some wetland products have no substitutes andyet community members cannot do without them. For instance in Nakapiripiriti,the respondents noted that stopping them from accessing wetlands is doom fortheir livestock. The same sentiments were echoed by those who go to wetlandsin search <strong>of</strong> herbs. The diagram below shows the main goods and services thatdrive community members into wetlands.Fig. 10: Resource uses that drive communities into wetlandsA <strong>Socio</strong>-<strong>Economic</strong> <strong>Baseline</strong> <strong>Survey</strong> <strong>of</strong> <strong>Communities</strong>Adjacent to Lake Bisina/Opeta and Lake Mburo/Nakivali Wetland Systems39
3.4.2 Viability <strong>of</strong> alternativesThe survey team took <strong>of</strong>f time to find out from the communities about thealternatives to the current wetland uses and use type. Then subsequently, aviability check was run on each to be able to advise the implementation <strong>of</strong> theproject more practically. Some <strong>of</strong> the alternatives the community members raisedinclude; cultivating only in the wet season, using wetland friendly methods <strong>of</strong>farming, planting trees on their lands and no alternatives were raised for culturaluses such as fishing, cattle keeping and herbs from wetlands. Additionally, inareas where wetlands are the only connection between communities and theLake for water transport, no quick alternative could be thought <strong>of</strong>.It is also important to note from the previous sections that activities that canbe sustainably carried out in wetlands did not rank high as current livelihood/income sources for each <strong>of</strong> the sites. These include fishing, fish farming, craftmaking, forestry/woodlot management and bee keeping. This demonstratesthat the COBWEB project will have to put in a lot <strong>of</strong> effort in identifyingand promoting sustainable activities, to increase their pr<strong>of</strong>iles in householdeconomies as alternatives to unsustainable uses <strong>of</strong> wetlands. However, it shouldbe born in mind these will be different for different regions/project sites, bearingin mind societal value attachment, culture and contribution to the achievement<strong>of</strong> the project goals and objectives.Photo 5: The wetland in Korir S/C, Bukedea district is used to connect to LakeBisina for water transport40A <strong>Socio</strong>-<strong>Economic</strong> <strong>Baseline</strong> <strong>Survey</strong> <strong>of</strong> <strong>Communities</strong>Adjacent to Lake Bisina/Opeta and Lake Mburo/Nakivali Wetland Systems
3.4.3 Interventions to ensure sustainable utilization <strong>of</strong>wetlandsRespondents were asked what needs to be done to ensure sustainable wetlandutilization. The need to intensify sensitization on wise wetland use topped thelist <strong>of</strong> suggestions as identified by 30% <strong>of</strong> the survey participants, followedby the need to enact and enforce laws and enact by-laws at community level(28.3%). Also important was the need to clearly demarcate wetland boundaries(26.3%) <strong>Communities</strong> claim that it is unclear where their land ends and wetlandsbegin.People also identified the need for planning at local level, to draft wetland zoningsystems and village resource use plans although this was not ranked among thetop three priorities. Other suggestions hinged on training in improved naturalresource management (soil conservation, fishing to be overseen by communityresource persons), and interventions that would reduce community dependencyon wetland resources such as tree planting, water sources like dams, boreholes,gravity and piped water and fish ponds.3.4.4 Community training needsRespondents were asked whether, according to them, there are any aspects inwhich their communities needed to be trained in order to improve the mannerin which they interface with wetlands and the resources therein. Virtuallyeverybody (99.2%) answered in the affirmative. Training needs cited includedawareness creation on wetland laws and guidelines which topped the list asmentioned by 40% <strong>of</strong> the respondents. In addition, 22% said there is need toraise awareness on the values <strong>of</strong> wetlands. .Most <strong>of</strong> the other training needs were to do with improving wetland resourcemanagement (such as farming methods within the wetlands, beekeeping, fishingmethods, livestock management, craft making) and training in options to reducedependency on wetlands (such as alternative income generating projects andfuel saving technologies). The range <strong>of</strong> training needs was quite diverse as shownin the table below.A <strong>Socio</strong>-<strong>Economic</strong> <strong>Baseline</strong> <strong>Survey</strong> <strong>of</strong> <strong>Communities</strong>Adjacent to Lake Bisina/Opeta and Lake Mburo/Nakivali Wetland Systems41
Photo 6: Rice growing in wetlands in Bunambutye S/C, SironkoDistrictTable 11: Aspects in which community members requiretrainingTraining needsWetland laws and guidelines <strong>of</strong> wetlandutilisation and ownershipBisina/Opeta (%)Mburo/Nakivali(%)Total (%)48.7 37.0 85.7Better farming methods 13.2 54.4 67.6Awareness raising on values <strong>of</strong>wetland28.3 15.4 43.7Better fishing methods in wetlands 5.3 0.0 5.3Tree planting and management 0.0 8.7 8.7Fish farming 2.7 6.7 9.4Improved livestock management 2.6 2.7 5.342A <strong>Socio</strong>-<strong>Economic</strong> <strong>Baseline</strong> <strong>Survey</strong> <strong>of</strong> <strong>Communities</strong>Adjacent to Lake Bisina/Opeta and Lake Mburo/Nakivali Wetland Systems
Alternative income generating projectsmanagement1.3 5.4 6.7Bee keeping 1.3 2.0 3.3Organic farming 0.7 0.0 0.7Craft making 2.0 0.0 2.0Pollution control 0.8 1.1 1.9Financial management within thehome0.7 2.1 2.8Fuel saving technologies 1.5 0.0 1.5Group formation and dynamics 1.3 1.0 2.3Don’t know 23.8 34.4 58.2Respondents were also asked to identify who in the community needs to betrained. Cultivators were the most cited (57%) because, as this survey revealed,cultivation is the most widespread use <strong>of</strong> wetlands at the moment, and at thesame time communities were <strong>of</strong> the view that it is also the activity with thehighest negative effect on wetlands. The next training target identified were thelandowners adjacent to wetlands (17%) because these are the wetland “owners”and they make key decisions for utilization <strong>of</strong> wetlands. Livestock grazing isanother common use <strong>of</strong> wetlands and so livestock keepers were identified astraining targets (13%).3.5 Factors affecting communities in surveyed areasThe analysis <strong>of</strong> social interactions in communities and economic lifestylespointed to a number <strong>of</strong> factors with a bearing on their socio-economic wellbeing.Whereas wetlands are looked at as source <strong>of</strong> livelihood, community needs arenot met adequately, and yet there is potential for satisfaction. The survey alsogenerated information to the effect that the current wetland practices are notsustainable, and there are evidences in shrinking wetland sizes, with reducingassociated community and individual benefits. The following factors wereidentified as limiting the levels <strong>of</strong> access <strong>of</strong> wetland benefits to the communitiesconsidered for the socio-economic survey.A <strong>Socio</strong>-<strong>Economic</strong> <strong>Baseline</strong> <strong>Survey</strong> <strong>of</strong> <strong>Communities</strong>Adjacent to Lake Bisina/Opeta and Lake Mburo/Nakivali Wetland Systems43
Photo 7: Julius Mafumbo, WMD (white T-shirt) takes notes in a groupdiscussion as respondents in Kapujan S/C, Katakwi district brainstormon their social problems.There is a general level <strong>of</strong> ignorance and a lack <strong>of</strong> awareness among thepopulation <strong>of</strong> the adverse consequences <strong>of</strong> their actions on the wetlands.<strong>Communities</strong>, who generally are agro-based and look at wetlands as a meanstowards achieving high production levels. There are hardly any thoughts put tothe survival <strong>of</strong> the wetlands and their ability to adequately meet future needs. Itis therefore not surprising that when asked about the importance <strong>of</strong> wetlands,respondents mainly thought <strong>of</strong> tangible benefits until probed to think aboutother ecological aspects.44A <strong>Socio</strong>-<strong>Economic</strong> <strong>Baseline</strong> <strong>Survey</strong> <strong>of</strong> <strong>Communities</strong>Adjacent to Lake Bisina/Opeta and Lake Mburo/Nakivali Wetland Systems
The sites visited exhibited a lack <strong>of</strong> trained and committed personnel in wetlandresources management at community level. The only service provider in theLocal Government is a Wetlands Officer based at the district. The DWO on theother hand is incapacitated by financial, technical and personnel issues, whichrenders this <strong>of</strong>fice insufficient to deliver on its mandate and as result to ensurewise use <strong>of</strong> wetlands while at the same time maximizing community benefits.There is inadequate and/or weak institutional coordination and links onenvironment management in general and wetland conservation in particular.Wetland use and management is dispersed in several Government and Non-Governmental Organizations strategies and programmes with no operationalcoordinating mechanisms at most levels. As a result, interventions calculated tomaximize benefits from wetlands to communities are not sustained and end upnot causing the expected impact on the ground.The other notable factor is about the selfish nature <strong>of</strong> community members thatdebars them from looking at a community as a whole but rather themselves asindividuals. During the discussions, it emerged that respondents did not attachmuch value to the benefits that accrue to the community, singling out onlybenefits that come to them in their individual capacities. Such an attitude is sochallenging to programme design in terms <strong>of</strong> how interventions are framed tomeet the needs <strong>of</strong> their target beneficiaries in an environmentally friendly andwetland supportive manner.Overdependence on agriculture and an apparent minimal diversification <strong>of</strong>livelihoods is a limiting factor to enjoyment <strong>of</strong> wetland resources. Most peopleare entirely dependant on crop cultivation and animal rearing. These areseasonal activities that are dictated upon by seasonality (dry or wet conditions)and this ultimately impacts a lot on wetlands especially during the dry seasonwhen agricultural activity can only meaningfully thrive in wetlands, also inthe absence <strong>of</strong> irrigation structures at community level. Under this aspect,communities neither have the means nor the capacity for a viable alternative.A <strong>Socio</strong>-<strong>Economic</strong> <strong>Baseline</strong> <strong>Survey</strong> <strong>of</strong> <strong>Communities</strong>Adjacent to Lake Bisina/Opeta and Lake Mburo/Nakivali Wetland Systems45
4.0 INTERVENTIONS/RECOMMENDATIONS TOADDRESS THE EMERGING ISSUESConsidering the in-depth assessment <strong>of</strong> community socio-economics, theirinteractions with wetlands, the value they attach to wetlands, the problemstherein, community expectations <strong>of</strong> the COBWEB project and their limitations,the survey gave respondents an opportunity to input into the way forward for wisewetland use and resource conservation. This gave participants an opportunity tomake recommendations from their own perspective. The survey team used theseand their general understanding <strong>of</strong> the project sites to advance a number <strong>of</strong> nextsteps in an effort to advise COBWEB from this information point <strong>of</strong> view.4.1 Develop, update and implement CWMP: The survey found out that thereare some CWMP in place around the Lake Bisina and Lake Mburo areas butnone for other areas <strong>of</strong> project focus. There has also been an effort to start onthe process <strong>of</strong> developing management plans for wetlands <strong>of</strong> Lake Nakivali,which need to be finalized. The process <strong>of</strong> coming up with a CWMP is usuallyconsultative and participatory in nature and this gives an opportunity for projectimplementers to instill and strengthen a sense <strong>of</strong> ownership in communitiesover project outcomes. Besides, it is much easier to implement a project <strong>of</strong>COBWEB’s nature <strong>of</strong> design in an area that has a Community based WetlandManagement Plan for political and stakeholder considerations. It is upon thisbackground therefore that we recommend that the project embarks on anexercise to formulate management plans and update those others where theyexist for a smooth implementation.4.2 Demarcate wetland boundaries and create buffer zones: With the support<strong>of</strong> the Local Government, the COBWEB implementation needs to initiateefforts targeting the demarcation <strong>of</strong> wetland boundaries from community andindividual land. As it is now, the survey discovered that wetland boundarieshave never been marked out in most <strong>of</strong> the areas visited and there was confusionon where community land ends or where the wetland starts. This looked more<strong>of</strong> a weakness currently exploited by wetland resource users to encroach onwetlands. Once the process <strong>of</strong> demarcating boundaries is on course, thenbuffers zones can be put in place as a measure to reinforce the ‘respect’ forthose boundaries.46A <strong>Socio</strong>-<strong>Economic</strong> <strong>Baseline</strong> <strong>Survey</strong> <strong>of</strong> <strong>Communities</strong>Adjacent to Lake Bisina/Opeta and Lake Mburo/Nakivali Wetland Systems
4.3 Intensify awareness creation: While community participation is alreadybeing archived through formation <strong>of</strong> Community Based Wetland ManagementPlans (CWMP), sensitization and educational programs to empower localcommunities with knowledge and awareness particularly on the ecologicalroles <strong>of</strong> wetlands need to be scaled up to influence a positive shift <strong>of</strong> attitudeand practices towards these ecosystems4.4 By-law formulation: The survey team made an observation that there wasa general lack <strong>of</strong> by-laws to guide the implementation <strong>of</strong> interventions gearedtowards wetland resources management, and that resource degradation wasbeing done with impunity. To counter this, we recommend that the COBWEBproject triggers a process <strong>of</strong> enacting wetland by-laws and advises districts onan effective implementation mechanism. This can be done by bringing districtcouncils on board in the implementation <strong>of</strong> the 4-year interventions in theirrespective jurisdictions.4.5 Needs assessment: The current level <strong>of</strong> reliance on wetlands for survival istoo overwhelming and in most areas the footprint can be seen. The demand forwetland resources in the surveyed areas is far beyond the ecosystem’s carryingcapacity, which is a recipe for resource degradation, reduced production,poor community health and aggravated poverty. There is, therefore, a needfor COBWEB, with the support <strong>of</strong> the district, to assess needs <strong>of</strong> communitiesadjacent to wetlands and advise accordingly on how such needs can beaddressed without necessarily degrading the wetland resource.4.6 Popularize and enforce Environmental Impact Assessment: EIA as a toolfor natural resource management (NRM) must be popularized and rigorouslyenforced for all proposed activities on wetlands for purposes <strong>of</strong> inclusion inwetland management planning and for resource use examination. In addition,with respect to <strong>Uganda</strong>’s commitment to wetland management, new andinnovative approaches that effectively integrate various aspects <strong>of</strong> wetlandmanagement be adopted to curtail the current excesses in human activity thatdegrade catchments and breed ecological imbalance.4.7 Advise on wetland-based ecologically friendly enterprises: The COBWEBproject should advise on activities that can be sustainably carried out in wetlandsin an environmentally sound manner but yet making substantial contributionsto household incomes. Enterprises related to eco-tourism, fish farming, craftmaking, forestry/woodlot management and bee keeping have proven theircapacity to uplift communities from poverty and when well designed, they aremore income generating than traditional destructive activities that communitiesfind comfort in, in wetlands.A <strong>Socio</strong>-<strong>Economic</strong> <strong>Baseline</strong> <strong>Survey</strong> <strong>of</strong> <strong>Communities</strong>Adjacent to Lake Bisina/Opeta and Lake Mburo/Nakivali Wetland Systems47
4.8 Factor in rural poverty: All through this report, we have laboured todemonstrate that the majority <strong>of</strong> the wetland adjacent communities are lowincome earners, perhaps due to limited alternative sources <strong>of</strong> income, low levels<strong>of</strong> education and cultural influence. Because <strong>of</strong> this, communities continuallylook at wetlands as the only means towards getting out <strong>of</strong> poverty, by way<strong>of</strong> using wetland-based goods and services to generate income but also forhousehold survival. Indeed, discussions with communities revealed that povertywas one <strong>of</strong> the driving forces to wetland resource use (or misuse). This is likelyto have implications on the extent to which project outcomes can be achieved.Thus there is need to promote alternative sustainable wetland-based activitiesand non wetland-based activities to double in reducing rural poverty, while atthe same time easing the pressure on wetlands.4.9 Information packaging: The way information on wetlands is packaged andcommunicated to its target audience will make a substantial difference frommere communication in the ordinary sense <strong>of</strong> the word. The survey findingsreveal that formal education levels <strong>of</strong> most <strong>of</strong> the people in the communitiesneighbouring the wetlands are generally low. The fact that majority <strong>of</strong> thehousehold decision makers have no formal education has implications for thetype <strong>of</strong> wetland management and conservation message packaged for theirconsumption. As such the project ought to package its information in tailormadestyles and adopt direct communication methods e.g. village meetingsand radio communication, and probably posters in the local languages as amore appropriate communication medium in communities <strong>of</strong> this kind <strong>of</strong> socioculturaland economic set up.48A <strong>Socio</strong>-<strong>Economic</strong> <strong>Baseline</strong> <strong>Survey</strong> <strong>of</strong> <strong>Communities</strong>Adjacent to Lake Bisina/Opeta and Lake Mburo/Nakivali Wetland Systems
5.0 CONCLUSIONSThere is evidence to indicate that <strong>Uganda</strong>’s history in wetland management hasnot been without key milestones. Since1986, a number <strong>of</strong> landmarks have beenmade in legal and institutional development in response to undesirable trendsin wetland destruction over the years. The constitution and the subsequent lawsare quite realistic and impermeable. The requirement for Environmental ImpactAssessments for example has been used as a decision making tool in the use <strong>of</strong>some wetlands. However a number <strong>of</strong> limitations and challenges still prevail andneed serious attention. The success <strong>of</strong> the COBWEB project will be determinedby the level <strong>of</strong> understanding <strong>of</strong> such impeding issues and the ability to designmechanisms for overpowering them.The importance <strong>of</strong> wetlands in <strong>Uganda</strong> cannot be underrated and as evidence,almost all households surveyed in areas around Lake Bisina/Opeta and LakeMburo/Nakivali benefit from wetlands in various ways. These findings show therole wetlands play in the lives <strong>of</strong> these communities. On the other hand this givesan idea on the extent <strong>of</strong> pressure that is being exerted to wetlands. Communitytraining needs must be met, awareness creation on wetland values intensified,and laws and guidelines for wetland utilization formulated.The project has raised expectations <strong>of</strong> stakeholders in their different capacities. Aparticipatory approach to the implementation <strong>of</strong> COBWEB will go a long way inironing out conflicts interest and giving an opportunity to stakeholders to partakein deciding on the next steps at different phases <strong>of</strong> project implementation.This will also concretize the sustainability plan, especially if target frontlinebeneficiaries (communities) get a sense that this is for their own good.A <strong>Socio</strong>-<strong>Economic</strong> <strong>Baseline</strong> <strong>Survey</strong> <strong>of</strong> <strong>Communities</strong>Adjacent to Lake Bisina/Opeta and Lake Mburo/Nakivali Wetland Systems49
ReferencesApunyo, R. (2008); Managing Wetlands with Changing Times: <strong>Uganda</strong>’sExperience.GoU (2001); Wetland Sector Strategic Plan 2001-2010IUCN (2005); From Conversion to Conservation: Fifteen Years <strong>of</strong> ManagingWetlands for People and the Environment in <strong>Uganda</strong>.Jones, R. Kamugisha (1993); Management <strong>of</strong> Natural Resources andEnvironment in <strong>Uganda</strong>: Policy and Legislation Landmarks, 1890-1990.Published by SIDA Regional Soil Conservation Unit, RSCU, Nairobi, 1993.NEMA (2006); State <strong>of</strong> Environment Report for <strong>Uganda</strong>.The Constitution <strong>of</strong> the Republic <strong>of</strong> <strong>Uganda</strong> 1995.The Land Act <strong>of</strong> the Republic <strong>of</strong> <strong>Uganda</strong>, 1998.The Local Governments Act <strong>of</strong> the Republic <strong>of</strong> <strong>Uganda</strong>, 1997.The National Wetlands Policy 1995.The Ramsar Convention on the Management <strong>of</strong> Wetlands <strong>of</strong> InternationalImportance, 1971.UBOS (2002); <strong>Uganda</strong> Population and Housing CensusUBOS (2006); Population Projections50A <strong>Socio</strong>-<strong>Economic</strong> <strong>Baseline</strong> <strong>Survey</strong> <strong>of</strong> <strong>Communities</strong>Adjacent to Lake Bisina/Opeta and Lake Mburo/Nakivali Wetland Systems
APPENDICESAppendix I: Indicators generated to monitor progress in achieving theproject aim, objectives and outcomes• Number <strong>of</strong> by-laws enacted and implemented for wetland conservation;• Number <strong>of</strong> CWMP developed and implemented in the project sites;• Number <strong>of</strong> policies influenced to integrate wetland issues;• Number <strong>of</strong> wetlands with clearly demarcated boundaries;• Number <strong>of</strong> planning processes influenced at district and sub-countylevels to prioritize wetland issues in their jurisdictions;• Number <strong>of</strong> people understanding the legal provisions on wetlandutilisation and ownership among the communities;• Number <strong>of</strong> Local Councils/Local Environment Committees activelyengaged in monitoring wetland activities;• Number <strong>of</strong> existing wetland use-related conflicts;• Number <strong>of</strong> households involved in sustainable wetland utilisationactivities (such as fishing, fish farming, beekeeping, craft making) inhousehold economies;• Wetland acreage under cultivation;• Number <strong>of</strong> community members appreciating other ecological functions<strong>of</strong> wetlands apart from storing water and bringing rainfall;• Number <strong>of</strong> community members appreciating, aesthetic and culturalvalues <strong>of</strong> wetlands;• Number <strong>of</strong> technologies adopted by communities to reduce wetlanddegradation;• Number <strong>of</strong> wetland resources used for commercial purposes that can beharvested sustainably;• Number <strong>of</strong> people relying on wetland resources;• Number <strong>of</strong> people undertaking wetland-based activities that havenegative impact on wetlands;• Number <strong>of</strong> people undertaking actions to reduce or mitigate negativeimpact <strong>of</strong> their activities on wetlands;• Number <strong>of</strong> training events carried out among local communities toincrease their knowledge <strong>of</strong> wetland laws and values;• Number <strong>of</strong> people adjacent to the wetlands knowledgeable in laws andregulations governing wetland utilisation;• Acreage <strong>of</strong> former degraded wetland area restored;• Number <strong>of</strong> people knowledgeable in wetland values, both tangible andintrinsic;• Number <strong>of</strong> local communities involved in the process <strong>of</strong> enactingwetland utilisation bylaws;• Number <strong>of</strong> bye law enforcement cases handled by Local EnvironmentCommittees.A <strong>Socio</strong>-<strong>Economic</strong> <strong>Baseline</strong> <strong>Survey</strong> <strong>of</strong> <strong>Communities</strong>Adjacent to Lake Bisina/Opeta and Lake Mburo/Nakivali Wetland Systems51
Appendix II: Wealth categorization criterionWell-<strong>of</strong>f• Owns apermanenthouse• House hasadequatesanitaryservices• Owns abusiness• Owns a tractor• Has over 20cows• Owns over 20acres <strong>of</strong> land• Is able tosustain hisfamily/providefor essentialfamily needsModeratelywell-<strong>of</strong>f• Ownsa semipermanenthouse• Has 4 oxenand above• Owns 10acres <strong>of</strong> land• Has a retailshop fordaily incomePoor• Does notown land• Resident insomeone’shouse• Goes forcasuallabour tobe able t<strong>of</strong>eed hisfamily• Sleeps onmats, rugsand nomattressVery poor/Destitute• Has nodomesticanimals/birds• Has nosource <strong>of</strong>income• Begsthrough outfor survival52A <strong>Socio</strong>-<strong>Economic</strong> <strong>Baseline</strong> <strong>Survey</strong> <strong>of</strong> <strong>Communities</strong>Adjacent to Lake Bisina/Opeta and Lake Mburo/Nakivali Wetland Systems
Appendix III: Sub-counties sampled for the survey in theproject sitesName <strong>of</strong> DistrictSironkoKatakwiKumiNakapiripiritBukedeaSorotiIsingiroBunambutyeMuyembeMagoroKapujanKumiKolirNamaluLorachatMaleraKorirGweriArapaiKashumbaIsingiro TCSelected sub-countiesMbararaKakoba divisionKakiika divisionRakaiKyarulangilaKakyeeraKiruhuraSangaKanyaryeruA <strong>Socio</strong>-<strong>Economic</strong> <strong>Baseline</strong> <strong>Survey</strong> <strong>of</strong> <strong>Communities</strong>Adjacent to Lake Bisina/Opeta and Lake Mburo/Nakivali Wetland Systems53
Appendix IV: <strong>Survey</strong> instrument used during the field interactionsName <strong>of</strong> interviewer: ………………………………………………………….. Date: …………………………Introduction: This survey is meant to collect the socio-economic information around Lakes Bisina-Opeta and LakesMburo-Nakivali, purposely to acquire information necessary for guiding use and sustainable management <strong>of</strong> the wetlandsystem. The respondents have been randomly selected to ensure that the information selected is as representative aspossible.Village name: Does the villageboarder a wetland?Yes…..No……If not, what is thedistance from thenearest wetland ?1. 0-5 Km2. between5-103. 10>Parish Sub-county DistrictName <strong>of</strong> respondent Age <strong>of</strong> respondent (in years) Sex <strong>of</strong>respondent:1. Male2. FemalePosition <strong>of</strong>respondent inhousehold1. Head2. Wife/husband <strong>of</strong>head3. child4. OtherEducation level <strong>of</strong> respondent1. None2. Primary3. S1-S44. S5-S65. TertiaryNumber <strong>of</strong> household members in the householdWealth status <strong>of</strong> the household54A <strong>Socio</strong>-<strong>Economic</strong> <strong>Baseline</strong> <strong>Survey</strong> <strong>of</strong> <strong>Communities</strong>Adjacent to Lake Bisina/Opeta and Lake Mburo/Nakivali Wetland Systems
Summary <strong>of</strong> wealth status <strong>of</strong> the household1. Well-<strong>of</strong>f2. Moderatly well-<strong>of</strong>f3. Poor4. DestituteGeneral description <strong>of</strong> the homestead (type <strong>of</strong> houses, sanitationfacilities)1. Do all the school-age childrenattend school 1. Yes 2. No2. If they attend school, what type <strong>of</strong>school do they attend?1. Tertiary (university/College)2. Private secondary school3. Government-aided secondary4. Universal Primary school5. Private Primary school6. Other3. If they do not attend school, why?1. Cannot afford school fees and otherschool requirements2. Children do not want to go to school3. Lack <strong>of</strong> schools in the area4. Other (specify)……………4. What is the main source <strong>of</strong> foodfor the household?1. All food is produced on farm byhousehold2. Partly produced by household and partlybought3. All is bought1. Household members workfor all the food2. Receive handouts3. Other………………………5. Do you have enough foodthroughout the year?1. Yes2. No6. Does the family hire labour?1. Yes2. NoA <strong>Socio</strong>-<strong>Economic</strong> <strong>Baseline</strong> <strong>Survey</strong> <strong>of</strong> <strong>Communities</strong>Adjacent to Lake Bisina/Opeta and Lake Mburo/Nakivali Wetland Systems55
7. What kind <strong>of</strong> work do they do? 1. Agricultural labour2. Household work3. Construction4. Grazing <strong>of</strong> livestock5. Shop keeping6. Other (specify)………………9. 10. Do members <strong>of</strong> your familysell their labour for cash/ or food?1. Yes2. No10. What kind <strong>of</strong> work do you do?1. Agricultural labour2. Household work3. Construction4. Grazing <strong>of</strong> livestock5. Shop keeping6. Other(specify)……………….12. Does thefamily haveany means <strong>of</strong>transport?YesNo13. What means<strong>of</strong> transports?1. Motor vehicle2. Motor cycle3. Bicycle4. Canoe/boat5. Donkey6. Other(specify)15. Does thishousehold have:1. Radio2. Television3. Mobilephone15. Does this householdown any <strong>of</strong> the following:1. Land in acres2. Buildings for rent3. Agriculturalequipment (tractor/ osplough)8. How are they paid?1. Monthly wage2. Daily rate3. In kind4. Other (specify)11. How are you paid?1. Monthly wage2. Daily rate3. In kind4. Other (specify)4. Livestock (list and givenumbers)Cows……………………Goats……………………….Sheep…………………………..5. Other (specify)………………..56A <strong>Socio</strong>-<strong>Economic</strong> <strong>Baseline</strong> <strong>Survey</strong> <strong>of</strong> <strong>Communities</strong>Adjacent to Lake Bisina/Opeta and Lake Mburo/Nakivali Wetland Systems
POPULATION MOVEMENTS AND SETTLEMENTS16. How long has your householdsettled here?17. If settled in the last 15 years,where did you come from?1. years ago6. Within the same sub-county7. From neigbouring sub-county8. From another district9. Other (specify)18 Why did you choose to settlehere1. Availability <strong>of</strong> land for cultivation2. Availability <strong>of</strong> land for grazing3. Availability <strong>of</strong> water4. Good climate5. Availability <strong>of</strong> market for produce6. Availability <strong>of</strong> fish7. Availability <strong>of</strong> infrastructure(schools, health services etc)8. Displaced by conflicts9. Other (specify)……………………….COMMUNITY AND HOUSEHOLD SOCIO-ECONOMICS21. What are the main sources <strong>of</strong> incomefor this household? List them and rankRank according toimportance22. For the 3 ranked income sources, estimatethe average income per monthA <strong>Socio</strong>-<strong>Economic</strong> <strong>Baseline</strong> <strong>Survey</strong> <strong>of</strong> <strong>Communities</strong>Adjacent to Lake Bisina/Opeta and Lake Mburo/Nakivali Wetland Systems57
BENEFITS AND CHALLENGES OF BENEFIT UTILIZATION23.a) Do wetlands have any valuesbeneficial to the community?Yes ……… No…………………..24. What benefit does the communityderive from the wetlands? (list them) Rank them26. Does your household experienceany problem related to the existence <strong>of</strong>wetlands in this area?Yes……. No…….27. If yes, List them29. Which wetland-based enterprises are pr<strong>of</strong>itable in this area?28. Do you think your area should be maintained as a wetland?Give reasons1. Yes……. 2. No……..58A <strong>Socio</strong>-<strong>Economic</strong> <strong>Baseline</strong> <strong>Survey</strong> <strong>of</strong> <strong>Communities</strong>Adjacent to Lake Bisina/Opeta and Lake Mburo/Nakivali Wetland Systems
ACCESS, USE AND OWNERSHIP OF WETLANDS30. Do you own land in this area?1. Yes2. No31. Approximately how much land do you own? In acres…………..……………………………………………………………………acres32. How much is not wetland? In acres ……………….acres33. How much <strong>of</strong> it is wetland? In acres ……………….acres34. How did you acquire the land you own?1. Inherited2. Bought36. Which wetlandresource does thishousehold use?13. Water fordomestic use14. Water forirrigation15. Water forbrewingRank37. Who uses it?Men, women,both, youth-males,youth-girls38. In whatmonths isthe resourceused35. Under what land tenure do you ownthe land which is not under a wetland?1. Freehold2. Leasehold3. Customary4. Public land5. Mailo land6. Squatter3. Rented4. Squatter5. Other (specify)…………………………39. Is the usecommercial,subsistenceor both40. Wheredo yousell theproducts41. If commercial,How much moneydo you get permonth(approximately)A <strong>Socio</strong>-<strong>Economic</strong> <strong>Baseline</strong> <strong>Survey</strong> <strong>of</strong> <strong>Communities</strong>Adjacent to Lake Bisina/Opeta and Lake Mburo/Nakivali Wetland Systems59
16. Water forlivestock17. Land forcultivation18. Land/pasture for grazinglivestock19. Land forgrowing trees(woodlots)20. Fish farming21. Land forsettlement22. Buildingpoles23. Papyrus24. Hunting13. Crafts materials(specify)14. Grass (specifyuse)15. Fibre (specifyuse)16. Wild fruits17. Medicinalherbs18. Rattan cane60A <strong>Socio</strong>-<strong>Economic</strong> <strong>Baseline</strong> <strong>Survey</strong> <strong>of</strong> <strong>Communities</strong>Adjacent to Lake Bisina/Opeta and Lake Mburo/Nakivali Wetland Systems
19. Palm leaves(specify use)20. Bee keeping21. Fishing22. Culturalactivities (specify)23. Clay24. Sand25. FirewoodVALUES AND SUSTAINABLE UTILIZATION OF WETLANDS46. Are there any practices or usesin your area that may have negativeeffects on wetlands? (list them)1. Yes 2. NoRankthem47. What are the negativeeffects associatedwith these activities48. What is your communitydoing to minimize the negativeeffects1 12 23 34 45 56 6A <strong>Socio</strong>-<strong>Economic</strong> <strong>Baseline</strong> <strong>Survey</strong> <strong>of</strong> <strong>Communities</strong>Adjacent to Lake Bisina/Opeta and Lake Mburo/Nakivali Wetland Systems61
7 78 89 910 1049. If your household was asked to reduceactivities in wetlands, is there any alternative?(list them)50. What does yourhousehold require toengage in alternativeactivities (list them)51. What can your householddo to develop alternativeactivities?52. What can be done to ensure sustainableuse <strong>of</strong> wetlands? (list)53. Do you think peopleneed training to usewetlands?Yes…….. No…….54. Which people should betrained? (List) and on whatshould they be trained(Footnotes)1 Not every respondent was a household head. This is why the figure does not give a total <strong>of</strong> 32062A <strong>Socio</strong>-<strong>Economic</strong> <strong>Baseline</strong> <strong>Survey</strong> <strong>of</strong> <strong>Communities</strong>Adjacent to Lake Bisina/Opeta and Lake Mburo/Nakivali Wetland Systems
Notes:A <strong>Socio</strong>-<strong>Economic</strong> <strong>Baseline</strong> <strong>Survey</strong> <strong>of</strong> <strong>Communities</strong>Adjacent to Lake Bisina/Opeta and Lake Mburo/Nakivali Wetland Systems63
Notes:64A <strong>Socio</strong>-<strong>Economic</strong> <strong>Baseline</strong> <strong>Survey</strong> <strong>of</strong> <strong>Communities</strong>Adjacent to Lake Bisina/Opeta and Lake Mburo/Nakivali Wetland Systems
A <strong>Socio</strong>-<strong>Economic</strong> <strong>Baseline</strong> <strong>Survey</strong> <strong>of</strong> <strong>Communities</strong>Adjacent to Lake Bisina/Opeta and Lake Mburo/Nakivali Wetland Systems65
66A <strong>Socio</strong>-<strong>Economic</strong> <strong>Baseline</strong> <strong>Survey</strong> <strong>of</strong> <strong>Communities</strong>Adjacent to Lake Bisina/Opeta and Lake Mburo/Nakivali Wetland Systems