FISH YIELD OPTIMIZATION IN THIRUMOORTHY RESERVOIR,
FISH YIELD OPTIMIZATION IN THIRUMOORTHY RESERVOIR,
FISH YIELD OPTIMIZATION IN THIRUMOORTHY RESERVOIR,
- No tags were found...

You also want an ePaper? Increase the reach of your titles
YUMPU automatically turns print PDFs into web optimized ePapers that Google loves.
<strong>FISH</strong> <strong>YIELD</strong> <strong>OPTIMIZATION</strong> <strong>IN</strong><strong>THIRUMOORTHY</strong> <strong>RESERVOIR</strong>,TAMIL NADUCENTRAL <strong>IN</strong>LAND CAPTURE <strong>FISH</strong>ERIES RESEARCH <strong>IN</strong>STITUTE(Indian Council of Agricultural Research)BARRACKPORE743 101, WEST BENGAL
Fish Yield Optimization in Thirumoorthy Reservoir,Tamil NaduBull No. 95 February 2000Central Inland Capture Flsherier Research Institute(Indian ~ h c iof l Agricultural Research)Barrackpore-743 101 West Bengal
Fish Yield Optimization in Thirumoorthy Reservoir,Tamil Naduhl~rterrul confurned rn rhrs Bullerrn may nor he reproduced. rn anyform.n~rrh~rur the permrssron ofrhc puhluherComposed atAss~stnnccCover desrgnThe Project Mooltorlng &Documeotatlon SectlooCIFKL, BamckporeSefal~ B~swasP DasgupuPublished by : The Dlrcctor, ClFRl BmckporcPr~ntcd atToputs Pnvate Ltd.Bi2. Dr. B~rcsh Guha StreetCalcutta 100 017
ForewordThe Institute IS proud of the laudable results obtained by its Co~mbatoreResearch Centre. Tamil Nadu in achieving a mrdfish production of 193 kg ha ' yr 'from Aliyar reservoir. The investigations have established the great product~onpotentiality of such reservoirs, irrespective of their age. In order to confirm theviability of the techniques evolved, the Centre applied simtlar management practicesIn Th~rumoorthy reservoir located in the Westem Ghat region of Tamil NaduInterestingly, the high fish yield of 213.4 kg ha" yt' obtained from this smallreservoir has further affirmed the tremendous scope for enhancing the fish yieldseveral-fold from such reservoirs. I am confident that the findings presented in th~sbullet~n w~ll be highly useful for persons actively engaged in the development off~sher~es In such small reservoirs in the country.The ach~evement made IS the product of the excellent cooperation extended tothe Centre by the Department of Fisheries, Tamil Nadu and the Tamil NaduF~shenes Development Corporation Ltd. I place on record my sincere thanks to theauthorities of the Government of Tamil Nadu for providing faalities like the fish farm.the seed, feed and a vehicle. I thankfully acknowledge the Public WorksDepartment, Thirumoorthy Nagar. Tamil Nadu for providing the morphometric andmeteorolog~cal dataM. SinhaDlrector
tList of ParticipantsShrl C. Selvanj, Principal Sclentist 1.4.1992 - 22.1.18978 Project LeaderShrl V.K. Murugesan, St. Scientist 1.4.1992 - 31.3.1997Dr. V.K. Unnithan, Sr. Scientist 1.4.1992 - 28.4.199229.12.1992 - 5.3.1994Shrl S. Manoharan, Technical Assistant 4.6.1993 - 31.3.1997Shri C.K. Vava. Technical Assistant 7.9.1992 - 5.3.1994c. selvarajV.K. MurugesanS. ManoharanM. Karthlkeyan
2. Origin and salient hatuns of the nunok3. Ecology3.1 Meteorological conditions3.2 Water level, inflow and discharge3.3 Soil quality3.4 Water quality3.4.1 Physlcal queltties d wafer3.4.2 Chemicel quelHies d weter3.4.3 Diurnal variations h water qu&y3.5 Plankton3.5.1 Dm1 vadath h planhion3.6 Periphyton3.7 Macrobenthos3.8 Pnmary productivtty and fish production potenthl3.9 Fish fauna4. Fisheries developmmt4.1 Fishery management during 196667 to 1976-774.2 Fishery management during 1977-78 to lQ90-914F~sheriis research and management during 1991-QT4.3.1 Fish breeding and recmltment4.3.2 Fish seed rearing4.3.3 Fingerlings stocked during 1991 -92 to 1996-974.3.4 Assessment of growth of cuItiVsted caps throughmarlcing techniques4.3.4 1 T*4.3.4.2 Fln MmCWI Or fMn44.3.5 Food and feeding habits of commercially knportsnt Ilshec4.3.6 Sex ratio in commercielty important carps4.3.7 Length-wemt relationship of different speck4.3.8 Condrtion factor (Kn) of cultlveted carps
The recent estimation of FA0 has revealed that there are 19370 reservoirs inIndia, consisting of 19134 small reservoirs (I0- IOOO ha) with a total water area of1.49 million hectares (m. ha), 180 medium reservoirs (1000 - 5000 ha) with acombined area of 0.53 m.ha and 56 large reservoirs (> 5000 ha) with a total area oft.14 m.ha . Thus, small reservoirs account for 98.78% by number and 47.11% byarea. Among the Indian States, Tamil Nadu has vast reservoir resource (8906numbers including major irrigation tanks) with a total area of 0.36 m.ha. Of these.small reservoirs constitute 99.88% by number and 99.07% by area. Therefore, smallreservoirs can play a major role in increasing the inland fish production of countryas a whole and Tamil Nadu In particular, as they constitute a vast magnitude and arceasily manageiible. Fishery development can be taken up in such water bodies withION lnbestment as compared to medium and large reservoirs. However, a majority of'thcse productwe water bod~es remain underutilized or mismanaged due to lack ofunderstanding of the environmental cond~tions, the biotic communities, the biogenlcproduct~on potentiality, etc. As a result, these small reservoirs yield less than 50 kgfish per ha on an average.'The ~n\.cstigations carried out in Aliyar reservoir (646 ha), located at theWestern Ghat region of Tam11 Nadu, during ;985-91 resulted in an all-time recordfish product~on of 193.58 kg ha'. Further, the expenment helped to evolve ecologyhasedfisher~es management techniques for enhancement of fish production fromsuch small reservoirs. For testing the viability of the management techniques.another such small reservoir at Thirumoorthy was selected and ecology-basedfisheries management techni ues were applied during 1991-97. A high fishproduct~on of 213.4 kg ha9 was obtirined. confirming the viability of themanagement techniques. The techniques adopted in Thirumoorthy reservoir areprcscnted In thrs bulletin for highlighting the scope for enhancement of fishproduct~on from small reservoirs in the country through adoption of scient~ficnlanagement measures.2. Origin and salient features of the reservoirTh~tumoorthy reservoir was created by constructing an carthen dam of2627.99 m long during 1962-67 across Palar river and Nagappa Naicker Odai inBharathapurha basin just below the hills of Thirumoorthy In the Western Ghat region
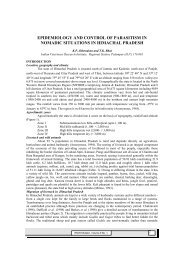
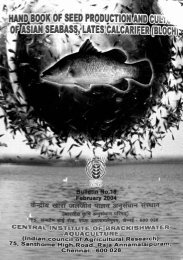
<strong>IN</strong>DIAN OCEAN<strong>RESERVOIR</strong> LOCATION MAP
of Tarnil Nadu. It is a tail-end nservoir under Parambikulam-Aliyar Project (PAP)with a water spread area of 388 ha at full reservoir level (F.R.L.) and 79.88 ha atdead storage level (D.S.L.). It is a small reservoir located at 10" 28' N and 77' 09' E,about 20 km south of Udumalpet town in Coimbatore District, Tamil Nadu. Apartfrom its own catchment area of 8029 ha the reservoir receives water supply fromThoonakadavu' reservoir which in turn receives water from Parambikularn andPeruvaripallam reservoirs. Water fmm Thoonakadavu is taken to Sarkarpathy powerhouse through a hone-shoe type turnel of 3850 m long. The tail race water from thepower house feeds the Sethumadai canal, the Aliyar feeder canal and the contourcanal. The contour canal (53.1 km long) empties its water into Thirumoorthyreservoir which has a gross capacity of 54.8 M. cu. m at FRL and effective netcapacity of 49.39 M.cu.m. The reservoir water is supplied through two canals forIrrlgatlng 80826.79 ha in Udumalpet and Palladarn taluks. The average water spreadarea of the reservoir is 234 ha. The ratio of catchment area to the reservoir areaworks out to 20.69. indicating a low allochthonous input.3. EcologyAs the productivity of the reservoir depends on the climate, the edaphic andthe rnorphometnc features, studies were made of the following aspects.3.1 Mefeorological conditionsThe atmospheric air temperature and the ramfall at Thirumoorthy dam during1992-90 were as given below:rYears Air Temperature PC) TzaT~ai~m11992-93 ' -Rnoge 1 Average1 - 790.3The average air temperature was moderate (24.6 to 31.4 "C) and favourablefor biological productivity. As the reservoir is located in the rain-shadow region ofthe Western Ghats, the rainfall at Thirumoonhy during 1992-96 was low to moderate(41 3.3 to 91 3.8 mm) compared to the national average of 1050.0 mm.
J.2 Water level, inflow and discharge'I'he fluctuat~on in the water level was maximum (14.71m) in 1992-93 andmrnlmulri (8.35 m) in 1995-96. However, the yearly avaage depth (10.12 to 12.98m) suggests that the reservoir belongs to medium depth category. While the annualinflow cxcecdcd the annual discharge during 1993-94 and 1995-96, the trend was~,~r.c,-i,c~r.\rr durlriu - 1W2-93 and 1994-95 (Table I). The wide fluctuation in the waterlcvcl ;IS well as thc lriflow and dlschargc indicates that the reservoir water is flushedout fruqucntly.3.3 Soil quality'i'hc bottom so11 from Thirumoorthy reservoir was slightly acidic (pH: 6.4 to8) \vtlh ;~ri .Ivcrage value of 6.5 during 1993-94. However. the soil quality~riipro\cd to ,~lLal~~~e sldr In thc subsequent years (Table 2) and was favourable forblolog~cal prod~~cl~on. The spec~fic conductance of the soil which was low (0. I0 tofl 31 ~~~rnhos cln ') during 1993-05, increased significantly (3.9 to 4.2 mmhos cm.')durlllg 100.5-07. The organlc carbon of the soil was high (1.56 to 4.10 %) during1003-05, ~ndlcatlng high productivity. However. the same parameter decreasedtiri~strcally (0 20 to 0.33 Oh) durlng 1995-97 probably because of higher rate ofdegradi~llorl duc to lowering of water level coupled with increased euphotic zone.I'llc hilhlll so11 conlained 30.9 to 54.0 mdlO0g of available nitrogen indicatingrncd~unl product~v~ty. Thc low available phosphorus content of the so11 (02 to 0 8rIlg 100 g ' I suggested poor product~v~ty3.4 Muter qualityThe temperature of water in the surface, middle and bottom layers rangedtioln 22 0 to 34.0 "C and the value decreased slightly with increase in depth. Theu.arcr tcnrpcrarurc showed direct relationship w~th air temperature. The mean watertemperature ranglng from 23.4 to 29.8 "C was favourable for the biologicalproducll\ ~ty. 'fhe reservoir water appeared turbid to fairly transparent with secchidisc lcadlng varying from 45 to 238 cm, altering the euphotic zone and thephotosynthct~c activity.
3.4.2 C'hrmrcul quulrties of waterThe chemical qualities of water which influence the biological productivityof the reservqir were as shown in Fig.1. The pH of surface water was higher than themiddle and bottom layers. The alkaline condition of watcr in all the layers favouredhlgher biological productivity. The dissolved oxy en content of water which is themost important vital parameter was above 5.7 mgl'k.In the thm layers and supportedthe b~otic community. While free carbon dioxide was recorded in certain months, itwas absent in other months. Higher values were recorded at deeper layers than thatof the surface. Presence of this gas facilitated better primary productivity. Thealkalitllty due to carbonates was negligible and it was mainly due to bicarbonates.The total alkal~n~~y was less. The total dissolved solids and specific conductivity ofwater were also less. A direct relationship among the total alkalinity, the totald~ssolved solids and specific conductivity was observed. Howevcr, the low valuesfor thcse parameters Indicate low biological productivity of the reservoir.Depth-wise die1 variations in the water qualities at different seasons during1993-95 are depicted in Fig.2. The water temperature was minimum at 0600 hrs andit raised w~th sun-rise and reached the maximum at 1200 hrs. The values declined at1800 hrs and 2400 hrs. The water temperature decreased with the increase in depthand it showed d~rect relationship with air temperature. The pH of watcr increascdat 1200 hrs. but declined at 1800 hrs and 2400 hrs. The pH in the lower strata wasgeneri~ll) lower than that of the surface layer. The dissolved oxygen increascd fromthe value at 0600 hrs to 1800 hrs up to 4 m depth due to photosynthetic activ~lies andthe values decreased gradually during night time due to respiratory act~vit~cs. Ameagre quantity of carbon diox~de was recorded at 0600 hrs in all the laycrs, hut thcgas decreased during day time upto 4 m depth due to utilization in the photosyntheticprocess. The value of free carbon dioxide increascd in all the layers during nighttimc due to respiratory activities of the biotic community. The total alkalinity wasmalnly due to bicarbonates and the values were low. The total dissolved solids andspcc~li conductiv~ty showed direct relationship.
YearPHE.C(mmho*)Avallabk N,(m011W)Avallabla P,O,(md1000)Organic urbon(%)1993-946 46.8(8 5)0.10-0.30(0 17)30.9-53.0(47.8)0.250.80(0.40)1 56-2 61(2.30)19B4.957.1-7.5(7 3)0.150.31(0 19)42.0-54.0(48.0)0.20-0.26(0 22)3.00-4 10(3 70)1995-9873-7.5(7.4)3.904.20(4.00)430-48.0(45 0)0.20-0.31(0.25)0.26-0.30(0.28)1996.977.940060.00.290.33(Averege m parenthesis)
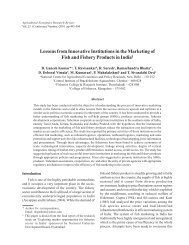
Analys~s of plankton samples collected from the surface and bottom layersrevealed the dom~nance of phytoplankton (Table 3). As depicted in Fig. 3. there wasa progresslLc Increase in tlte phytoplankton population from 1993-94 to 1995-96..Among the phjtoplankton. Racillariophyceae uas the dominant group during 1093-04 followed by Chlorophyceac and Myxophyceae. During 1994-95. Chlomphyceclewas the donl~nant group, followed by Bacillanophyceae and Myxophyceae. Again.Chlorophyceae dominated the phytoplankton during 1995-96 followed byRacillariophyccac and Myxophyceae. The 7ooplankton contribution ranged from 2.2to 7.0 ",. The /ooplanktoil population also showed an increase from 1993-94 to5 - 0 The /ooplankton was more at the hotto111 than at the surfiicc dur~ng 1094-O(r 41nong ~hc ~ooplankton, generally Cladoccrans were more. followed bycopepods and rot~krs. The total planktcrs rangcd from ll(184 to 20140 nos. I" inrhc surfacc and from 4077 to 15701 nos. I" in the bottom. 'l'hc volumc of planktonllucludted from 2.0 to 0.0 ml'ni'Qualitati\e analys~s revealed that Chlorophyceac consisted o/ /lormidrum..\~,lt.tri~.\r~.rtm and S~c~trctlc:~ntrrs. .Yrrzsrhrcl. h~clo.srrtr. Nu\~rr~t/r, S~.trcvlrtr andib~t~c~ll~t~-rtr were cncounlcrcd under Bac~llarlophyceae. Mvxophyccac wasLonsr~t~~tcJ b\ .\lrc,roc,\.~rr.~. ,Vo.:cls~oc and :lrrlrhlrc~rrt~. Anlong the rooplanktcrs./Jrrrc litot~rr.\, Kt~rtr/t*llri. (',c~lol>~, l)ruptot~r~o and /)uplrtrru were the gcncra frcqucntlyrccordcd.I)iunidl s~udlcs sho~ed thdl tlic phytopldnLton wds nlorc In thc surfd~c ldycr'11 l2(l(i hrs ior photosynthetrc JCII\IIICS rind thc~r nirnihcr rcducetl due to tl~e~rd~i\ii\\ ~rd mlgrdtlon at I ROO hrs and 2400 hrs ( I 4) The rooplankton population\\,I\ Illore 111 [he surlace at 0000 hrs and 2400 hrs, but nligrdtcd downwards at 1200Ilr\ 'i11(1 1 h00 hrs due to the~r scnsltl\ity to sunl~ght
PlanktonSurtaco1993-94BottomSutfaaIBOCOSBottomSutfaalaM-96BottomPhytoplanktonChlarophyaaeBadllsnophycaaeMyxophycaee4307 15226300 1884624 4988652 84582744 23291175 70111707 78956153 54551573 1158TotalComposition (K)11431 380497.8 95.912571 1148896.3 93.819433 1450896.4 92.4ZooplanktonRottfetaCllrdocereCopepod864 3592 8697 47156 236178 235143 284251 368224 432241 393TotalComporltlon (X)253 1682.2 4.1477 7553.7 6.2716 11933.6 7.6Total Plankton~olume (ml/m3)11684 40724 213046 122435 520149 157015 6Table 3. Plankton distribution (nos.4) in the surface and bottom layers during 1993-96
-25QDamQl1-laxasoa,0-SQ)Ua4:zmim0PDOOTotal planktonIlsoa,lam9uX)---------06 ks 12- I8 Wt 24 WEL
Among the biotic communities, periphyton plays an important role as foodfor certain fish fauna. The periphyton pulation was maximum (I0101 nos./cm2)at 4 m depth. followed by 9878 nos./cm at 2 m depth, 9009 nos./cm2 at 6 m depthand 8801 nosicm2 at 8 m depth. The organisms were least (6668 nos/cm2) at 10 mdepth. The data on the average periphyton recorded at different depths and theirpercentage contribution at Thirumoorthy reservoir is presented in Table 4.Qualitative analysis of periphyton population revealed 16 genera of diatoms. 9genera of green algae and 2 genera each of desmids, blue greens, rotifers andproto7oans. Diatoms dominated in the periphyton population beyond 2 m and itincreased with increase in depth. Next to diatoms. protozoans formed the dominantform upto 8 m depth and at 10 m depth, green algae took sccond position.Protozoans reduced in population size with increase in depth. Grccn algae with14.43 to 24.38 % upto 8 m occupied third position. Blue green algae formed ameagre quantity contributing 0.57 to 2. l l %.The bottom macrofauna was maximum (1562 nos /m2) dunng 1994-95 andm~nin~urn (1175 nos im2) dunng 1995-96 (Table 5) The benthos wcrc nlainlyconstitutcd by Chlronomus sp . Chuoborus sp and Oligwhaetcs A few molluscanforms \+ere also recorded durtng 1994-95 Whllc Ollgochaetes were sl~ghtly more(37 5 "0) thdn C'lrrronomus (36 1 %) and C'huohorus sp (264%) durlng 1993-04.C huolwrus sp *as the donllnant form (384 %), followed by Ch/n~nomrr.r sp (30 5'0) and Ol~gochaetes dunng 1994-95 Almost equal quantity of Ol~gochdctcs (34 4"0) and Chlronomus sp (34 2 Oh) wcrc recorded dunng 1995-96 Thc corltr~butlonby (%oohortu sp dur~ng the year was 31 3 %3.8 Primary productivity andfish production potentialThe grimary production was cstimatcd using " Llght and Dark bottle"technique upto 4 m depth, as the compensation depth was wlthin this level. Thc grossand net primary production and the percentage of energy fixation by primaryproducers during 1993-96 are furnished in Table 6. The productivity graduallyincreased in the later years coinciding with increase in phytoplankton. The averagefish production potential at 0.5 % of energy conversion works out to 268.1kghaiycar.
P8rtkuhcrt9m-U19Q19519954(1Gross-production(mcl ~m'lhr)w---( m a wwa -'w(m0Chn'~d.l)31 925 45.58619040529512 69150041 729813.99029--Amq-.or-(--wb71661x10'Om21275x10'0 397l(66rfd0 702Clct
3.9 Fish faunaThe fishes encountered in the reservoir an listed according to theirtaxonomy:Family: CyprinidaeSub-family : CyprininaeCarlu curla (Hamilton - Buchanan)Laheo rohira (Hamilton -- Buchanan)Crrrhinus mrigala (Hamilton - Buchanan)Clprrnus carpio var. communis (Linnaeus)C:vprinus carpio var. speculuris Lac&pkdeC:yprinus curpio var. nudus BlochLuheo calhusu (Hamilton -- Buchanan)Luhtofimhriurus (Bloch)Punrrus carnaticus (Jerdon)Punrrus/ilamenfosur (Valenciennes)Puntrus mahecolu (Valenciennes)Puntrus sarana (Hamilton)Tor (khudree) mulubaricus (Jerdon)Sub-family ' : 1,cuciscinaeIfypophthalmichth~a molirrix (Valenciennes)Sub-familySub- family:RasborinaeLlanro uequrptnnarus (McClelland)Amhl.vpharyngodon mola (Hamilton - Buchanan)Amblypharyngodon melettinus (Valenciennes): CarrinaeGarra mecclellandi (Jerdon)Family: CicblidacOreochmmis mossambicus (Peters)Etroplus maadatus (Bloch)
FamilyFamilyFamilyFamilyFamilyFamilyFamilyFamily: AagullheAnguilla bcngalensis (Gray): BagridaeMysru virarus (Bloch)M.vsrrrr maluhrrcu (Jerdon): MugilidaeRhinomugil corsula (Hamilton-Buchanan): SiluridaeOmpok himuculnrus (Bloch)Onlpok muluharicus (Valenciennes): ClaridaeClarias hatrachus (Linnaeus): GobiidaeGlossogohius giuris (Hamilton Buchanan): ChannidaeChannu striuncs (Bloch)MastacembelidacMusracemhelus armatus (Laccpede)The fish fauna studies revealed por species diversity. The intensive stockingof fast growing herbivorous carps during 1992-97 for enhancement of fishproduction per unit area discouraged the very existence of some of the indigenousfishes. resulting in disappearance of these fishes in the latcr period.4. Fisheries Dcvelopmcnt4. 1 Fishery manage~enr during 1966-6 7 to I9 76- 77The Depanment of fisheries in Tamil Nadu was canying out the fisheriesdevelopmen! in Th~rumwrthy reservoir during 1966- 1977. Fish seed belonging toC. mrrgulu. /-. reha. L. fimhriarus. P carnaricw, F! saruno. I! duhius. 0.mossamhieus and C. carpio was stocked during 1966-69. A small consignment of
145 sced of C ruflu. 1 175 of L. rohifa and 10640 L. calbaru was also included inthe stocking material during 1%9-70. Stocking of major carp seed wasprogressively increased. The stocking rate and species combination depended moreon the availability of fish Baed ratha than any rationale. The -1nual stocking rateranged from 323 to 2366 seedha with an average of 1009 nos.Ftshing commenced in 1968-69 through the departmental fishermen usingcdracles, gill-nets of different mesh size and cast nets. Later, private professionalfishermen were also engaged for fishing in the reservoir on crop-sharing basis.F~shes of all size groups were captured indiscriminately. A total of 2697 kg to255 11.25 kg of fish was harvested annually from the reservoir. The yield per haranged from 11.5 to 109.0 kg, with an average production of 64.7 kgha. The yieldwas dominated by miscellaneous fishes (83.9 %). Major carps formed a minorfishery (16.1 %). Heavily stocked fishes like C. mrigdlu, C rebir. Punr~us sp..l,./inthrruru.s, etc, d~d not establish in the reservoir. The minor constituent like 0.mos.sirnihictrs in the fish seed released in the reservoir formed a major fishery. TheIlighrst productlun (109 kg/ha) was obtained during the fiflh year (1970-71) of~nipoundment probably due to in~tial fertility of the reservoir and trophic burst.Itowever, the fertility did not sustain and the productivity declined in the subsequentyearsI'amil Nadu Fisheries Development Co~oration Limited (TNFDC), a quasiC~ovcmriietit organization, took over Thirumoorthy reservoir and the fish farmlocatcd In the vicinity of the reservoir from the Department of Fisheries on a longtcnnlcasc to develop its fishery on commercial lines since 1977-78. The TNFDCra~sed fry and carly fingerlings of Gangetic carps (C', curlu. L. rohrru and C. mrrgalu)and the common carp. ('. ctrrpio in the fish farm. Besides, the Corporation purchasedthc seed from the Departments of Fisheries in Tamil Nadu. Kerala, Andhra Pradeshand West Hengal and also from the private fish farms. The fish seed consisting of Cc~irrlir, (' ntrr~~lti. ('. ccrrpro. Llfimhriurus. L mhrru and N. molirrir were stocked In(he reservoir (ti 850 to 2382 nos./ha/year with an average of 151 5 nos./ha during thecntlre period (1977-91). Among the different species rcleased in the reservoir. I..tuhrrir was the dominant species (29.1 to 61.8 %). followed by Cmrrgulu (10.1 to38.40 9'0). C. curpio (9.98 to 26.1 %) and C. curlu (4.2 to 31.63 %).
Tamil Nadu Fisheries Development Corporation Ltd. followed almost thesame method of exploitation, as done by the Department of Fisheries by engaging 10to 15 share fishermen for exploitation of fishery wealth. There was a widefluctuation in the fish yield of different years and there was no relationship betweenthe stocking and the recovery. The annual average fish yield declined to 14.6 t (62.4kgha) during 1977-91, but the contribution by major carps showed an improvement(57.246).4.3 Fisheries research and management during 1991-97Co~mbatore Research Centre of Central Inland Capture F~sher~es Researchlnst~tute (CICFRI) took up fishenes research and management of Th~runioorthyreservoir since September 1991. All the aspects of fisheries werc investigateddunng 1992-97.4 3 I Frsh hrc~edrng and recrurrmenrSexual matunty of cult~vdted carps captured from Th~n~moorthy reseno~ruas exanl~ned In the fish ssembly centre The study revealed that thc gonads inmajor carps (C curlo L roh~ru C mrrgulu and H n~olrrrrr ) devclop upto IV stageof mdtunty and the11 resorb The npe or oozlng specimens were rare lndlcdtlng thatthcse carps do not attaln full sexual rnatunty In th~s rescrvolr probably due to lack ofcertdln cssenl~al nutrients In the water as observed In Al~yareservolrOperation of shore-se~ne nets and g~ll-nets w~th smaller niesh s~ze In themarginal area of the reservoir to capture weed fishes brought young ones of 0t~or\unrhrtus. P filurnenro~us. P n~uhecola and other trash fishes Not a s~ngle~ouny-one of cultnated carps of less than 60 mni length was captured III thcse netsJur111g thc entlre per~od ~nd~cat~ng that there IS no recnlltment of these fishes.Harranllng regular stock~ng of fast growlng compat~ble specles at optlmum dens~tyand cornb~nalion.Early fr) of (' ccrllir L rohrrrr (' rnrrgulu and C' curpro ahta~ncd from theIdni~l Yudu f-~shcr~es De\clopment Corporat~on Ltd were reared In the nursery andrearlng ponds of the Go\.ernmcn~ F~sh Farm (2 0 ha) located adjacent to the reservolrThe adtanced fingerlings (abobe 100 mrn long) were segregated uslng su~table netsof appropr~ate mesh s~ze (32 rnm nets for C curb and C' curpro and 25 mm nets for
L. mhrta and C. mrrgula) and stockcd in the reservoir in small instalments attntervals of 7 to 10 days. Thus, advanced fingerlings were stocked in the reservoirthroughout the year so that the population level of cultivated carps was maintainedby compensating the reduction due to exploitation, escapement and natural mortality.4 3.3 F~ngerlrng~ stocked durrng 1991-92 lo 1996-97The stock~ng rate was reduced drastically to 215 fingerlings per ha during1991-92. It was gradually increased in the subsequent years (Table 7). Among thespecies stocked. I-. rohita was the dominant species in the first year (1991-92).followed by C. calla (34.4 %) and C, carpio (22.2 %). For want of adequate seed ofC', cuilu during 1992-93. the rate of stocking in the species has gone down to 19.6 %.Since h~ghcr growth rate of the species was assessed through marking techniques,attcmpls wcre made to increase the rate of stocking from 1 !A6 % in 1992-93 to 39.0Oh In 1096.97. The rate of stocking in L. mhita was gradually reduced fiom 43.3 %in 1991 -92 to 14.3 O/O in 1995-96, as the growth rate of the species was poor. Sincer. nrrr~ulu seed was not available for stocking in 1991-92, the rate of stocking of thespecies was only 0.1 %. To compensate this, C. mrigola formed the dominantspecies (31.3 % ) during 1992-93. However, the growth rate of the species was notsatisfactory. Hence. the rate of stocking of this species was reduced in thesubsequcnt years. The rate of stocking of C. carpio was 22.2 % in 1991-92 and 16.2O/O in 1092-93. Since the growth performance of C. curpio was next only to C catla,elforts were made to increase the species combination (32.0 to 48.2 %) in thesubsequent thrce years. Seed of silver carp, H, molitrlx was available only in 1992-93 and 1993-94 and th~species was stocked.@ 4.3 % and 4.0 % respectively. Thestocking rate was ranging from 215 to 606 fingerlingsha, with an average of 387nos./ha during 1991 -97 . The average stocking rate was maximum in C catlu (29.5Y;,), followed by C carpro (28.2 %), L. rvhita (24.1 %). C. mrigulu (16.9%) and H.mo1rtrf.r (I.2 Oh).4 3.4 .4sscssnrent of gmrrmth of cultivated corps through marking techniquesSince fish production in the reservoir depends much on the growth rate offish and population density, assessment of growth rate of difference spccies is a preprquisite for fishery devclopmcnt. For monitoring the growth rate of fish. taggingwd fin removal were tried at Thinrmaorthy reservoir.
4.3.4.1 Tagging : Imported T-bar floy anchor tags wnc used for taggingadvanced fingerlings of cultivated carps. One lagged catla was recovered after a freellfeperiod of one year and nine months. The fish had attaineda length of 692 rnmand weight of 6000 g as against Ule initial size of 204 mmll05 g, resulting in anIncrement of 48a mm/5895 g. The T-bar floy anchor tag had a mono-filament of 15mm long, whrch was inadquate to accommodate the increment of body growth ofmarked fish. In the fish recovered, the T-bar floy anchor tag has gone inside thebody ofthe fish leaving a portion of the tubular structure visible outside. To tide over~h~s problem, Indigenous tags (35 to 65 mm long) were procured from Tlrupur, TamilNadu. 5;rially numbered labels prepared out of letro-embossing machine and tapewere attached along with indigenous tags. A few lots of fingerlings of C. curla. L.mhrru. C mrigalu and C'. curpio were tagged with 65 mm long tags and released inthe reservoir for further observation. The tags were getting entangled to the gill-netsoperated in the reservoir and the fingerlings used to escape leaving behlnd the tagswithin a few days of their release in the reservoir. Hence, in the subsequentexperlments, 35 mm long tags were used instead of 65 mm. In these experiments,the chances of entanglement came down drastically. However, the recovery oftagged fish from the reservoir was poor leading to discontinuat~on of tagging trialssubsequently.4 3 4 2 Fm remor,ul as marking Flngcrl~ngs of C curlu L rohrro. C'mrrgcrlu, and I' rtrrpio wcre subjected to remobal of nght pelv~c fin The woundedarea of marked fish was ~mmedlately cleansed wlth hydrogen perox~de and drysurglcal cotton In order to remove the blood staln, body sllme and molsture contentA little quantlty of Furacln cream was applled on the Injury and the marked fish wascarefully released Into the reservoir. The date-w~se stocking of marked fish and thelrmean sue are given below. .-- - --ate of release T Spies 7-AV. total length 1 Av. ~otriwcighl-liiyk
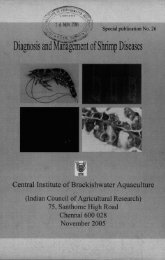
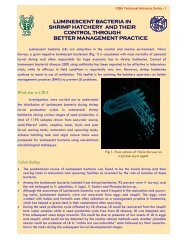
A view of the Government fish FarmCUT seed netted out fiom the pond
Frame with suiloble net for segregating finRerhgsSegregated fingerlings for reservoir stocking
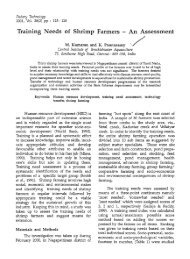
Feeder canals from the reservoir for irrigation
Tagging offingerIings with T-bar floy anchor tagsCommon carp fingerlings with indigenous tags
Corkr with pelvic fin removedICommon carp with pelvic fin removed
C. carpio : The first specimen was captured during fourth month of its fm-life span.A total of 76 specimens were recovered during the month and they had attained anaverage size of 325.5 mml664.4 g, with a mean increment of 240.4 mmj655.6 g.This species registered an average growth of 320.0 md12 13.0 g during 7th month oftheir free-life period. The fish attained a mean size of 436.9 md1538.0 g. 498.2mm!2512.0 g and 590.0 md3500.0 g with an average growth increment of 351.7md1529.4 g, 413.0 md2503.7 g and 504.8 md3491.1 g in the first, second andthird year respectively. The number of marked fish recovered per month in thespecies was maximum (134 - 214) between 5th and 9th months, but declined in thesubsequent months. Altogether, 1128 specimens (26.9 %) were recovered from thereservoir dunng a period of 42 months. Of these, 932 specimens (83 %) did nothave regeneration of the right pelvic fin. Though deformed fins were noticed in therest of the specimens (17 9'0). the marked fish could be easily identified from thevariat~on in the length, breadth and number of rays compared to the normal fin in thesame specimen.C. carla : Fifleen specimens were harvested during 5th month of their free-life span.The niean length and weight of these specimens were 381.2 mml800.0 g, w~th anaveragc Increment of 286.7 md788.0 g. This species attained an ideal marketablesrze of more than 1 kg in weight only during 6th month when 39 specimens with anaverage size of 419.3 md1166.6 g and an average increment of 324.8 mml1154.6 g\sere harvested from the reservoir. This species attained an average size of 528.4rnm 2245.0 and 694.1 mm!5807.1 gin the first md second year respectively. A totalof 1370 fish (43.2 %) was recaptured duringa period of 34 months. Thc recovery ofmarked fish was well distributed almost in all the months up to 3 1 months, but thenumbcr declined in the subsequent months. Majority (99.5 %) of the marked fish inth~species landed without regeneration of right pelvic fin. However, a few (0.5%)had smaller fins having 1 to 6 rays.C. mrigala : The first marked specimen of C. mrigolu which appeared in the fishland~ngs dur~ng 13th month of its free-life period had a total length of 425.0 mm anda total weight of 700 g, recording a growth of 317.2 md690.0 g. During 14thmonth, I I specimens were harvested with an average size of 436.5 mmi1036.3 g. Atthe end of the 2nd year, the species attained a total length of 532.7 mm and weight of1555.(! g, w~th an average increment of 424.9 mm/1545.0 g. The species reached asrre of 596.0 nimi2112.6 g with a mean growth of 488.2 mm/2102.6 g at the end of
3rd ycar. Altogether. 1365 marked fish (29.3 %) were recovered in the speciesduring the penod of 43 months. Of these recoveries, 92.1 % did not haveregencratron of right pelvic fin. While single deformed ray was encountered in 58specimens (4.6 %), 2, 3 and 4 rays wcre recorded in 26 (2.1 %), 9 (0.7 %) and 6 (0.5%) specimens respectively.L. rohlrcr : The first marked specimen of the species was captured during 14th monthof its release in the reservoir. The fish had attained a total length of 382.0 mm and atotal weight of 550.0 g, registering a growth of 274.6 mm1535.9 g. The recovery ofmarked fish was a rare occurrence upto 30th month. However, regular landings in[his species wcre encountered from 31st month onwards. Specimens weighing morethan I kg were recorded only after 33 months of free-life span. The growthincrcnicnt of this species was c500 g in the first year, 650 g in the 2nd year and1000 g in the 3rd year. A total of 133 marked fish (5.8 %) was captured during aperiod of 42 months. While the right pelvic fin was totally absent in 130 specimens(7.7 %,), defomled fins with a fcw incomplete rays were observed in the rest.'The growth rate was the highest in C.cotlu, followed by C. curpro. C mrigaluand L. mhrra (Fig. Sa). The growth rate of marked fish was identical with that of thenormal (unmarked) fish (Fig. 5b) indicating that the removal of the pelvic fin incarps has not affected the growth rate of fish. Similarly. the high recovery of markedfish suggests that it ha.. not hampered the surv~val also. The study confirms that thererno~al of pelvic fin as a mark~ng technrque is a suitable method for assessing thegrowth of fish in the open waters.4.3.5 Foc~il utrJ fecdrng hrrhrrs o/commercrollv rmporlunrjishesThe food and feeding In four commercially important fishes. viz.. C'. curlo. If.molr~rr.r. L. rulriru and 0. mossumhrcus from the reservoir were studied by analysisof gut contents. The study revealed that all these four species were predominantlyphytophagous in nnture. Grecn algae dominated the food items in all the species,w~th maximum percentage in 0. mossamhicut (55 %), followed by H.molirrix (45YO), L. mhrru (36 %) and C. curla (34 %). Blue-green algae occupied the secondposition among the food itenis in three species other than C. curlr~ in which theco~itribution by crustaceans was substantial (28 %), followed by blue-green algae (I896). With 32 % crustaceans and rotifers, C. catla revealed its preference forzooplunkton. tiowever. in phytoplankton dominated reservoir like Thirumoorthy, thefish IS forced to consume a substantial quantity of phytoplankton (55 %). Thephytophagous fish, H. molirrix had consumed algae and diatoms to an extent of
Fig. Sa. Growth of marked catla, rohu, mrigala and common carp
Marked catla recovered from the resenfoir--... .Marked specimens recovered in a day
Marked meal recovered from the reservoir
Stocked species forming the majorfishery
- Rohu :Male : log W = -4. I98368 + 3.026427 log L (n=260,14.94)(0.0706)Female: log W = -4.875806 + 3.193736 log L (n=774, ~0.97)(0.0274)Pooled : log W = -5.111697 + 3.242872 log L (n=329, r=0.96)(0.0160)Regression lines of males and females are significantly different at 5%.As the regression lines of male and female were not significantly different(5%), a combined length-weight relationship was estimated as follows:Males + Females : log W = -2.716250 + 2,562379 log L (n=532, ~0.88)( 0.05YI)Mrieal :Pooled : log W = -3.1993 15 + 2.674011 log L (n=2183, ~4.88)(0 03 12)Male . log W = -2.978466 + 2.613155 log L (11-473, ~0.88)(0.0664)Female :log W = -3.682319 + 2.790151 log L (n=1536, r=O.Yl)(0 0335)Pooled : log W = -3.555862 + 2.752883 log L (n=3461, ~ 0.90)I0 0233)Regression lines of males and females are significantly different a1 5%.
Common cam :Male : log W = -2.417219 + 2.560358 log L (11487, F0.85)(0.0598)Fmalc: log W = -2.754938 + 2.659322 log L (n=18&, F0.91)(0 0287)Poolcd : log W = -2.746206 + 2.650619 log L (n=3275, r=0.89)(0 023 1)Regression lines of males and females are significantly different at 5%.Silver cara :As the rcgrcssion lines of male and female were not significantly different(St%), a comhlned length-wclght relationship was estimated as follows:Malcs + Fenlales log W = -4 707737 + 3.068857 log L (11-245, r=O 95)10 06221Poolcd log W = -5 381747 + 3 220536 log L (n- 3 10. r--0 97)(0 0441)The Icngth-weight relationship of cultivated carps in Thirumoorthy reservoirIS dcpicted in Figs. 6 & 7.The condition factor which reveals the well-being of the fishes was calculatedfor cultivated carps captured from the reservoir through months. While thecondition factor was calculated separately for males and females in catla. mrigal andcomnlorl carp. it was calculated for males and females together in case of rohu andsilver carp. The relative condition factor during different months was varying from0.984 (August) to 1.109 (November) in catla males and from 1.057 (June) to 1.1.95(Febnrary) in females. Similarly, the value ranged from 0.91 (February) to 1.104(July) in mrigal males and from 0.985 (December) to 1 .I 187 (June) in females. Therelative condition factor of catla and mrigal are depicted separately for males and
86%. with meagre quantity of crustaceans (8%) and rotifns (2%), indicating thatsilver carp is not competing with catla to the extent as usually feared by fisherymanagers.4.3.6 Sex ratio in commercially importanl carpsA total of 1092 catla, 604 rohu, 987 mrigal, 1638 common carp and 79 silvercarp were exanlined for estimating the sex ratio. The ratio between the male and thefemale in these species was as given below:S~eciesC. carlaL, rohiroC. mrigalaC. carpioH. rnolitrixMale : Female1 : 1.571 : 1.851 : 1.871 : 1.701 : 1.30The study revealed that the females are preponderant in the population.The length-weight data of different species, collected during 1993-95 wereanalysed. The length-weight relationships of C carlu, L. rohira. C'. mrrgul(~, C.rarpio and H. ~nolirrix were estimated for both male and female separately as well asfor pooled data of males, females and indeterminates. Comparison of fittedregression lines wcre made using Analysis of Covariance (ANCOVA) for each ofabove mentioned species and it was observed that the regressions of males andfcmalcs were found to differ significantly in case of catla, mrigal and common carp.However. the regressions in respect of rohu and silver carp were not significantlydiffercnt and hence, the length-weight data on males and females for both thesespecies were combined and then the length-weight relationships were estimated. Theresults have been summarised below. The figures within brackets indicate thestandard error of respective regression coefiicients.
females through months (Fig.8). The K. value for common carp was greater than 1in all the months indicating that the fish was existing in a vcry healthy condition.The h~ghest value of K, for males and females coincided during February. While theleast value in males was recorded during September, the minimum value in femaleswas encountered In August. The maximum K, value for rohu was recorded inAugust and the minimum value was encountered in November. The highest K,, valuefor silver carp was noted in January and least value was recorded in July. Therelative condition factor of common carp, rohu and silver carp for different months isgiven in Fig.9.4 j Y Fish vreld dunng 1991-97The fish yield increased steadily right from the first year (1991-92) onwardsand reached an all-time record of 49.9 t (213.4 kgha) in 1996-97 (Table 8). Thestockcd species formed the major fishery (88.5 to 96.4 %) of the reservoir. Higherstocking rate followed in C catla (29.5%) and C carpio (28.2%) taking clue fromhigher growth rate of these species through recapture of marked fish resulted inhigher contributlo~i by these two species in the total fish landings. The stocking hadd~rect impact on the ylcld (Tablc 9). The catch per unit of effort (CPUE) which waslow (5.65 kg) in I991 -92 increased to the maximum of 12.5 kg in 1994-95 (Fig. lo),~mproving the earnings and standard of living of the poor fishermen community.Though the ecological investigations indicated low to medlum productionpotentiality of the reservoir, the fish yield could be substantially increased throughbetter fishery management.The cornparison of the fish secd stocking and the total fish catch duringdin'ercnt years (Fig. 11 ) clearly revealed that the high rate of stocking practiced bythe I)epanrnc~it of fisheries ln Tamil Nadu has not improved the fishery and that[liere was a niismanagement. Similarly, in spite of heavy stocking of major carp seedduring 1978-01 hy the Tamil Nadu Fisheries Development Corporation Ltd., the fishyold was low and fluctuated a lot. indicating poor management. However. undersciet~t~fic management of CIFRl , the fish yield increased substantially year afteryear. In spite of drastic reduction in the stocking rate, indicating efficientmanagement during the period (Fig.12). The contribut~on by stocked varictlcsIncreased considerably (Fig.l3), leading to higher revenue to the fishenescorporation and higher earning to the poor fishermen. The constraints like~nndccluatc rearing space. lack of seed of desired species and lack of efficient gearsand crafts hampered stocking and exploitation strategies. Better management
Fig. 10 : Catch pef unk .trort (CPUE) In dlfforont years
-5 ,ca -.Y150 -.YieldmcFig. 12 : Impact of stocking on the yield befora and after CIFRI's management
techniques in tlrese aspects would enhance the fish yield further towards the assessedpotentiality of 268.1 kghalyear.Based on the investigations carried out at Thirumoorthy reservoir and theresu!ts obtained, the following recommendations are made for future follow upaction.I. Recruitment studies revealed that the fast growing carps which were releasedinto the reservoir for propagation do not attain sexual maturity and breed inthe lesen80ir. In the absence of natural recruitment of cultivable carps, itbecomes essential to stock the reservoir with quality fish seed fromextraneous source so that the fish food organisms will be utilized by thesefishes and form a fishery of our choice. Failure to do so will encourage weedfish and other minor carps to utilize the rich food resources and multiply theirprogeny. To avoid economical loss, it is essential to stock the reservoir withseed of fast growing herbivorous fishes.2 Mrhlle stocking, care must be taken to release healthy fingerlings of morethan 100 mm in length to avoid attack by predatory fishes and also by weedfishes.3. The following species-mix is suggested for'Thirumoorthy reservoir based onthe rate of growth and food availability for achieving optimum fishproduction.4. As stocking of advanced fingerlings in healthy condition resulted in highersurvival and recovery of grown-up fish for marketing, the stocking densitycould be reduced to around 380 n0s.h. As such, a total of 90000 advancedfingerlings appeared to be sufficient for Thirumoorthy reservoir.
5. The entire quantity of s d proposed to be stocked may be split into smallquantities and released into the resnvoir periodically, covering all the monthsof the year. This helps to avoid unhealthy competition among the tishes ofthe same age and size groups and to maintain a population size compensatingthq reduction due to fishing efforts.6. Harvesting of fishes of more than 1 kg weight from the reservoir isadvantageous in certain aspects. The fish gets adequate period for its growth.A fish of more than 1 kg fetch higher price in the market. It is alsoconsidered to be ideal size for marketing. Hence, suitable fishing gearsshould be operated to capture the stocked varieties. However. weed fishes.minor carps, predatory fishes and tilapia which compete with cult~vatedcarps for food and space should be exploited to reduce thew populat~on byoperatit~g small mesh gill-nets and other suitable gears.7. As effective exploitation of grown up fishes from the reservoir is an integralpart of the management techniques for enhancing fish yield, new gears andtcchniques must be introduced. Assistance could be sought from the Centrallnstitutc of Fisheries Technology (CIFT), ICAR. Cochin in this respect.8. F~shing In the irrigation canals when water discharge is reduced or completelystopped revealed that a lot of grown up fishes escape from the reservoiralong with discharge of water through the canal net work. To prevent theloss of grown up fishes through downward migration along with thedischarge of water. suitable wire mesh structures should be erected in theoutlet canals.