An Improved VLSI Test Economics Analysis System - Laboratory for ...
An Improved VLSI Test Economics Analysis System - Laboratory for ...
An Improved VLSI Test Economics Analysis System - Laboratory for ...

Create successful ePaper yourself
Turn your PDF publications into a flip-book with our unique Google optimized e-Paper software.
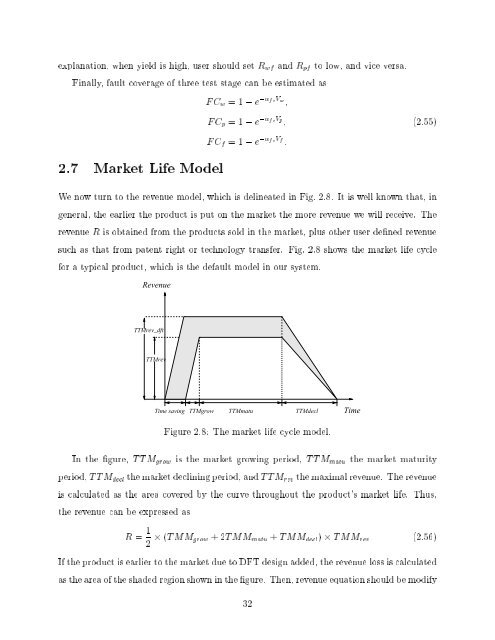
explanation, when yield is high, user should set R wf and R pf to low, and vice versa.Finally, fault coverage of three test stage can be estimated asFC w =1, e , fcV w;FC p =1, e , fcV p;(2.55)2.7 Market Life ModelFC f =1, e , fcV f:We now turn to the revenue model, which is delineated in Fig. 2.8. It is well known that, ingeneral, the earlier the product is put on the market the more revenue we will receive. Therevenue R is obtained from the products sold in the market, plus other user dened revenuesuch as that from patent right or technology transfer. Fig. 2.8 shows the market life cycle<strong>for</strong>atypical product, which is the default model in our system.RevenueTTMrev_dftTTMrevTime savingTTMgrow TTMmatu TTMdeclTimeFigure 2.8: The market life cycle model.In the gure, TTM grow is the market growing period, TTM matu the market maturityperiod, TTM decl the market declining period, and TTM rev the maximal revenue. The revenueis calculated as the area covered by the curve throughout the product's market life. Thus,the revenue can be expressed asR = 1 2 (TMM grow +2TMM matu + TMM decl ) TMM rev (2.56)If the product is earlier to the market due to DFT design added, the revenue loss is calculatedas the area of the shaded region shown in the gure. Then, revenue equation should be modify32