An Improved VLSI Test Economics Analysis System - Laboratory for ...
An Improved VLSI Test Economics Analysis System - Laboratory for ...
An Improved VLSI Test Economics Analysis System - Laboratory for ...

You also want an ePaper? Increase the reach of your titles
YUMPU automatically turns print PDFs into web optimized ePapers that Google loves.
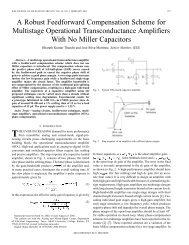
FC100%FC100%Phase IPhase IIVV(a)(b)Figure 2.7: (a) Empirical result of FC v.s V, (b) Goel's estimation.is a function of gate count (g) and nets (n).A s = as0 + as1 g 2 + as2p n (2.49)Thus, our yield model can base on poisson yield model but chip area should be replaced bythe total sensitive area (A s ). Finally, the yield model can be expressed asY = e , dA s(2.50)2.6.3 Fault CoverageFault coverage is used to estimate defect level as shown in (2.46). However, in this equation,the equiprobable faults include all possible faults. Precise analysis of all possible faultsneeds consider various fault model. However, the experience result of Ma [21] shows thateven though the single stuck-at fault may be inaccurate to model real faults, a sucienthigh single stuck-at fault coverage may be adequate to achieve high quality levels. Thus, weassume this is a high fault coverage project and target our fault coverage analysis on singlestuck-at fault model.This subsection also estimate test vector length. This parameter is mainly used to estimatethe testing cost. However, fault coverage is a function of the test length and defectlevel aected by the fault coverage. Thus, trade-o between defect level and testing cost canbe regarded as trade-o between fault coverage and test length.The empirical result of relation between fault coverage and test length is shown in Fig-29