Financials 2008/2009 - Australian Red Cross
Financials 2008/2009 - Australian Red Cross
Financials 2008/2009 - Australian Red Cross
- No tags were found...

You also want an ePaper? Increase the reach of your titles
YUMPU automatically turns print PDFs into web optimized ePapers that Google loves.
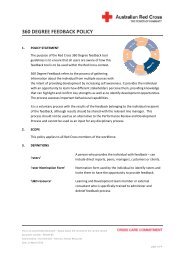
Income by sourceAs illustrated in the pie chart below, our source of funding isreceived predominately from government grants for specificprograms both in Australia and overseas. Governmentfunding income in <strong>2009</strong> decreased to 54% compared to79% in financial year <strong>2008</strong> due to the value of donationsreceived from the Bushfire Appeal. However, when BushfireAppeal results are excluded from total income received,government funding represents 83% of funding in financialyear <strong>2009</strong>. The <strong>Australian</strong> <strong>Red</strong> <strong>Cross</strong> Blood Service is fullyfunded by the Governments of Australia to the amount of$445 million.Government funding of non-blood humanitarian<strong>Red</strong> <strong>Cross</strong> activities represented 49% in <strong>2009</strong>.Community support income of 4% represents money receivedfrom public donations, bequests and third party communityfundraising. Exclusive of the Bushfire Appeal this representsa decrease of 4% on prior year (<strong>2008</strong>: 10% to <strong>2009</strong>: 6%)and is mainly attributable to the cancellation of our annualfundraising appeal <strong>Red</strong> <strong>Cross</strong> Calling to enable <strong>Australian</strong><strong>Red</strong> <strong>Cross</strong> Society to focus on raising funds for Victoria’sbushfire victims.<strong>2009</strong> incomeby source54%4% 1 %1% 4%36%Balance SheetDespite the economic climate of the past twelve monthsour balance sheet remains strong. Nevertheless, thefollowing are notable impacts in financial year <strong>2009</strong>:• increased borrowings of $32.9m used to finance theaquisition of property, plant and equipment and supportnon blood humanitarian services operational activities• reduction in investments of $19.8m of which $6.0mrelates to revaluation losses with the remainder of thereduction used to fund non blood humanitarian servicesoperational activities• in <strong>2008</strong>, we reported a net position for defined benefitsuperannuation plans of $0.8m. In <strong>2009</strong>, this positionhas turned into a $7.6m liability, driven largely by losseswithin superannuation plan assets stemming from marketreductions in the investments brought about by the globalfinancial crisis• $10.6m increase in cash held, which is attributable togovernment funding received for the <strong>Australian</strong> <strong>Red</strong> <strong>Cross</strong>Blood Service division which reported a $27.1m increasein cash for the period.Please refer to the Statement of Cash Flows in thefinancial accounts for further details.AcknowledgementsWe would like to take this opportunity to thank our donors,members, volunteers, staff and governments for theirsignificant assistance which enables us to continue to delivera vast array of services to the vulnerable. This human element,which doesn’t reflect in any one financial line item, makes thework of <strong>Australian</strong> <strong>Red</strong> <strong>Cross</strong> Society possible.A specific note of appreciation to the volunteer membersof the Board and sub committees of the Board for theirexpertise, dedication and support.Community support (excluding Victorian Bushfire Appeal)Victorian Bushfire AppealGovernment grantsSale of goods / provision of servicesInvestment incomeOther incomeRobert TicknerChief Executive OfficerJohn O’ConnorChief Financial Officer3
Income Statementfor the financial year ended 30 June <strong>2009</strong>SOCIETYNotesRevenue$’000<strong>2009</strong> <strong>2008</strong>Expense$’000NetRevenue /(Expense)$’000Revenue$’000Expense$’000NetRevenue /(Expense)General Activities* 137,922 (165,600) (27,678) 130,117 (149,019) (18,902)Specific Purpose Funds:– Victorian Bushfire Appeal 3 (b) 373,142 (373,142) – – – –– Tsunami Appeal 3 (c) 1,576 (13,107) (11,531) 2,679 (24,350) (21,671)– International Projects 3 (d) 21,602 (29,449) (7,847) 38,398 (23,287) 15,111– Domestic 36,778 (33,354) 3,424 17,346 (9,968) 7,378Total Non Blood HumanitarianServices571,020 (614,652) (43,632) 188,540 (206,624) (18,084)Blood Service 3 (e) 456,491 (418,658) 37,833 405,083 (390,121) 14,962Total before Finance Costs 1,027,511 (1,033,310) (5,799) 593,623 (596,745) (3,122)Finance Costs 5 (1,635) (1,635) (319) (319)NET DEFICIT FOR THE YEAR 4 (7,434) (3,441)* After eliminating inter group transactionsNON BLOODHUMANITARIAN SERVICESGeneral Activities 3 (a) 140,803 (165,600) (24,797) 132,728 (149,019) (16,291)Specific Purpose Funds:– Victorian Bushfire Appeal 3 (b) 373,142 (373,142) – – – –– Tsunami Appeal 3 (c) 1,576 (13,107) (11,531) 2,679 (24,350) (21,671)– International Projects 3 (d) 21,602 (29,449) (7,847) 38,398 (23,287) 15,111– Domestic 3 (a) 36,778 (33,354) 3,424 17,346 (9,968) 7,378$’000Total Non Blood HumanitarianServices573,901 (614,652) (40,751) 191,151 (206,624) (15,473)Finance Costs 5 (217) (217) (66) (66)NET DEFICIT FOR THE YEAR 4 (40,968) (15,539)The accompanying notes on pages 10 to 48 form part of these financial statements.5
Statement of RecognisedIncome and Expensefor the financial year ended 30 June <strong>2009</strong>NotesSOCIETY<strong>2009</strong>$’000<strong>2008</strong>$’000NON BLOODHUMANITARIANSERVICESActuarial loss on defined benefit plans 15 (8,360) (2,049) (279) (71)Loss on available-for-sale investmentstaken to equity<strong>2009</strong>$’000<strong>2008</strong>$’00016 – (6,414) – (6,414)Net expense recognised directly in equity (8,360) (8,463) (279) (6,485)Net deficit for the year (7,434) (3,441) (40,968) (15,539)TOTAL RECOGNISED INCOME AND (EXPENSE) (15,794) (11,904) (41,247) (22,024)The accompanying notes on pages 10 to 48 form part of these financial statements.7
Statement of Changes in Equityfor the financial year ended 30 June <strong>2009</strong>AccumulatedfundsSpecificpurposefundsPropertyfundreserveAssetreplacementreserveARCBSspecialreserveGeneralreserveFairvaluereserveTotalNotes$’000$’000$’000$’000$’000$’000$’000$’000SOCIETYYear ended 30 June <strong>2008</strong>Balance as at 1 July 2007 166,106 60,485 2,773 2,011 13,388 5,771 7,001 257,535Net deficit for the year (3,441) - - - - - - (3,441)Net expense recognised directly in equity (2,049) - - - - - (6,414) (8,463)Transfers to / (from) fair value reserves 16, 18 587 - 198 - - (198) (587) -Transfer from / (to) special reserve 16, 18 2,888 - - - (2,888) - - -Transfers to / (from) specific purpose funds 16, 17, 18 (818) 6,404 - (13) - (5,573) - -Balance as at 30 June <strong>2008</strong> 163,273 66,889 2,971 1,998 10,500 - - 245,631Year ended 30 June <strong>2009</strong> -Net deficit for the year (7,434) - - - - - - (7,434)Net expense recognised directly in equity (8,360) - - - - - - (8,360)Transfer from / (to) special reserve 16, 18 (426) - - - 426 - - -Transfers to / (from) specific purpose funds 16, 17, 18 17,942 (17,942) - - - - - -BALANCE AS AT 30 June <strong>2009</strong> 164,995 48,947 2,971 1,998 10,926 - - 229,837NON BLOOD HUMANITARIAN SERVICESYear ended 30 June <strong>2008</strong>Balance as at 1 July 2007 107,983 60,485 2,773 2,011 - 5,771 7,001 186,024Net deficit for the year (15,539) - - - - - - (15,539)Net expense recognised directly in equity (71) - - - - - (6,414) (6,485)Transfers to / (from) fair value reserves 16, 18 587 - 198 - - (198) (587) -Transfers to / (from) specific purpose funds 16, 17, 18 (818) 6,404 - (13) - (5,573) - -Balance as at 30 June <strong>2008</strong> 92,142 66,889 2,971 1,998 - - - 164,000Year ended 30 June <strong>2009</strong> -Net deficit for the year (40,968) - - - - - - (40,968)Net expense recognised directly in equity (279) - - - - - - (279)Transfers to / (from) specific purpose funds 16, 17, 18 17,942 (17,942) - - - - - -BALANCE AS AT 30 June <strong>2009</strong> 68,837 48,947 2,971 1,998 - - - 122,753The accompanying notes on pages 10 to 48 form part of these financial statements.8
Statement of Cash Flowsfor the financial year ended 30 June <strong>2009</strong>Cash flows from operating activitiesNotesSOCIETY<strong>2009</strong>$’000<strong>2008</strong>$’000NON BLOODHUMANITARIANSERVICESReceipts from donors, government and other sources 1,068,082 625,616 568,250 181,269Payments to suppliers and employees (1,052,580) (585,520) (605,854) (193,069)Interest and other costs of finance paid (2,042) (318) (624) (66)Net cash provided / (used in) by operating activities 19 (b) 13,460 39,778 (38,228) (11,866)<strong>2009</strong>$’000<strong>2008</strong>$’000Cash flows from investing activitiesPayments for property, plant and equipment (56,666) (70,050) (14,445) (9,656)Payment for investment securities (5,241) (2,776) (5,241) (2,776)Proceeds from sale of property, plant and equipment 941 2,262 804 2,100Proceeds on sale of investment securities 17,488 21,456 17,488 21,456Dividends received 2,157 3,115 2,157 3,115Interest received 6,303 8,083 3,156 4,676Net cash provided / (used in) by investing activities (35,018) (37,910) 3,919 18,915Cash flows from financing activitiesProceeds from borrowings 34,117 32,615 18,000 -Repayment of borrowings (1,193) (21,061) - -Net cash provided by financing activities 32,924 11,554 18,000 -Net increase / (decrease) in cash and cashequivalentsCash and cash equivalents at the beginning of thefinancial yearEffects of exchange rate changes on the balance of cashheld in foreign currenciesCASH AND CASH EQUIVALENTS AT THE END OFTHE FINANCIAL YEAR19 (a)11,366 13,422 (16,309) 7,04971,284 57,620 36,522 29,018(730) 242 (150) 45581,920 71,284 20,063 36,522The accompanying notes on pages 10 to 48 form part of these financial statements.9
Notes to the financial statementsfor the financial year ended 30 June <strong>2009</strong>1 – Principal activities and registeredoffice in Australia<strong>Australian</strong> <strong>Red</strong> <strong>Cross</strong> Societyundertakes a wide range of activities toimprove the lives of vulnerable peopleby pursuing its humanitarian goals andobjectives in Australia and overseas.<strong>Australian</strong> <strong>Red</strong> <strong>Cross</strong> Society is an organisationincorporated by Royal Charter and is a member of theInternational Federation of <strong>Red</strong> <strong>Cross</strong> and <strong>Red</strong> CrescentSocieties. <strong>Australian</strong> <strong>Red</strong> <strong>Cross</strong> Society operates astwo key divisions being Non Blood HumanitarianServices and <strong>Australian</strong> <strong>Red</strong> <strong>Cross</strong> Blood Service(Blood Service) divisions.Blood Service’s corporate office is at 464 St Kilda Road,Melbourne, Victoria with principal places of business in thecapital cities of all States and Territories. The principal activityof Blood Service is the provision of quality blood products,tissues and related services for the benefit of the community.Blood Service operates five main processing and testingfacilities, five other processing facilities plus a network ofcollection centres in metropolitan and regional areas acrossAustralia. Blood Service is funded for this activity by theCommonwealth, State and Territory governments undera Deed of Agreement (Deed) administered by the NationalBlood Authority (NBA).Non Blood Humanitarian Services maintains principal placesof business in each of the capital cities of all <strong>Australian</strong>States and Territories. The principal activity of Non BloodHumanitarian services is providing relief in times of crisisand care for the most vulnerable in Australia and aroundthe world.<strong>Australian</strong> <strong>Red</strong> <strong>Cross</strong> Society is domiciled in Australia andits registered office and principal place of business is:<strong>Australian</strong> <strong>Red</strong> <strong>Cross</strong> Society155 Pelham StreetCARLTON VIC 3053Tel: (03) 9345 1800ABN 501 69 561 3942 – Summary of significantaccounting policiesStatement of complianceThe financial report is a general purpose financial reportwhich has been prepared in accordance with AccountingStandards and Interpretations, and complies with otherrequirements of the law.The financial report includes the separate financial statementsof the Society inclusive of Blood Service and Non BloodHumanitarian Service division. For disclosure purposes theNon Blood Humanitarian Service division has also beenseparately disclosed.Accounting Standards include <strong>Australian</strong> equivalentsto International Financial Reporting Standards (A-IFRS).Compliance with A-IFRS ensures that the financial statementsand notes of the Society comply with International FinancialReporting Standards (IFRS), except for the requirementsapplicable to not-for-profit organisations.The financial report of <strong>Australian</strong> <strong>Red</strong> <strong>Cross</strong> Societyfor the year ended 30 June <strong>2009</strong> was authorised forissue in accordance with a resolution of the Board on29 October <strong>2009</strong>.10
Notes to the financial statementsfor the financial year ended 30 June <strong>2009</strong>2 – Summary of significant accounting policies (continued)Adoption of new and revised Accounting StandardsIn the current year, the Society has adopted all of the new andrevised Standards and Interpretations issued by the <strong>Australian</strong>Accounting Standards Board (AASB) that are relevant to itsoperations and effective for the current annual reporting period.Details of the impact of the adoption of these new accountingstandards are set out in the individual accounting policy notesset out below.At the date of authorisation of the financial report, the followingStandards and Interpretations were in issue but not yet effective:AASB 101 ‘Presentation of Financial Statements’(revised September 2007), AASB 2007-8 ‘Amendmentsto <strong>Australian</strong> Accounting Standards arising from AASB 101’,AASB 2007-10 ‘Further Amendments to <strong>Australian</strong>Accounting Standards arising from AASB 101’AASB <strong>2008</strong>-5 ‘Amendments to <strong>Australian</strong> AccountingStandards arising from the Annual Improvements Project’Effective for annual reporting periodsbeginning on or after 1 January <strong>2009</strong>Expected to be initially applied in financialyear ending 30 June 2010Effective for annual reporting periodsbeginning on or after 1 January <strong>2009</strong>Expected to be initially applied in financialyear ending 30 June 2010AASB <strong>2008</strong>-6 ‘Further Amendments to <strong>Australian</strong> AccountingStandards arising from the Annual Improvements Project’Effective for annual reporting periodsbeginning on or after 1 July <strong>2009</strong>Expected to be initially applied in financialyear ending 30 June 2010AASB <strong>2008</strong>-8 ‘Amendments to <strong>Australian</strong> AccountingStandards – Eligible Hedged Items’Effective for annual reporting periodsbeginning on or after 1 July <strong>2009</strong>Expected to be initially applied in financialyear ending 30 June 2010AASB 123 ‘Borrowing Costs’, with amendmentAASB 2007-6Effective for annual reporting periodsbeginning on or after 1 January <strong>2009</strong>Expected to be initially applied in financialyear ending 30 June 2010AASB Interpretation 15 ‘Agreements for the Constructionof Real Estate’Effective for annual reporting periodsbeginning on or after 1 January <strong>2009</strong>Expected to be initially applied in financialyear ending 30 June 2010We have not listed all of the issued but not yet effective Standardsand Interpretations. Only those standards and interpretationsthat are relevant to <strong>Australian</strong> <strong>Red</strong> <strong>Cross</strong> Society have beenlisted above.The Board anticipates that the adoption of these Standardsand Interpretations in future periods will have no material impacton the financial statements of <strong>Australian</strong> <strong>Red</strong> <strong>Cross</strong> Society.11
Notes to the financial statementsfor the financial year ended 30 June <strong>2009</strong>2 – Summary of significant accounting policies (continued)Basis of preparationThe financial report has been prepared on an accruals basisand is based on historical costs modified by the revaluation ofselected non-current assets and financial assets and liabilities,including derivatives, for which the fair value basisof accounting has been applied. Cost is based on the fairvalues of the consideration given in exchange for assets.The financial report is presented in <strong>Australian</strong> dollars and allvalues are rounded to the nearest thousand dollars ($’000),unless otherwise stated.In the application of the Society’s accounting policiesmanagement is required to make judgements, estimates andassumptions about carrying values of assets and liabilitiesthat are not readily apparent from other sources. Theestimates and associated assumptions are based on historicalexperience and various other factors that are considered tobe relevant. Actual results may differ from these estimates.The estimates and underlying assumptions are reviewedon an ongoing basis. Revisions to accounting estimates arerecognised in the period in which the estimate is revised if therevision affects only that period or in the period of the revisionand future periods if the revision affects both current andfuture periods.The Society’s financial statements are prepared by combiningthe financial statements of all the key divisions that comprisethe entity. Consistent accounting policies are employed in thepreparation of and presentation of the financial statementsacross the divisions.The financial statements include the information and resultsof each division.In preparing the financial statements, all inter divisionsbalances and transactions, and unrealised profits arisingwithin the entity are eliminated in full.The following significant accounting policies have beenadopted in the preparation and presentation of thefinancial report:(a) Foreign currencyThe functional and presentation currency of <strong>Australian</strong><strong>Red</strong> <strong>Cross</strong> Society is <strong>Australian</strong> dollars ($AUD).Transactions in foreign currencies are initially recorded in thefunctional currency at the exchange rates ruling at the date ofthe transaction. Monetary assets and liabilities denominatedin foreign currencies are retranslated at the rate of exchangeruling at the balance sheet date.All foreign currency differences in the financial report are takento the income statement. As at the reporting date, the assetsand liabilities of foreign operations whose functional currencyis not $AUD, are translated into the presentation currency of<strong>Australian</strong> <strong>Red</strong> <strong>Cross</strong> Society at the rate of exchange ruling atthe balance sheet date. Exchange differences arising, if any,are taken to the profit or loss.(b) Income taxThe Society being a charitable organisation is exemptfrom income tax under subsection 50-5 of the IncomeTax Assessment Act 1997.(c) Goods and services taxRevenues, expenses and assets are recognised net of theamount of goods and services tax (GST), except:i. where the amount of GST incurred is not recoverable fromthe taxation authority, it is recognised as part of the cost ofacquisition of an asset or as part of an item of expense;orii. for receivables and payables which are recognised inclusiveof GST.The net amount of GST recoverable from, or payable to,the taxation authority is included as part of receivables orpayables in the Balance Sheet.Cash flows are included in the Cash Flow Statement on agross basis. The GST component of cash flows arising frominvesting and financing activities which is recoverable from,or payable to, the taxation authority is classified withinoperating cash flows.(d) RevenueRevenue is recognised to the extent that it is probable that theeconomic benefits will flow to the Society and the revenue canbe reliably measured.Rendering of servicesRevenue is recognised when the contract outcome can bemeasured reliably, control of the right to be compensated forthe service determined, and the stage of completion can bemeasured reliably.Sale of goodsRevenue is recognised when the significant risks and rewardsof ownership of the goods have passed to the buyer and itcan be measured reliably. Risks and rewards are consideredpassed to the buyer at the time of delivery of the goods to thecustomer.InterestInterest revenue is recognised on a time proportionate basisthat takes into account the effective yield on the financialasset. Interest accruing on funds held for a special purpose iscredited to that special purpose fund within equity after firstbeing recorded in the income statement (refer note 17).DividendsDividend revenue is recognised on a receivable basis.Rental incomeRental income received from properties owned by the Societyis accounted for on a straight-line basis over the lease term.Contingent rental income is recognised as income in theperiods in which it is earned.Society – other grants and contributionsGrants income and other contributions are recognised whenthe Society obtains control of the contribution or right toreceive the contribution and it is probable that the economicbenefits comprising the contributions will flow to the Society.12
Notes to the financial statementsfor the financial year ended 30 June <strong>2009</strong>2 – Summary of significant accounting policies (continued)Society – donationsThe Society receives part of its income from donations, ascash or in kind. Amounts donated can be recognised asrevenue only when the Society gains control, economicbenefits are probable and the amounts can be measuredreliably. The Society establishes controls to ensure thatdonations are recorded in the financial records, however attimes it is impractical to maintain effective controls over thecollection of such revenue prior to its initial entry into thefinancial records. Therefore, donations are recognised asrevenue when they are recorded in the books and recordsof the Society. Donations received for specific purposes aretransferred to a separate fund within equity after being firstrecorded in the income statement (refer note 17).Blood Service – operating grant fundingFrom 1 July 2003, the National Blood Authority (NBA)coordinates, on behalf of the Commonwealth, State andTerritory governments, national arrangements between theBlood Service and Governments for the supply of blood andblood related products and services. These arrangementswere to be formalised under a Deed of Agreement (the‘Deed’). Under these terms, the NBA remitted funds to theBlood Service for its Main Operating Programme and otherNBA-approved programmes. The Deed was signed by theSociety and the NBA on 21 August 2006, and sets out therelationship between the parties, andthe funding arrangements for the Blood Service over thenext 3 years to 30 June <strong>2009</strong>. A variation to the Deed wassigned on 30 June <strong>2009</strong> to roll-over the current fundingarrangements to 30 June 2010, whilst Blood Service andNBA are in negotiations in relation to future fundingarrangements after 30 June 2010.Blood Service also receives grants from the Commonwealthand State Governments for the provision of the nationaltransplantation service of tissue typing, organ donor programand the bone marrow registry.Blood Service – capital incomeThe arrangement with the NBA provides for capital fundingup to 10% of the funding for the Main Operating Programmefor the financial year. During the year, the Blood Servicereceived capital funding from the NBA based on the cashflow commitments relating to capital expenditure.Government grants are recognised as income when the BloodService obtains control of the contribution, or the right toreceive the contribution, and it is probable that the economicbenefits of the contribution will flow to the Blood Service.(e) Cash and cash equivalentsCash and short-term deposits in the balance sheet comprisecash at bank and on hand, short-term deposits and bills,which are subject to an insignificant risk of changes in valueand have an original maturity of three months or less.For the purposes of the Cash Flow Statement, cash andcash equivalents consists of cash and cash equivalentsas defined above, net of outstanding bank overdrafts.(f) Non-derivative financial instrumentsFinancial instruments are initially measured at cost on tradedate, which includes transaction costs, when the relatedcontractual rights or obligations exist. Subsequent to initialrecognition these instruments are measured as set out below:Financial assetsInvestments are recognised and derecognised on trade datewhere purchase or sale of an investment is under a contractwhose terms require delivery of the investment within thetimeframe established by the market concerned, and areinitially measured at fair value.Subsequent to initial recognition, financial assets are classifiedinto the following categories depending on the nature andpurpose of the financial asset and is determined at the timeof initial recognition:Held-to-maturity investmentsThese investments have fixed maturities, and it is the Society’sintention to hold these investments to maturity. This categoryincludes government bonds and fixed interest securities. Anyheld-to-maturity investments held by the Society are statedat amortised cost using the effective interest method lessimpairment, with revenue recognised on an effective-yield basis.The effective interest method is a method of calculating theamortised cost of a financial asset and of allocating interestincome over the relevant period. The effective interest rate isthe rate that exactly discounts estimated future cash receiptsthrough the expected life of the financial asset, or whereappropriate, a shorter period.Available for sale financial assetsAvailable-for-sale financial assets include financial assets notincluded in the above category. Available-for-sale financialassets are reflected at fair value. Unrealised gains and lossesarising from the changes in fair value are taken direct to equity,except for impairment losses which are recognised in theincome statement.Loans and receivablesTrade receivables, loans and other receivables that havefixed or determinable payments that are not quoted in anactive market are classified as ‘loans and receivables’.Loans and receivables are measured at amortised costusing the effective interest method less impairment. Interestincome is recognised by applying the effective interest rate.Financial liabilitiesNon-derivative financial liabilities, including loans andborrowings, are recognised at amortised cost, comprisingoriginal debt less principal payments and amortisation.Fair valueFair value is determined based on current bid prices forall quoted investments. Valuation techniques are appliedto determine the fair value for all unlisted securities,including recent arms length transactions, referenceto similar instruments and option pricing models.13
Notes to the financial statementsfor the financial year ended 30 June <strong>2009</strong>2 – Summary of significant accounting policies (continued)ImpairmentAt each reporting date, the board members assess whetherthere is objective evidence that a financial instrument hasbeen impaired. In the case of ‘available-for-sale’ financialassets, a prolonged or significant decline in the value of theinstrument is considered to determine whether an impairmenthas arisen. Impairment losses are recognised in the incomestatement. For financial assets carried at amortised cost, theamount of the impairment is the difference between the asset’scarrying amount and the present value of estimated futurecash flows, discounted at the original effective interest rate.The carrying amount of financial assets including uncollectibletrade receivables is reduced by the impairment loss throughthe use of an allowance account. Subsequent recoveriesof amounts previously written off are credited against theallowance account. Changes in the allowance account arerecognised in profit or loss.With the exception of available-for-sale for equity instruments,if in a subsequent period the amount of the impairment lossdecreases and the decrease can be related objectively to anevent occurring after the impairment was recognised, thepreviously recognised impairment loss is reversed throughprofit or loss to the extent the carrying amount of theinvestment at the date the impairment is reversed does notexceed what the amortised cost would have been had theimpairment not been recognised.In respect of available-for-sale equity instruments, anysubsequent increase in fair value after an impairment loss isrecognised directly in equity.(g) InventoriesInventories held for sale are valued at the lower of cost andnet realisable value. Where inventories are held for distributionor are to be consumed by the Society in providing service oraid at no nominal charge, they are valued at the lower of costand net replacement cost.The Blood Service has the following categories of inventories:ConsumablesConsumables are used by the Blood Service in providingproducts and services, and are measured at the lower of costand current replacement cost.Inventories held for distributionThe Blood Service provides products and services inaccordance with the Deed (refer note 2(d)). In the discharge ofthis agreement, the Blood Service is responsible for a rangeof activities, including collection, testing, processing, inventorymanagement and distribution of blood and blood products.In this context, the Blood Service recognises blood andblood products as current assets, to be measured at lowerof cost and current replacement cost. Cost comprises directmaterials and direct labour of the operating units incurred inthe collection and processing of blood. Inventories includeblood and blood products at the Blood Service, and plasmastocks and fractionated products by the fractionator, CSL Ltd.Additionally,in relation to inventories held for distribution, the Blood Servicehas received legal advice that the ownership of blood andblood products produced by Blood Service rests with theBlood Service.(h) Trade and other receivablesTrade receivables, which generally have 30 day terms, arerecognised and carried at original invoice amount less anallowance for any uncollectible amounts.An estimate for doubtful debts is made when collection ofthe full amount is no longer probable. Bad debts are writtenoff as incurred.(i) Non current assets held for saleNon current assets classified as assets held for sale aremeasured at the lower of carrying amount and fair value lesscosts to sell. Non current assets are classified as held forsale if their carrying amount will be recovered through a saletransaction rather than through continuing use. This conditionis regarded as met only when the sale is highly probableand the asset is available for immediate sale in its presentcondition. The sale of the asset is expected to be completedwithin one year from the date of classification.(j) Property, plant and equipmentProperty, plant and equipment are stated at cost, less anysubsequent accumulated depreciation and any impairment invalue. Cost includes expenditure that is directly attributable tothe item.Depreciation is calculated on a straight-line basis so as towrite off the net cost or other revalued amount of each assetover its expected useful life to its estimated residual value.The estimated useful lives, residual values and depreciationmethod is reviewed at the end of each annual reporting period.The following estimated useful lives are used in the calculationof depreciation:Freehold buildingsand renovationsLeaseholdimprovements40 yrs 2.5% 40 yrs 2.5%Shorter of leaseperiod or useful lifeShorter of leaseperiod or useful lifeShop fit-outs 5.7 yrs 17.5% – –Plant and equipment– Motor vehicles 5 yrs 20.0% 4 yrs 25.0%– Computerequipment– Plant andmachinery– Administrativeequipment– Furniture andfittings– Laboratoryequipment– Mobile collectionequipmentNON BLOODHUMANITARIANSERVICESBLOODSERVICE3 yrs 33.3% 4 yrs 25.0%5 yrs 20.0% 10 yrs 10.0%– – 5 yrs 20.0%– – 10 yrs 10.0%– – 8 yrs 12.5%– – 10 yrs 10.0%14– Static collectionequipment– – 8 yrs 12.5%
Notes to the financial statementsfor the financial year ended 30 June <strong>2009</strong>2 – Summary of significant accounting policies (continued)(k) Loans and borrowingsAll loans and borrowings are initially recognised at cost, beingthe fair value of the consideration received net of issue costsassociated with the borrowing.After initial recognition, interest-bearing loans and borrowingsare subsequently measured at amortised cost using theeffective interest method. Amortised cost is calculated bytaking into account any issue costs, and any discount orpremium on settlement.Gains and losses are recognised in the income statementwhen the liabilities are derecognised and as well as throughthe amortisation process.(l) PayablesLiabilities for trade creditors and other amounts are carriedat cost which is the fair value of the consideration to be paidin the future for goods and services received, whether or notbilled to the Society.Payables to related parties are carried at the principal amount.Interest, when charged by the lender, is recognised as anexpense on an accrual basis.(m) ImpairmentAt each reporting date, the Society reviews the carryingamounts of its tangible assets to determine whether there isany indication that those assets have suffered an impairmentloss. If any such indication exists, the recoverable amount ofthe asset is estimated in order to determine the extent of theimpairment loss (if any). Where the asset does not generatecash flows that are independent from the other assets, theSociety estimates the recoverable amount of the cashgeneratingunit to which the asset belongs.Recoverable amount is the higher of fair value less coststo sell and value in use. As the future economic benefits ofthe Society’s assets are not primarily dependent on theirability to generate net cash inflows, and if deprived of theasset, the Society would replace the asset’s remaining futureeconomic benefits. The ‘value in use’ is determined as thedepreciated replacement cost of the asset, rather than byusing discounted future cash flows.Depreciated replacement cost is defined as the currentreplacement cost of an asset less, where applicable,accumulated depreciation calculated on the basis of suchcost to reflect the already consumed or expired futureeconomic benefits of the asset. The current replacement costof an asset is its cost measured by reference to the lowestcost at which the gross future economic benefits of that assetcould currently be obtained in the normal course of business.If the recoverable amount of an asset (or cash-generating unit)is estimated to be less than its carrying amount, the carryingamount of the asset (cash-generating unit) is reduced to itsrecoverable amount. An impairment loss is recognised in profitor loss immediately.Where an impairment loss subsequently reverses, thecarrying amount of the asset (cash-generating unit) isincreased to the revised estimate of its recoverable amount,but only to the extent that the increased carrying amountdoes not exceed the carrying amounts of the asset (cashgeneratingunit) in prior years. A reversal is recognised inprofit or loss immediately.(n) Finance costsFinance costs are recognised as an expense when incurred.(o) LeasesFinance leasesFinance leases, which transfer to the Society substantially allthe risks and benefits incidental to ownership of the leaseditem and are capitalised at the inception of the lease at the fairvalue of the leased property or, if lower, at the present valueof the minimum lease payments.Lease payments are apportioned between the financecharges and reduction of the lease liability so as to achievea constant rate of interest on the remaining balance of theliability. Finance charges are charged directly against income.Capitalised leased assets are depreciated over the shorterof the estimated useful life of the asset or the lease term.Operating leasesLeases where the lessor retains substantially all the risks andbenefits of ownership of the asset are classified as operatingleases. Initial direct costs incurred in negotiating an operatinglease are added to the carrying amount of the leased assetand recognised over the lease term on the same basis asthe lease income.Operating lease payments are recognised as an expensein the income statement on a straight-line basis over thelease term.Lease incentivesIn the event that lease incentives are received to enter intooperating leases, such incentives are recognised as a liability.The aggregate benefits of incentives are recognised as areduction of rental expense on a straight line basis, exceptwhere another systematic basis is more representative ofthe time pattern in which economic benefits from the leasedassets are consumed.(p) Employee benefitsShort-term employee provisionsProvision is made for the Society’s liability for employeebenefits arising from services rendered by employees tobalance date. Employee benefits that are expected to besettled within one year have been measured at the amountsexpected to be paid when the liability is settled, plus relatedon-costs.Long-term employee provisionsThe Society’s net obligation in respect of long-term servicebenefits, other than defined benefit superannuation plans, isthe amount of future benefit that employees have earned inreturn for their service in the current and prior periods. Theobligation is calculated using the projected unit credit methodand is discounted to its present value and the fair value ofany related assets is deducted. The discount rate is the yieldat the balance sheet date on government bonds that havematurity dates approximating to the terms of the Society’sobligations.15
Notes to the financial statementsfor the financial year ended 30 June <strong>2009</strong>2 – Summary of significant accounting policies (continued)Defined benefit superannuation fundsThe Society contributes to various staff retirement funds,both defined benefit and accumulation schemes, toprovide members with benefits on death or retirement.The defined benefit funds operated by the Society are theLocal Government Superannuation Scheme (“LGSS”) inNew South Wales, <strong>Australian</strong> <strong>Red</strong> <strong>Cross</strong> Staff SuperannuationPlan and the <strong>Australian</strong> <strong>Red</strong> <strong>Cross</strong> Staff Retirement Fund.The cost of providing benefits is determined by a qualifiedactuary using the projected unit credit method, with actuarialvaluations being carried out each reporting date. Actuarialgains and losses are recognised in full in profit or loss in theperiod in which they occur.Past service cost is recognised immediately to the extentthat the benefits are already vested, and otherwise isamortised on a straight-line basis over the average perioduntil the benefits become vested.The Society’s net obligation in respect of defined benefitpension plans is calculated separately for each plan.The defined benefit obligations recognised in the balancesheet represent the present value of defined benefitsobligations and assets, adjusted for unrecognised pastservice cost, net of the fair value of plan assets. Any assetresulting from this calculation is limited to past service cost,plus the present value of available refunds and reductionsin future contributions to the plans.The discount rate used in the calculation is the yield at thebalance sheet date on government bonds that have maturitydates approximating to the terms of the Society’s obligations.Defined contribution superannuation fundsObligations for contributions to defined contributionsuperannuation plans are recognised as an expensein the income statement as incurred.The Society contributes to the defined benefit fund of HealthSuper, a multi-employer fund, and some employees willreceive defined benefit post-employment benefits from thisfund. Sufficient information is not available to account forHealth Super as a defined benefit plan as each employer isexposed to actuarial risks associated with current and formeremployees of other entities. As a result there is no consistentand reliable basis for allocating the obligation, assets andcosts to individual entities. Therefore the Society has adopteddefined contribution accounting for these employees.Based on the 30 June <strong>2009</strong> actuarial overview, Health Superhad a surplus of $15.06 million (30 June <strong>2008</strong>: surplus$23.95 million). The fund’s actuary has determined thenotional excess net assets attributable to the Blood Service’semployees in the defined benefit scheme as at 30 June <strong>2009</strong>are $0.06 million (30 June <strong>2008</strong>: $0.08 million). The surplusis the difference between assets, valued at fair market value,and liabilities. Liabilities are determined to be the greater of theactuarial present value of all future expected benefit paymentsaccrued by members at the valuation date (present value ofaccrued benefits), and the benefit that has vested to membersat the valuation date (vested benefits). The fund’s actuary hasadvised that the contribution rates will remain unchanged forthe <strong>2009</strong>-10 financial year.(q) ProvisionsProvisions are recognised when the Society has a presentobligation (legal or constructive) as a result of a past event, itis probable that an outflow of resources embodying economicbenefits will be required to settle the obligation and a reliableestimate can be made of the amount of the obligation.Where the Society expects some or all of the provision to bereimbursed, for example under an insurance contract, thereimbursement is recognised as a separate asset but onlywhen the reimbursement is virtually certain. The expenserelating to any provision is presented in the income statementnet of any reimbursement.If the effect of the time value of money is material, provisionsare determined by discounting the expected future cash flowsat a pre-tax rate that reflects current market assessments ofthe time value of money and, where appropriate, the risksspecific to the liability.Where discounting is used, the increase in the provision dueto the passage of time is recognised as a finance cost.(r) Derivative financial instrumentsThe Society uses derivative financial instruments, beingforeign currency forward contracts to hedge its risksassociated with foreign currency fluctuations.Derivatives are initially recorded at fair value on the datea derivative contract is entered into and are subsequentlyremeasured to their fair value at each reporting date.The resulting gain or loss is recognised in profit or lossimmediately unless the derivative is designated and effectiveas a hedging instrument, in which event, the timing andrecognition in the profit and loss depends on the nature ofthe hedge relationship.All foreign currency forward contracts existing during thefinancial year were not designated as hedges and thereforethe changes in fair value of these contracts were recognisedimmediately in profit or loss.(s) Comparative amountsWhere necessary, the comparative figures have beenadjusted to conform to changes in presentation in thecurrent financial year.16
Notes to the financial statementsfor the financial year ended 30 June <strong>2009</strong>All foreign currency forward contracts existing during the financial year <strong>2009</strong> were not designated as hedges and therefore <strong>2008</strong>the changes infair value of these contracts were recognised immediately in profit or loss.SOCIETY and NON BLOODNetNet(s) Comparative HUMANITARIAN amounts SERVICESRevenue /Revenue /Revenue Expense (Expense) Revenue Expense (Expense)Where necessary, the comparative figures have been adjusted to conform to changes in presentation in the current financial year.$’000 $’000 $’000 $’000 $’000 $’000Note 3 – Revenue and Expenses3(a) GENERAL AND DOMESTICACTIVITIES (excluding Bushfire Appeal)Membership and Volunteers 1,524 (7,635) (6,111) 1,233 (5,909) (4,676)Services 82,513 (110,120) (27,607) 60,489 (81,824) (21,335)Retail 29,714 (27,725) 1,989 27,051 (24,818) 2,233Fundraising :Appeals, Donations and Sponsorships 26,719 (15,140) 11,579 30,368 (13,989) 16,379Legacies 13,431 (1,423) 12,008 11,381 (1,191) 10,190Total Fundraising* 40,150 (16,563) 23,587 41,749 (15,180) 26,569153,901 (162,043) (8,142) 130,522 (127,731) 2,791Investments 3,174 (255) 2,919 4,618 (126) 4,492Rental properties 3,303 (2,546) 757 3,176 (1,665) 1,511Communications 1 (5,817) (5,816) 45 (3,822) (3,777)Marketing 5,008 (5,066) (58) 4,910 (5,104) (194)Administration 11,330 (8,940) 2,390 5,290 (10,559) (5,269)Gain / (Loss) on disposal of fixed assets 660 (130) 530 403 (79) 324Gain / (Loss) on disposal of investments 204 (1,985) (1,781) 1,110 (1,365) (255)Depreciation - (6,171) (6,171) - (4,658) (4,658)Unrealised impairment loss on fair value ofavailable-for-sale investmentsUnrealised impairment loss on held-tomaturityinvestmentsTotal General and Domestic Activities(excluding Bushfire Appeal)- (3,610) (3,610) - (1,714) (1,714)- (2,391) (2,391) - (2,164) (2,164)23,680 (36,911) (13,231) 19,552 (31,256) (11,704)177,581 (198,954) (21,373) 150,074 (158,987) (8,913)* Total Fundraising revenue for the financial year of $40.1m (<strong>2008</strong>:$41.7m) excludes amounts raised from the Victorian Bushfire Appeal (<strong>2009</strong>: $373.1m,<strong>2008</strong>: $0) and Appeals specific to International projects (<strong>2009</strong>: $2.9m, <strong>2008</strong>: $13.0m). Amounts raised for these activities are separately disclosedin notes 3 (b), (c) and (d) below.17
Notes to the financial statementsfor the financial year ended 30 June <strong>2009</strong>SOCIETY<strong>2009</strong>$’000<strong>2008</strong>$’000NON BLOODHUMANITARIANSERVICES3(b) VICTORIAN BUSHFIRE APPEALDonations 373,096 - 373,096 -Interest revenue 46 - 46 -Total Revenue 373,142 - 373,142 -Funds disbursed to the <strong>2009</strong> Victorian Bushfire AppealFund Trust Account(373,142) - (373,142) -Funds yet to be disbursed to the<strong>2009</strong> Victorian Bushfire AppealFund Trust Account<strong>2009</strong>$’000<strong>2008</strong>$’000- - - -<strong>Australian</strong> <strong>Red</strong> <strong>Cross</strong> Society (<strong>Red</strong> <strong>Cross</strong>) in partnership with the Victorian Government and <strong>Australian</strong> Government on 08 February <strong>2009</strong> launched an appealconducted by <strong>Red</strong> <strong>Cross</strong> called the Victorian Bushfire Appeal <strong>2009</strong> (the Appeal).All monies received from the Appeal are transferred by <strong>Red</strong> <strong>Cross</strong> daily into the <strong>2009</strong> Victorian Bushfire Appeal Fund Trust Account established by theDepartment of Human Services pursuant to section 19(1) of the Financial Management Act 1994 for the disbursement in accordance with the stated AppealIntent: “Funds raised will be used to provide assistance to individuals and communities in towns and suburbs affected by the <strong>2009</strong> Victorian bushfires. <strong>Red</strong><strong>Cross</strong> will not deduct any costs from public donations to cover Appeal costs. All interest earned on donations will be invested back into the Appeal. Should thefunds raised exceed the amount required to meet these needs, any excess funds will be used to assist in future disasters in Victoria.”The <strong>2009</strong> Victorian Bushfire Appeal Fund Advisory Panel (the Panel) jointly appointed by the Victorian Government and <strong>Red</strong> <strong>Cross</strong>, has been established todisburse funds in accordance with the Appeal Intent.At 30 June <strong>2009</strong> $2.9m in interest was earned and invested back into the <strong>2009</strong> Victorian Bushfire Appeal Fund Trust Account. At this time, $301m wasapproved by the Panel for disbursement in accordance with the Appeal Intent of which $141m has been distributed.18
Notes to the financial statementsfor the financial year ended 30 June <strong>2009</strong>SOCIETY<strong>2009</strong>$’000<strong>2008</strong>$’000NON BLOODHUMANITARIANSERVICES3(c) TSUNAMI APPEALDonations 3 2 3 2Non-government grants - 191 - 191Interest revenue 1,573 2,486 1,573 2,486Total Revenue 1,576 2,679 1,576 2,679Initial response and emergency relief - (52) - (52)Rehabilitation and construction (11,406) (21,313) (11,406) (21,313)Program management and co-ordination (77) (1,462) (77) (1,462)<strong>Australian</strong> service delivery (323) (372) (323) (372)Depreciation (8) (35) (8) (35)Administration costs (1,293) (1,116) (1,293) (1,116)Total Expenses (13,107) (24,350) (13,107) (24,350)Net deficit for the year (11,531) (21,671) (11,531) (21,671)Funds carried forward from previous year 25,767 47,438 25,767 47,438Net deficit for the year (11,531) (21,671) (11,531) (21,671)Unspent Funds at 30 June 14,236 25,767 14,236 25,767<strong>2009</strong>$’000<strong>2008</strong>$’000<strong>Australian</strong> service delivery of $0.3m (<strong>2008</strong>: $0.4m) includes <strong>Australian</strong> based program support.Administration costs of $1.3m (<strong>2008</strong>: $1.1m) include accounting and administration activities. At 30 June <strong>2009</strong> administration costs represented 5.9% of totalrevenues received to date.Overarching Test: <strong>Australian</strong> <strong>Red</strong> <strong>Cross</strong> Society (<strong>Red</strong> <strong>Cross</strong>) has used an overarching test in relation to expenditure. This requires that in order for a cost tobe classed as administration to the Asia Quake and Tsunamis Appeal the cost in its entirety must be a new cost incurred as a result of the tsunami occurring.Hence <strong>Red</strong> <strong>Cross</strong> has not, and will not, claim any portion of general overheads incurred in normal, non-tsunami, operations.19
Notes to the financial statementsfor the financial year ended 30 June <strong>2009</strong><strong>2009</strong> <strong>2008</strong>SOCIETY andNON BLOODHUMANITARIANSERVICESDevelopingCountriesAid FundProjects$’000AusAidFundedProjects$’000OverseasProjectsFundedby OtherSources$’000TotalInternationalProjects(excludingTsunamiAppeal)$’000DevelopingCountriesAid FundProjects$’000AusAidFundedProjects$’000OverseasProjectsFundedby OtherSources$’000TotalInternationalProjects(excludingTsunamiAppeal)$’0003(d) INTERNATIONAL(excluding TsunamiAppeal)Donations 2,926 24 1 2,951 13,004 - - 13,004Governmentgrants :AusAid - 17,988 - 17,988 - 23,778 - 23,778Other - - - - - - 368 368Non-governmentgrants- - 288 288 - - 656 656Interest revenue 125 242 8 375 199 385 8 592Total Revenue 3,051 18,254 297 21,602 13,203 24,163 1,032 38,398Humanitarian aid (8,792) (14,035) (654) (23,481) (4,933) (13,450) (610) (18,993)Health (78) (4,791) (82) (4,951) (26) (3,675) (82) (3,783)Water supply andsanitationSupport to nongovernmentorganisations(41) (964) - (1,005) (44) (447) - (491)(6) (6) - (12) (1) (19) - (20)Total Expenses (8,917) (19,796) (736) (29,449) (5,004) (17,591) (692) (23,287)Net surplus /(deficit) for theyearFunds carriedforward fromprevious yearNet surplus /(deficit) for theyearUnspent Fundsat 30 June(5,866) (1,542) (439) (7,847) 8,199 6,572 340 15,11111,666 10,668 188 22,522 3,467 4,096 (152) 7,411(5,866) (1,542) (439) (7,847) 8,199 6,572 340 15,1115,800 9,126 (251) 14,675 11,666 10,668 188 22,52220
Notes to the financial statementsfor the financial year ended 30 June <strong>2009</strong>SOCIETY and NON BLOOD HUMANITARIAN SERVICES<strong>2009</strong><strong>2008</strong>$’000$’000INTERNATIONAL PROJECTS EXPENDITURE BY REGIONAfrica 5,357 861Asia 32,817 41,716Central and South America 1,044 574Europe 831 318Middle East 473 2,098Pacific 2,034 2,070Total 3 (c) & 3 (d) 42,556 47,637Expenditure by Region% 1 %1% 4%36%36%<strong>2009</strong>AfricaAsiaCentral and South AmericaEuropeMiddle EastPacific<strong>2008</strong>21
Notes to the financial statementsfor the financial year ended 30 June <strong>2009</strong>SOCIETY<strong>2009</strong>$’000<strong>2008</strong>$’0003(e) BLOOD SERVICESGovernment Grants 444,909 395,394Interest Revenue 3,147 3,407Other 8,435 6,282Total Revenue 456,491 405,083Operating Expenses (402,740) (369,954)Depreciation (18,768) (12,802)Impairment loss on fixed assets - (1,981)Reclassification of special reserves from / (to) special purpose funds 2,840 (5,291)Gain / (loss) on disposal of fixed assets 10 (93)Total Expenses (418,658) (390,121)Total Blood Services 37,833 14,962NON BLOODSOCIETYHUMANITARIANSERVICES<strong>2009</strong>$’000<strong>2008</strong>$’000<strong>2009</strong>$’000<strong>2008</strong>$’0003(f) REVENUERevenue from the sale of goods 36,352 33,228 36,381 33,228Revenue from the rendering of services 6,081 6,945 6,101 6,945Government grants 543,519 471,248 98,610 75,854Non-government grants 2,743 2,228 2,743 2,228Donations, Legacies and Sponsorships 414,876 54,664 414,876 54,664Interest Revenue:Bank Deposits 4,036 5,248 889 1,841Available-for-sale investments 556 349 556 349Held-to-maturity investments 1,632 2,486 1,632 2,486Dividends from other entities 2,228 3,115 2,228 3,115Rental Revenue:Investment properties 3,298 3,163 3,298 3,163Other Rental Revenue 1,381 1,645 4,213 4,256Other Revenue 10,809 9,304 2,374 3,022Total Revenue 1,027,511 593,623 573,901 191,15122
Notes to the financial statementsfor the financial year ended 30 June <strong>2009</strong>Note 4 – Gains, (Losses) and Other ExpensesSOCIETY<strong>2009</strong>$’000<strong>2008</strong>$’000NON BLOODHUMANITARIANSERVICES4(a) GAINS AND LOSSESDeficit for the year has been arrived at after crediting /(charging) the following gains and losses :Gain on disposal of property, plant and equipment 670 403 660 403Gain on disposal of investments 204 1,110 204 1,110Foreign exchange gains - 1,069 - 1,069874 2,582 864 2,582Unrealised impairment loss on fair value of available-forsaleinvestments(3,610) (1,714) (3,610) (1,714)Unrealised impairment loss on held-to-maturityinvestments<strong>2009</strong>$’000<strong>2008</strong>$’000(2,391) (2,164) (2,391) (2,164)Loss on disposal of property, plant and equipment (130) (172) (130) (79)Loss on disposal of investments (1,985) (1,365) (1,985) (1,365)Foreign exchange losses (730) (827) (150) (614)(8,846) (6,242) (8,266) (5,936)Total Gains / (Losses) (7,972) (3,660) (7,402) (3,354)4(b) OTHER EXPENSESDeficit for the year includes the following expenses :Cost of sales (89,800) (88,670) (7,053) (7,119)Inventory :Write-down of inventory to net realisable value (96) (340) (96) (291)Impairment of trade receivables (44) (75) (44) (75)Depreciation of non-current assets (24,947) (17,495) (6,179) (4,693)Operating lease rental expenses :Minimum lease payments (17,133) (13,729) (7,182) (5,628)Employee benefits expense :Wages and Salaries (288,875) (242,977) (77,178) (64,553)Post employment benefits:Defined benefit plans (940) (966) (8) (11)Defined contribution plans (23,027) (19,822) (7,091) (5,751)Termination benefits (2,752) (3,777) (967) (158)(26,719) (24,565) (8,066) (5,920)Impairment of work in progress - (1,981) - -Note 5 – Finance CostsInterest on bank overdrafts and loans 217 66 217 66Interest on obligations under finance leases 1,418 253 - -1,635 319 217 6623
Notes to the financial statementsfor the financial year ended 30 June <strong>2009</strong>Note 6 – Trade and Other ReceivablesSOCIETY<strong>2009</strong>$’000<strong>2008</strong>$’000NON BLOODHUMANITARIANSERVICESTrade receivables 17,704 9,438 15,233 6,266Allowance for doubtful debts (50) (49) (50) (49)<strong>2009</strong>$’000<strong>2008</strong>$’00017,654 9,389 15,183 6,217Goods and services tax recoverable - - 251 811Other receivables 369 1,033 295 30418,023 10,422 15,729 7,332Trade receivables are non-interest bearing and are generally on 30 day terms. Where debts are assessed to be non-recoverable, these are written off.Ageing of past due but not impaired trade receivables30-60 days 631 1,221 372 1,03360-90 days 438 441 425 20190-120 days 145 305 137 93120+ days 421 343 225 309Total 1,635 2,310 1,159 1,636Movement in the allowance for doubtful debtsOpening balance 1 July 49 16 49 16Impairment losses recognised on receivables 39 40 39 40Amounts written off as uncollectible (22) (2) (22) (2)Amounts recovered during the year (6) - (6) -Impairment losses reversed (10) (5) (10) (5)Closing balance 30 June 50 49 50 49Ageing of impaired trade receivables60-90 days 6 - 6 -90-120 days 10 3 10 3120+ days 34 46 34 46Total 50 49 50 49Note 7 – InventoriesConsumables 4,647 4,420 - 55Finished goods 30,039 20,496 2,141 1,810Work in progress 10,108 9,792 - -44,794 34,708 2,141 1,865Consumables inventory has been valued at weighted average cost, plasma inventory is valued at weighted average cost, and other blood products are valuedat direct costs. Inventories write-down recognised as an expense during the year was $nil (<strong>2008</strong>: $0.05m).24
Notes to the financial statementsfor the financial year ended 30 June <strong>2009</strong>Note 8 – Other Financial AssetsNotesSOCIETY<strong>2009</strong>$’000<strong>2008</strong>$’000NON BLOODHUMANITARIANSERVICESAvailable-for-sale financial assetsCurrentMortgage backed securities - 6,598 - 6,598Cash management account 3,188 - 3,188 -3,188 6,598 3,188 6,598Non-currentMortgage backed securities - 66 - 66Shares 17,390 29,633 17,390 29,633Notes 1,037 451 1,037 451Debentures - 88 - 8818,427 30,238 18,427 30,23821,615 36,836 21,615 36,836Held-to-maturity financial assetsCurrentAmortised Cost – 1 July 2,264 6,474 2,264 6,474Less Funds received on maturity - (215) - (215)Less Principal repayments (1,745) (3,974) (1,745) (3,974)Add / (Less) movement in interest (19) (17) (19) (17)Less Impairment 4 3 (4) 3 (4)Amortised cost – 30 June 503 2,264 503 2,264Non-currentAmortised Cost – 1 July 25,923 41,121 25,923 41,121Less Funds received on maturity - (12,794) - (12,794)Less Principal repayments (275) (107) (275) (107)Add / (Less) movement in interest (107) (137) (107) (137)Less Impairment 4 (2,394) (2,160) (2,394) (2,160)Amortised cost – 30 June 23,147 25,923 23,147 25,92323,650 28,187 23,650 28,187Disclosed in the financial statements as:Current other financial assets 3,691 8,862 3,691 8,862Non-current other financial assets 41,574 56,161 41,574 56,16145,265 65,023 45,265 65,023<strong>2009</strong>$’000<strong>2008</strong>$’000During the year ended 30 June <strong>2008</strong>, specific assets costing $342,075 (market value $290,382) previously classified as ‘held-to-maturity’ were reclassified‘available-for-sale’. The reclassification being based on the Society’s change in intention and ability relating to these assets held.During the year ended 30 June <strong>2008</strong>, specific assets costing $2,415,074 (market value $1,270,961) previously classified as ‘available-for-sale’ were reclassified‘held-to-maturity’. The reclassification being based on the Society’s change in intention and ability relating to these assets held.Unrealised impairment losses on investments held as ‘available-for-sale’ of $3.61m (<strong>2008</strong>: $1.71m) have been transferred to the income statement.Unrealised impairment losses on investments held as ‘held-to-maturity’ of $2.39m (<strong>2008</strong>: $2.16m) have been transferred to the income statement.25
Notes to the financial statementsfor the financial year ended 30 June <strong>2009</strong>Note 9 – Other AssetsSOCIETY<strong>2009</strong>$’000<strong>2008</strong>$’000NON BLOODHUMANITARIANSERVICESCurrentPrepayments 3,507 5,235 1,360 2,431<strong>2009</strong>$’000<strong>2008</strong>$’000Land,Buildings andRenovations$ ‘000Note 10 – Property, Plant and EquipmentSOCIETYYear ended 30 June <strong>2008</strong>Gross carrying amountShopFit-Outs$ ‘000Plant andEquipment$ ‘000Work inProgress$ ‘000Total$ ‘000Balance as at 1 July 2007 120,379 1,808 122,808 15,497 260,492Additions 5,859 122 61,142 2,584 69,707Disposals (1,199) - (5,733) (322) (7,254)Transfers to / (from) Work in Progress 484 181 (69) (596) -Impairment - - - (1,981) (1,981)Balance as at 30 June <strong>2008</strong> 125,523 2,111 178,148 15,182 320,964Accumulated depreciationBalance as at 1 July 2007 (41,214) (1,208) (91,506) - (133,928)Depreciation Expense (4,001) (197) (13,297) - (17,495)Disposals 1,142 - 4,232 - 5,374Balance as at 30 June <strong>2008</strong> (44,073) (1,405) (100,571) - (146,049)Net Book Value as at 30 June <strong>2008</strong> 81,450 706 77,577 15,182 174,915Year ended 30 June <strong>2009</strong>Gross carrying amountBalance as at 1 July <strong>2008</strong> 125,523 2,111 178,148 15,182 320,964Additions 15,572 496 25,557 16,406 58,031Disposals (1,769) - (15,696) - (17,465)Transfers to / (from) Work in Progress 6,589 7 7,096 (13,800) (108)Balance as at 30 June <strong>2009</strong> 145,915 2,614 195,105 17,788 361,422Accumulated depreciationBalance as at 1 July <strong>2008</strong> (44,073) (1,405) (100,571) - (146,049)Depreciation Expense (6,560) (226) (18,161) - (24,947)Disposals 1,577 - 14,231 - 15,808Balance as at 30 June <strong>2009</strong> (49,056) (1,631) (104,501) - (155,188)Net Book Value as at 30 June <strong>2009</strong> 96,859 983 90,604 17,788 206,23426
Notes to the financial statementsfor the financial year ended 30 June <strong>2009</strong>Land,Buildings andRenovations$ ‘000Note 10 – Property, Plant and Equipment (Continued)ShopFit-Outs$ ‘000Plant andEquipment$ ‘000Work inProgress$ ‘000Total$ ‘000NON BLOOD HUMANITARIAN SERVICESYear ended 30 June <strong>2008</strong>Gross carrying amountBalance as at 1 July 2007 77,756 1,808 20,917 24 100,505Additions 566 122 6,041 2,584 9,313Disposals - - (2,589) (322) (2,911)Transfers to / (from) Work in Progress 155 181 15 (351) -Balance as at 30 June <strong>2008</strong> 78,477 2,111 24,384 1,935 106,907Accumulated depreciationBalance as at 1 July 2007 (14,312) (1,208) (13,836) - (29,356)Depreciation Expense (1,702) (197) (2,794) - (4,693)Disposals - - 1,287 - 1,287Balance as at 30 June <strong>2008</strong> (16,014) (1,405) (15,343) - (32,762)Net Book Value as at 30 June <strong>2008</strong> 62,463 706 9,041 1,935 74,145Year ended 30 June <strong>2009</strong>Gross carrying amountBalance as at 1 July <strong>2008</strong> 78,477 2,111 24,384 1,935 106,907Additions 9,365 496 5,339 610 15,810Disposals (214) - (8,915) - (9,129)Transfers to / (from) Work in Progress 1,615 7 200 (1,930) (108)Balance as at 30 June <strong>2009</strong> 89,243 2,614 21,008 615 113,480Accumulated depreciationBalance as at 1 July <strong>2008</strong> (16,014) (1,405) (15,343) - (32,762)Depreciation Expense (2,307) (226) (3,646) - (6,179)Disposals 38 - 7,560 - 7,598Balance as at 30 June <strong>2009</strong> (18,283) (1,631) (11,429) - (31,343)Net Book Value as at 30 June <strong>2009</strong> 70,960 983 9,579 615 82,13727
Notes to the financial statementsfor the financial year ended 30 June <strong>2009</strong>Note 11 – Trade and Other PayablesCurrentNotesSOCIETY<strong>2009</strong>$’000<strong>2008</strong>$’000NON BLOODHUMANITARIANSERVICESTrade payables 57,489 51,552 15,903 14,606Accruals and other payables 1,104 833 1,104 833Goods and services tax payable 1,515 2,090 - -<strong>2009</strong>$’000<strong>2008</strong>$’00060,108 54,475 17,007 15,439Trade payables are non interest bearing and are normally settled on 30 day terms. Other payables are non interest bearing and have average term of 30 days.The continuous monitoring of cash flow ensures payables are paid within the credit timeframe.Note 12 – BorrowingsSecured – at amortised costCurrentBank loans (i) 5,000 - 5,000 -Finance lease liabilities (ii) 21 1,814 673 - -Non-currentBank loans (i) 13,000 - 13,000 -Finance lease liabilities (ii) 21 24,998 11,216 - -44,812 11,889 18,000 -Disclosed in the financial statements as:Current borrowings 6,814 673 5,000 -Non-current borrowings 37,998 11,216 13,000 -44,812 11,889 18,000 -(i) The bank loans are secured by a mortgage over a property located in Sydney. The interest rate applicable is equal to Bank Bill Swap Bid Rate (BBSY) plus1.00% per annum in respect of tranche 1 ($10m) and 1.45% per annum on tranche 2 ($8m). Tranche 1 of the loan has a maturity date of 12 June 2012 andtrache 2, 12 June 2014.(ii) The lease liabilities are secured over the leased asset to which they relate.28
Notes to the financial statementsfor the financial year ended 30 June <strong>2009</strong>Note 13 – ProvisionsSOCIETY<strong>2009</strong>$’000<strong>2008</strong>$’000NON BLOODHUMANITARIANSERVICESCurrentEmployee benefits 39,824 37,626 7,880 6,907Non-currentEmployee benefits 9,318 6,857 864 1,047Make good provisions 3,455 2,008 - -52,597 46,491 8,744 7,954Disclosed in the financial statements as:Current provisions 39,824 37,626 7,880 6,907Non-current provisions 12,773 8,865 864 1,04752,597 46,491 8,744 7,954The employee benefits provision contains provisions for annual leave, long service leave and rostered days off.<strong>2009</strong>$’000<strong>2008</strong>$’000Movements in make good provisionsOpening balance 1 July 2,008 1,482 - -Provision recognised during the year 1,447 526 - -Closing balance 30 June 3,455 2,008 - -The provision for costs of making good represents the present value of the management’s best estimate of the future sacrifice of economic benefits that will berequired to remove leasehold improvements from leasehold properties. The estimate has been made on the basis of historical make good costs, a review ofleases and future rentals. The unexpired terms of the leases range from two to twenty years.Note 14 – Other LiabilitiesCurrentLease incentive 215 112 - -Government grants refundable 2,017 - - -Deferred government grants - 1,648 - -Non-currentForeign currency contracts 435 - - -Lease incentive 2,087 2,148 - -4,754 3,908 - -Disclosed in the financial statements as:Current other liabilities 2,232 1,760 - -Non-current other liabilities 2,522 2,148 - -4,754 3,908 - -Lease incentives are in relation to Blood Service entering into (i) a twenty year operating lease for the principal site at Kelvin Grove, Brisbane and (ii) a five yearlease for the Parramatta property. The current amount refers to amounts to be recognised in the income statement within twelve months after balance date.The non-current amounts will be recognised in the income statements of subsequent financial years.29
Notes to the financial statementsfor the financial year ended 30 June <strong>2009</strong>Note 15 – Defined Benefit Superannuation PlansPrincipal actuarial assumptions:SOCIETY<strong>2009</strong>$’000<strong>2008</strong>$’000NON BLOODHUMANITARIANSERVICESDiscount rate 5.27% 5.78% 5.52% 5.48%Expected return on plan assets 7.04% 7.03% 7.00% 7.00%Expected rate of salary increases 4.62% 3.64% 6.00% 3.00%Amounts recognised in profit or loss in respectof these defined benefit plans are as follows:Current service cost 1,400 1,677 32 42Member contributions (137) (157) (11) (13)Interest cost 1,226 1,199 27 27Expected return on plan assets (1,549) (1,753) (40) (45)940 966 8 11The amount included in the balance sheet arisingfrom the entity’s obligations in respect of itsdefined benefit plans is as follows:Present value of funded obligations 24,935 22,874 729 478Fair value of plan assets (17,300) (23,681) (538) (553)Net (asset) / liability 7,635 (807) 191 (75)Comprising:Net (asset) in the balance sheet - (1,059) - (75)Net liability in the balance sheet 7,635 252 191 -Net (asset) / liability in the balance sheet 7,635 (807) 191 (75)<strong>2009</strong>$’000<strong>2008</strong>$’00030
Notes to the financial statementsfor the financial year ended 30 June <strong>2009</strong>SOCIETY<strong>2009</strong>$’000Note 15 – Defined Benefit Superannuation Plans (Continued)<strong>2008</strong>$’000NON BLOODHUMANITARIANSERVICESMovements in the present value of the defined benefitobligations in the current year were as follows:Balance 1 July 22,874 23,895 478 518Current service cost 1,402 1,677 32 42Interest on obligation 1,226 1,199 27 27Actuarial (gain) / loss on liabilities 2,735 (1,523) 198 (62)Benefits paid (including expenses and taxes) (3,302) (2,374) (6) (47)Balance 30 June 24,935 22,874 729 478Movements in the present value of the plan assets in thecurrent year were as follows:Balance 1 July 23,681 26,718 553 653Expected return on plan assets 1,549 1,753 40 45Actuarial (loss) / gain on assets (5,625) (3,572) (81) (133)Employer contributions 861 999 21 22Contributions from plan participants 136 157 11 13Benefits paid (including expenses and taxes) (3,302) (2,374) (6) (47)Balance 30 June 17,300 23,681 538 553Other disclosures:The percentage contribution of each majority categoryof total plan assets comprises:<strong>Australian</strong> equities 27.3% 27.9% 26.6% 24.5%International equities 24.0% 25.4% 20.9% 24.5%Property 15.2% 14.9% 6.4% 9.5%<strong>Australian</strong> fixed interest 6.1% 8.5% 10.4% 12.5%International fixed interest 7.2% 7.7% 15.3% 17.0%Cash 4.3% 2.7% 8.9% 6.5%Other 15.9% 12.9% 11.5% 5.5%100.0% 100.0% 100.0% 100.0%<strong>2009</strong>$’000<strong>2008</strong>$’00031
Notes to the financial statementsfor the financial year ended 30 June <strong>2009</strong><strong>2009</strong>$’000<strong>2008</strong>$’000<strong>2009</strong>$’000<strong>2008</strong>$’000Note 15 – Defined Benefit Superannuation Plans (Continued)SOCIETYHistoric summaryDefined benefit plan obligations 24,935 22,874 23,895 24,610Plan assets (17,300) (23,681) (26,718) (26,244)(Surplus) / deficit 7,635 (807) (2,823) (1,634)Experience adjustments arising on plan liabilities 2,572 (1,431) 256 (2,557)Experience adjustments arising on plan assets (5,625) (3,572) 1,101 1,274NON BLOOD HUMANITARIAN SERVICESHistoric summaryDefined benefit plan obligations 729 478 518 527Plan assets (538) (553) (653) (665)(Surplus) / deficit 191 (75) (135) (138)Experience adjustments arising on plan liabilities 35 30 (76) (1)Experience adjustments arising on plan assets (81) (133) 63 28NON BLOODSOCIETYHUMANITARIANSERVICES<strong>2009</strong>$’000<strong>2008</strong>$’000<strong>2009</strong>$’000<strong>2008</strong>$’000Actual return on assets (3,218) 928 (41) (88)Amounts recognised in the statement of recognisedincome and expenseActuarial losses 8,360 2,049 279 71Cumulative amount recognised in the statementof recognised income and expenseCumulative amount of actuarial (gains) / losses 8,713 (353) 239 40Expected contributions and funding arrangementsExpected employer contributions at 30 June 1,541 848 15 18The current contributions recommendation as set out in the report of the most recent actuarial valuation of the fund as at 30 June <strong>2009</strong>, is 4.6% (<strong>2008</strong>: 4%) ofsalaries in respect of defined benefits.The method used to determine the employer contribution recommendations at the last actuarial review was the ‘aggregate cost’ funding method. This methodinvolves determining a level contributions rate that, together with future member contributions and existing assets, is sufficient to meet the expected benefitsand costs for existing members if the assumption used in the valuation are borne out of practice.The Society has recognised an asset in the balance sheet in respect of its defined benefit superannuation arrangements. If a surplus exists in the plans, theSociety may be able to take advantage of it in the form of a reduction in the required contributions, depending on the advice of actuaries.32
Notes to the financial statementsfor the financial year ended 30 June <strong>2009</strong>Propertyfundreserve (i)$ ‘000Assetreplacementreserve (ii)$ ‘000ARCBSspecialreserve (iii)$ ‘000Generalreserve (iv)$ ‘000Fair valuereserve (v)$ ‘000Total$ ‘000Note 16 – ReservesSOCIETYYear ended 30 June <strong>2008</strong>Balance as at 1 July 2007 2,773 2,011 13,388 5,771 7,001 30,944Transfers (to) / from reserves 198 - - (198) - -Transfers to specific purpose funds - (13) - (5,573) - (5,586)Transfers to accumulated funds - - (2,888) - (587) (3,475)Valuation loss recognised - - - - (6,414) (6,414)Balance as at 30 June <strong>2008</strong> 2,971 1,998 10,500 - - 15,469Year ended 30 June <strong>2009</strong>Transfers from accumulated funds - - 426 - - 426Balance as at 30 June <strong>2009</strong> 2,971 1,998 10,926 - - 15,895NON BLOOD HUMANITARIANSERVICESYear ended 30 June <strong>2008</strong>Balance as at 1 July 2007 2,773 2,011 - 5,771 7,001 17,556Transfers to / (from) reserves 198 - - (198) - -Transfers to specific purpose funds - (13) - (5,573) - (5,586)Transfers to accumulated funds - - - - (587) (587)Valuation loss recognised - - - - (6,414) (6,414)Balance as at 30 June <strong>2008</strong> 2,971 1,998 - - - 4,969Year ended 30 June <strong>2009</strong>Balance as at 30 June <strong>2009</strong> 2,971 1,998 - - - 4,969(i) The property reserve records capital surplus made on sale of freehold land and buildings.(ii) The asset replacement reserve records funds set aside for future asset replacement.(iii) Blood Service ‘special reserve’ records net income and expenditure relating to special activities of Blood Service, including fee-for-service activities.(iv) The general reserve records funds set aside for unspecified future aid.(v) The fair value reserve comprises the cumulative net change in the fair value of available-for-sale investments until the investment is derecognised.33
Notes to the financial statementsfor the financial year ended 30 June <strong>2009</strong>Note 17 – Specific Purpose FundsNotesTsunamiAppeal$ ‘000InternationalProjects$ ‘000DomesticPrograms$ ‘000Total$ ‘000SOCIETYYear ended 30 June <strong>2008</strong>Balance as at 1 July 2007 47,438 7,411 5,636 60,485Transfers from reserves 16 - - 5,586 5,586Transfers (to) / from accumulated funds (21,671) 15,111 7,378 818Balance as at 30 June <strong>2008</strong> 25,767 22,522 18,600 66,889Year ended 30 June <strong>2009</strong>Transfers (to) / from accumulated funds (11,531) (7,847) 1,436 (17,942)Balance as at 30 June <strong>2009</strong> 14,236 14,675 20,036 48,947NON BLOOD HUMANITARIAN SERVICESYear ended 30 June <strong>2008</strong>Balance as at 1 July 2007 47,438 7,411 5,636 60,485Transfers from reserves 16 - - 5,586 5,586Transfers (to) / from accumulated funds (21,671) 15,111 7,378 818Balance as at 30 June <strong>2008</strong> 25,767 22,522 18,600 66,889Year ended 30 June <strong>2009</strong> -Transfers (to) / from accumulated funds (11,531) (7,847) 1,436 (17,942)Balance as at 30 June <strong>2009</strong> 14,236 14,675 20,036 48,947Note 18 – Accumulated FundsNotesSOCIETY<strong>2009</strong>$’000<strong>2008</strong>$’000NON BLOODHUMANITARIANSERVICES<strong>2009</strong>$’000<strong>2008</strong>$’000Balance at beginning of financial year 163,273 166,106 92,142 107,983Deficit for the financial year (7,434) (3,441) (40,968) (15,539)Actuarial losses on defined benefitsuperannuation plans15 (8,360) (2,049) (279) (71)Transfers (to) / from specific purpose funds 17 17,942 (818) 17,942 (818)Transfers (to) / from special reserve 16 (426) 2,888 - -Transfers from fair value reserve 16 - 587 - 587Balance at end of financial year 164,995 163,273 68,837 92,14234
Notes to the financial statementsfor the financial year ended 30 June <strong>2009</strong>Note 19 – Reconciliation of Cash FlowsProvided by Operating ActivitiesSOCIETY<strong>2009</strong>$’000<strong>2008</strong>$’000NON BLOODHUMANITARIANSERVICES19(a) Reconciliation of cash and cash equivalentsCash 20,750 37,052 20,063 36,522Bank bills 61,170 34,232 - -81,920 71,284 20,063 36,522<strong>2009</strong>$’000<strong>2008</strong>$’00019(b) Reconciliation of deficit for the period to net cashflows from operating activitiesNet deficit (7,434) (3,441) (40,968) (15,539)Depreciation of non-current assets 24,947 17,495 6,179 4,693Impairment of non-current assets - 1,981 - -Impairment loss on fair value of available-for-saleinvestments3,610 1,714 3,610 1,714Impairment loss on fair value of held-to-maturity investments 2,391 2,164 2,391 2,164Net foreign currency (gains) / losses 730 (242) 150 (455)Net deficit on disposal of investments 1,781 255 1,781 255Net surplus on disposal of property, plant & equipment (540) (231) (530) (324)Interest income received and receivable (6,224) (8,083) (3,077) (4,676)Dividends received and receivable (2,228) (3,115) (2,228) (3,115)Non-monetary donations (375) - (375) -Changes in assets and liabilities:Decrease / (increase) in trade and other receivables (6,891) 7,417 (8,904) (1,246)Decrease / (increase) in inventory (10,084) 1,148 (276) (446)Increase / (decrease) in trade and other payables 6,087 18,256 2,172 4,411Increase in provisions 6,541 5,171 790 1,387(Increase) / decrease in prepayments 1,070 (700) 1,070 (700)(Gain) / loss on defined benefit funds 79 (11) (13) 11Net cash provided by / (used in) operating activities 13,460 39,778 (38,228) (11,866)35
Notes to the financial statementsfor the financial year ended 30 June <strong>2009</strong>Note 19 – Reconciliation of Cash FlowsProvided by Operating Activities (Continued)SOCIETY<strong>2009</strong>$’000<strong>2008</strong>$’000NON BLOODHUMANITARIANSERVICES19(c) Financing facilitiesSecured bank overdraft facility:amount used - - - -amount unused 3,000 1,000 3,000 1,0003,000 1,000 3,000 1,000Secured bank loan facility:amount used 18,000 - 18,000 -amount unused 11,000 - 11,000 -29,000 - 29,000 -Secured leasing facility:amount used 26,812 11,889 - -amount unused 5,188 20,111 - -32,000 32,000 - -Credit card facility:amount used 981 786 171 -amount unused 2,019 1,214 829 -3,000 2,000 1,000 -<strong>2009</strong>$’000<strong>2008</strong>$’000The Society is not in default of any loan agreements in relation to the above facilities nor is it in default of any principal or interest payments.36
Notes to the financial statementsfor the financial year ended 30 June <strong>2009</strong>Note 20 – CommitmentsSOCIETY<strong>2009</strong>$’000<strong>2008</strong>$’000NON BLOODHUMANITARIANSERVICES(a) Capital CommitmentsCommitments contracted for at balance datebut not provided for in the financial statementsare payable as follows:Not longer than 1 year 119,752 11,992 335 1,424Longer than 1 year and not longer than 5 years 99,783 - - -219,535 11,992 335 1,424<strong>2009</strong>$’000<strong>2008</strong>$’000Blood Service commitments for capital expenditure will be funded by the National Blood Authority (NBA) from the Capital Programme contained within the Deedof Agreement between Blood Service and NBA, with additional federal funding of $120 million for the development of the Victoria and Tasmania principal sites.In the unlikely event the Deed of Agreement is not renewed, any future non-cancellable commitments will be covered by the NBA.Note 21 – LeasesMinimum future leasepayments<strong>2009</strong>$’000<strong>2008</strong>$’000Present value of minimumfuture lease payments<strong>2009</strong>$’000<strong>2008</strong>$’000SOCIETYFinance lease liabilitiesNot later than 1 year 3,565 1,653 1,814 673Later than 1 year and not later than 5 years 14,210 6,295 8,475 2,974Later than 5 years 19,875 10,716 16,523 8,242Minimum future lease payments 37,650 18,664 26,812 11,889Less future finance charges (10,838) (6,775) - -Present value of minimum lease payments 26,812 11,889 26,812 11,889Included in financial statements as :Current borrowings 1,814 673Non-current borrowings 24,998 11,21626,812 11,889Blood Service leases various equipment and fit outs with a carrying value of $28m (2007: $29m) under finance leases expiring within three to ten years.Under the terms of the leases, Blood Service has the option to acquire the leased assets on expiry of the leases. These leases relate to:1) Equipment leases - Blood Service leased one DNA analyser under finance lease, which expires July <strong>2009</strong>. The carrying amount of the analysers is$0.09m (<strong>2008</strong>: $0.09m). On expiry of the leases, Blood Service will own the analyser.2) Property fit out lease at Kelvin Grove, Brisbane - The fit out of the Kelvin Grove property was completed under a finance lease of $32m with a financialinstitution. Blood Services drew down the first tranche of $16m in 2007-08 with the second tranche of $16m drawn down in <strong>2008</strong>-09.Blood Service commitments for finance leases will be funded by the National Blood Authority (NBA) from the Main Operating Programme containedwithin the Deed of Agreement between Blood Service and NBA. In the unlikely event the Deed of Agreement is not renewed, any future non-cancellablecommitments will be covered by the NBA.37
Notes to the financial statementsfor the financial year ended 30 June <strong>2009</strong>Minimum future leasepayments<strong>2009</strong>$’000<strong>2008</strong>$’000Present value of minimumfuture lease paymentsNon-cancellable operating lease commitmentsNot longer than 1 year 18,432 14,245 6,366 5,691Longer than 1 year and not longer than 5 years 65,252 29,825 8,229 8,590Longer than 5 years 197,409 40,902 2 132281,093 84,972 14,597 14,413In respect of non-cancellable operating leases thefollowing liabilities have been recognised :Non-cancellable operating lease receivablesNot longer than 1 year - 29 - 29- 29 - 29<strong>2009</strong>$’000<strong>2008</strong>$’000Blood Service commitments for non-cancellable operating leases will be funded by the National Blood Authority (NBA) from the Main Operating Programmecontained within the Deed of Agreement between Blood Service and NBA. In the unlikely event the Deed of Agreement is not renewed, any future noncancellablecommitments will be covered by the NBA.Note 22 – Contingent LiabilitiesThe potential for liabilities arising from litigation in relation to past transfusion-transmitted HIV (AIDS) is highly unlikely as aresult of the implementation of indemnity arrangements. In the unlikely event of a claim not covered by the State and Territoryarrangements, the Commonwealth, States and one Territory Government will indemnify the Society for any financial liabilityit may incur. Financial exposures after 1 July 2000 are indemnified through the National Managed Fund where they relate totransmission of blood-borne disease through transfusion subsequent to 1 July 2000.Legal proceedings have continued against the Society arising out of contraction of Hepatitis C. The Society has denied liability inthese proceedings. Financial exposure to claims for Hepatitis C up until 30 June 2000 are subject to commercial and Governmentindemnities and are dealt with under a variety of arrangements. Financial exposures arising since 1 July 2000 are indemnifiedthrough the National Managed Fund, where they relate to transmission of blood borne disease through transfusion subsequentto 1 July 2000.There is always potential for claims to arise from viral / bacterial infections or blood-borne disease which are currently unidentified,or in circumstances where there are no test or screening procedures available to test for a virus / bacteria / disease state.The National Managed Fund has been established to meet any financial exposures that may be incurred from 1 July 2000where the financial exposure arises as a result of transmission of blood-borne disease occurring subsequent to 1 July 2000.State Governments and one Territory Government provide indemnity for blood-borne disease arising through such transmissionoccurring prior to 1 July 2000.38
Notes to the financial statementsfor the financial year ended 30 June <strong>2009</strong>Note 23 – Financial InstrumentsSOCIETY<strong>2009</strong>$’000<strong>2008</strong>$’000NON BLOODHUMANITARIANSERVICES(a) Categories of Financial instrumentsFinancial assetsCash and cash equivalents 81,920 71,284 20,063 36,522Trade and other receivables 18,023 10,422 15,729 7,332Available-for-sale financial assets 21,615 36,836 21,615 36,836Held-to-maturity financial assets 23,650 28,187 23,650 28,187Financial liabilitiesTrade and other payables 60,108 54,475 17,007 15,439Interest bearing loans and borrowings 44,812 11,889 18,000 -Foreign currency contracts 435 - - -<strong>2009</strong>$’000<strong>2008</strong>$’000<strong>Australian</strong> <strong>Red</strong> <strong>Cross</strong> Society board considers the above carrying amounts of financial assets and financial liabilities to approximate their fair values.(b) Financial risk management objectives and policiesThe Society’s financial instruments consist mainly of:- deposits with banks;- investments in equities, managed funds, bonds, debentures and other fixed interest securities;- accounts receivable and payable, which arise directly from the Society’s operations;- derivatives, being forward foreign currency contracts, to manage currency risks.It is, and has been throughout the financial year, the Society’s policy that no trading in derivative financial instruments shall beundertaken. Similarly, it is not the Society’s policy to trade in investments (i.e. to speculate and engage in short-term profit taking).All investments are held to generate income to further the Society’s causes and as such are classified as ‘available-for-sale’or ‘held-to maturity’. Sales do occur however with selected investments which are described in the financial statements as‘available-for-sale’, when the Society is advised to adjust its portfolio in relation to risk exposure and diversification as advisedby its investment portfolio managers.The Chief Financial Officer is responsible for the treasury risk management. Instruments used to hedge foreign currency riskare organised through the Society’s bankers.(c) Market riskMarket risk is the risk that the fair value or future cash flows of a financial instrument will fluctuate because of changes in market prices.Market risk comprises three types of risk: market interest rates (interest rate risk), foreign exchange rates (currency risk) and marketprices (price risk).39
Notes to the financial statementsfor the financial year ended 30 June <strong>2009</strong>Note 23 – Financial Instruments (Continued)(i) Foreign currency risk managementThe Society is exposed to fluctuations in foreign currencies arising from purchase of goods and supply of aid in currencies other thanthe Society’s functional currency ($AUD).It is the Society’s policy to negotiate the terms of hedge derivatives to match the terms of the hedged items to maximise hedgeeffectiveness. Hedge cover is considered on a transaction by transaction basis.The Society accounts for these derivatives as fair value through profit and loss. While these transactions are entered into to hedgespecific contracts and are believed to be effective, the Society accounts for these derivatives as ‘fair value through profit and loss’.The carrying amount of the Society’s foreign currency denominated monetary assets and monetary liabilities at the reporting date isas follows:AssetsCashSOCIETY<strong>2009</strong>$’000<strong>2008</strong>$’000NON BLOODHUMANITARIANSERVICES<strong>2009</strong>$’000<strong>2008</strong>$’000USD 1,012 1,629 885 929Euro 1,305 - - -Swiss Franc 1,392 6,130 1,392 6,130Other 574 1,933 574 1,9334,283 9,692 2,851 8,992LiabilitiesForward exchange contractsEuro 435 - - -40
Notes to the financial statementsfor the financial year ended 30 June <strong>2009</strong>Note 23 – Financial Instruments (Continued)Foreign currency sensitivity analysisThe Society is mainly exposed to movements in exchange rates relating US dollars, EURO and Swiss Franc.The following table details the Society’s sensitivity to a 10% increase and decrease in the <strong>Australian</strong> Dollar against the relevantforeign currencies. 10% is the sensitivity rate used when reporting foreign currency risk internally to key management personneland represents management’s assessment of the possible change in foreign exchange rates. The sensitivity analysis includes onlyoutstanding foreign currency denominated monetary items and adjusts their translation at the period end for a 10% change in foreigncurrency rates. A positive number indicates an increase in profit or loss and other equity where the <strong>Australian</strong> Dollar strengthensagainst the respective currency. For a weakening of the <strong>Australian</strong> Dollar against the respective currency there would be an equaland opposite impact on the profit and other equity, and the balances below would be negative.Profit or lossSOCIETY<strong>2009</strong>$’000<strong>2008</strong>$’000NON BLOODHUMANITARIANSERVICES<strong>2009</strong>$’000<strong>2008</strong>$’000USD 101 163 89 93EURO 370 239 - -Swiss Franc 139 613 139 613Other equityUSD - - - -EURO - - - -Swiss Franc - - - -The following table details the forward foreign currency contracts outstanding as at reporting date:Average ExchangeRates Foreign Currency Contract Value Fair Value<strong>2009</strong> <strong>2008</strong> <strong>2009</strong> <strong>2008</strong> <strong>2009</strong> <strong>2008</strong> <strong>2009</strong> <strong>2008</strong>Outstanding contracts <strong>2009</strong> <strong>2008</strong> FC’000 FC’000 $’000 $’000 $’000 $’000Buy EUROMore than 1 year 0.476 - 1,140 - 2,392 - 1,957 -(ii) Interest rate risk managementThe Society is exposed to market interest rate fluctuations on its fixed and variable interest securities, as well as interest bearingborrowings. The Society accepts the risk as normal in relation to fixed interest financial assets, as they are held to generateinvestment on unused funds.Financial lease liabilities are set at fixed rates for the term of the lease and are not subject to interest rate variability. Bank loan facilitiesare based on a variable interest rate.41
Notes to the financial statementsfor the financial year ended 30 June <strong>2009</strong>Note 23 – Financial Instruments (Continued)Interest rate sensitivity analysisThe following table summarises how the Society’s surplus or deficit and equity would have been affected by changes in interestrates at reporting date.SOCIETYCarryingamount$’000- 50 basispointsSurplus /(deficit)$’000- 50 basispointsEquity$’000+ 50 basispointsSurplus /(deficit)$’000+ 50 basispointsEquityFinancial assetsCash and cash equivalents 81,920 (344) (344) 344 344Held-to-maturity investments 23,650 (200) (200) 200 200Available-for-sale investment 21,615 (75) (75) 75 75Financial LiabilitiesBank loans 18,000 24 24 (24) (24)Total increase/(decrease) (595) (595) 595 595NON BLOOD HUMANITARIAN SERVICESFinancial assetsCash and cash equivalents 20,063 (106) (106) 106 106Held-to-maturity investments 23,650 (200) (200) 200 200Available-for-sale investment 21,615 (75) (75) 75 75Financial LiabilitiesBank loans 18,000 24 24 (24) (24)Total increase/(decrease) (357) (357) 357 357Sensitivity analysis does not apply to finance leases as they are fixed for the term of the lease.$’000(iii) Price riskEquity price risk is the risk that the fair value of future cash flows of a financial instrument will fluctuate because of changes in marketprices, whether those changes are caused by factors specific to the individual financial instrument or its issuer, or factors affectingall similar financial instruments traded in the market.The Society manages the risks associated with its investments in accordance with established and approved governance guidelinesand principles set out and approved through the Board of the Society. Investments are managed at arms length by independent andfully qualified organisations under an agreed and approved mandate which stipulates, diversification criteria based on asset classesand percentages within the total investment portfolio of each approved class. In addition, part of the risk assessment criteria arebenchmarks regarding expected rates of return and ethical overlay restrictions.Equity price sensitivityThe sensitivity analysis below has been determined based on the exposure to equity price risks at year end.At reporting date, if the equity prices had been:– 5% p.a. higher / (lower), the net result for the year ended 30th June <strong>2009</strong> would have increased / (decreased) $870,000 as a resultof changes in the fair value of the available-for-sale equities.(d) Credit risk managementThe maximum exposure to credit risk, excluding the value of any collateral or other security, at balance date to recognised financialassets, is the carrying amount, net of any provisions for impairment of those assets, as disclosed in the balance sheet and notesto the financial statements.Credit risk for derivative financial instruments arises from the potential failure by counter parties to the contract to meet their obligationsThe Society does not have any material credit risk exposures to any single receivable or group of receivables under financial instruments.42
Notes to the financial statementsfor the financial year ended 30 June <strong>2009</strong>Note 23 – Financial Instruments (Continued)(e) Liquidity risk managementThe Society manages liquidity risk by monitoring forecast cash flows and ensuring that adequate liquid funds or unutilised borrowingfacilities are maintained.The following table details the Society’s remaining contractual maturity for its non-derivative financial liabilities. The table has beendrawn up based on the undiscounted cash flows of financial liabilities based on the earliest date on which the Society can berequested to pay. The table includes both interest and principal cash flows.Weightedaverageeffectiveinterest rate%Less than 1month$’0001-3 months$’0003 months to1 year$’0001 Year to 5Years$’0005 + years$’000SOCIETYYear ended 30 June <strong>2009</strong>Non-interest bearing 60,359 - - - -Finance lease liability 7.02% 388 707 2,470 14,210 19,875Bank loan liability 4.52% - - 5,000 13,000 -60,747 707 7,470 27,210 19,875Year ended 30 June <strong>2008</strong>Non-interest bearing 55,286 - - - -Finance lease liability 8.48% 143 412 1,098 6,295 10,716Bank loan liability - - - - -55,429 412 1,098 6,295 10,716NON BLOOD HUMANITARIANSERVICESYear ended 30 June <strong>2009</strong>Non-interest bearing 17,007 - - - -Finance lease liability - - - - -Bank loan liability 4.52% - - 5,000 13,000 -17,007 - 5,000 13,000 -Year ended 30 June <strong>2008</strong>Non-interest bearing 15,439 - - - -Finance lease liability - - - - -Bank loan liability - - - - -15,439 - - - -43
Notes to the financial statementsfor the financial year ended 30 June <strong>2009</strong>Note 23 – Financial Instruments (Continued)The following table details the Society’s expected maturity for its non-derivative financial assets. The table below has been drawn upbased on the undiscounted contractual maturities of the financial assets including interest that will be earned on those assets exceptwhere the Society anticipates that the cash flow will occur in a different period.Weightedaverageeffectiveinterest rate%Less than 1month$’0001-3 months$’0003 months to1 year$’0001 Year to 5Years$’0005 + years$’000SOCIETYYear ended 30 June <strong>2009</strong>Non-interest bearing 23,138 12,275 - - -Variable interest rate instruments 3.94% 25,456 - 417 23,147 -Fixed interest rate instruments 5.29% - 59,738 - 1,037 -48,594 72,013 417 24,184 -Year ended 30 June <strong>2008</strong>Non-interest bearing 34,670 5,385 - - -Variable interest rate instruments 6.55% 41,605 - 9,016 25,923 -Fixed interest rate instruments 7.76% - 29,679 - 451 -76,275 35,064 9,016 26,374 -NON BLOOD HUMANITARIAN SERVICESYear ended 30 June <strong>2009</strong>Non-interest bearing 20,844 12,275 - - -Variable interest rate instruments 3.95% 23,337 - 417 23,147 -Fixed interest rate instruments 5.68% - - - 1,037 -44,181 12,275 417 24,184 -Year ended 30 June <strong>2008</strong>Non-interest bearing 31,580 5,385 - - -Variable interest rate instruments 6.50% 36,522 - 9,016 25,923 -Fixed interest rate instruments 6.50% - - - 451 -68,102 5,385 9,016 26,374 -44
Notes to the financial statementsfor the financial year ended 30 June <strong>2009</strong>Note 24 – Events After Balance Sheet DateBlood Service has a need to relocate some of its principal facilities for processing and testing to continue to accommodatethe code of Good Manufacturing Practice (cGMP) and meet health and safety standards. The estimated costs of these relocationsare included in Commitments note 20 (a). The fit-out costs associated with these facilities are expected to be funded by commercialfinance lease arrangements, with the annual costs being included in additional future Commonwealth Government funding providedto Blood Service.(i) The New South Wales and ACT principal site (NAPS)Blood Service is preparing to amalgamate and upgrade the principal facilities currently located in Sydney, Parramatta, Newcastleand Canberra. Blood Service has issued a request for proposal to the market for development submissions and the facility isplanned to be in operation by June 2010.(ii) Victoria and Tasmania principal site (VTPS)Blood Service is in discussions with governments in relation to relocating facilities currently at its Southbank. The CommonwealthGovernment has committed $120m to assist in the purchase of an appropriate site and building.Note 25 – Economic DependencyA significant portion of revenue is received by way of recurrent grants from State and Commonwealth Governments.Note 26 – Key Management PersonnelBlood Service Board comprises paid external Board Members sourced from a diverse range of medical and business disciplines.<strong>Australian</strong> <strong>Red</strong> <strong>Cross</strong> Society Board comprises entirely of volunteers reflective of its national membership. No fees are paid for servingas a volunteer Board Member, but they may be reimbursed for reasonable travel and other expenses incurred in connection with theactivity of the Society.Board members<strong>Australian</strong> <strong>Red</strong> <strong>Cross</strong> SOCIETYBlood ServiceMr Greg Vickery AM (Chairman)The Hon Dr David Hamill (Chairman) AMMr Michael Legge (Vice Chairman) Ms Jennifer Williams (Chief Executive Officer from April <strong>2009</strong>)Mr Ross Pinney Dr Robert Hetzel (Chief Executive Officer to March <strong>2009</strong>)Mr John FriesMr Graham AddisonMr Alan Clayton Dr Marianne Broadbent (to September <strong>2008</strong>)The Hon Dr David Hamill AMMr Andrew EddyMr Ian AnsonDr Anne FletcherMs Kaye Hogan AM PSM (to November <strong>2008</strong>) Ms Kelly Jones (from June <strong>2009</strong>)Ms Pam Simmons (to November <strong>2008</strong>)Dr David GrahamMr Michael HowarthProfessor James IsbisterMs Kate Carnell AOMr Michael LeggeMr Vinay MenonMr John O’ConnorMr Devendra PatelMr James SwindenMr John HoodMs Lauren Nelson (from November <strong>2008</strong>)Mr Paul Shinkfield (from November <strong>2008</strong>)Ms Sue Vardon AO (from April <strong>2009</strong>)Ms Lowitja O’Donoghue AM CBE (July <strong>2008</strong> only)45
Notes to the financial statementsfor the financial year ended 30 June <strong>2009</strong>SOCIETY<strong>2009</strong>$’000<strong>2008</strong>$’000Board member remuneration$0 16 17Less than $10,000 2* 1$20,000 to $29,999 1 -$40,000 to $49,999 2 5$50,000 to $59,999 5 5$100,000 to $109,999 1 1$140,000 to $149,999 1 -$450,000 to $489,999 1* 1* Includes part year paymentsRemuneration figures are gross salary plus superannuationKey management personnel of the Society by divisionNon Blood Humanitarian ServicesMr Robert Tickner Chief Executive OfficerMr John O’Connor Chief Financial OfficerMr Michael Raper Director Services and International OperationsMs Jennifer Gibb National Director Marketing, Fundraisingand CommunicationsMr David Ham Director Strategy, Planning and ResearchMr Chris Steinfort Director People and LearningMs Kerry Symons Executive Director, South AustraliaMs Di Jay Executive Director, Australia’s Capital TerritoryMr Paul Csoban Executive Director, <strong>Australian</strong> Capital Territory(to January <strong>2009</strong>)Ms Sharon Mulholland Executive Director, Northern TerritoryDr Ian Burke Executive Director, TasmaniaMr Greg Goebel Executive Director, QueenslandMr Andrew Hilton Executive Director, VictoriaMr Steve Joske Executive Director, Western AustraliaMr Lewis Kaplan Executive Director, New South WalesBlood ServiceMr John Coates Chief Financial OfficerDr Joanne Pink Chief Medical OfficerMr Greg Embleton Chief Information OfficerMs Anne Heyes Executive Director, Human RelationsDr Philippa Hetzel Executive Director, OperationsMr David Irving Executive Director, Research andBusiness DevelopmentMr Joel Reachard Executive Director, Government andInternational RelationsMs Janine Wilson Executive Director, Strategic Projects(maternity leave)Dr Sally Thomas International Services ManagerExcludes Chief Executive Officer who is listed aboveunder the heading board members.46
Notes to the financial statementsfor the financial year ended 30 June <strong>2009</strong>SOCIETY<strong>2009</strong>$’000<strong>2008</strong>$’000NON BLOODHUMANITARIANSERVICES<strong>2009</strong>$’000<strong>2008</strong>$’000Other key management personnel$ 40,000 to $ 49,999 1* - 1* -$ 60,000 to $ 69,999 - 1* - 1*$130,000 to $139,999 1# 1# 1# 1#$140,000 to $149,999 3* - 2* -$150,000 to $159,999 1 - 1 -$160,000 to $169,999 - 2 - 2$170,000 to $179,999 2* - 2* -$180,000 to $189,999 2 2 2 2$190,000 to $199,999 2 1 2 1$200,000 to $209,999 - 2 - 1$210,000 to $219,999 1 1 1 1$220,000 to $229,999 1 1 - -$230,000 to $239,999 - 2 - 2$240,000 to $249,999 1 3 1 -$250,000 to $259,999 2 2 - -$270,000 to $279,999 - 1 - 1$280,000 to $289,999 3 1 - -$290,000 to $299,999 1 - 1 -$300,000 to $309,999 - 1 - -$310,000 to $319,999 1 1# 1 1#$340,000 to $349,999 1 1 - -$360,000 to $369,000 1 - - -* Includes part year payments# Includes part year and termination paymentsRemuneration figures are gross salary plus superannuation47
Notes to the financial statementsfor the financial year ended 30 June <strong>2009</strong>The compensation of key management personnel included in the income statement is as follows:Salariesand feesShort term$’000Superannuationcontributions$’000Long serviceleaveLong termSOCIETYYear ended 30 June <strong>2009</strong>Total compensation 6,142 455 1,142 7,740Year ended 30 June <strong>2008</strong>Total compensation 5,747 414 904 7,065NON BLOOD HUMANITARIAN SERVICESYear ended 30 June <strong>2009</strong>Total compensation 2,645 187 210 3,043Year ended 30 June <strong>2008</strong>Total compensation 2,419 152 157 2,728$’000Total$’000Note 27 – Auditors’ RemunerationNON BLOODSOCIETYHUMANITARIANSERVICES<strong>2009</strong>$’000<strong>2008</strong>$’000<strong>2009</strong>$’000<strong>2008</strong>$’000Auditor of <strong>Australian</strong> <strong>Red</strong> <strong>Cross</strong>Audit of the financial report 290 275 206 200Audit of acquittals in relation to specific purpose grants 89 84 89 84Other non audit services; risk services and IT consulting 91 238 66 228470 597 361 512Note 28 – Related Party Disclosures(a) Board membersThe Board Members are disclosed in note 26. Certain members of the Board are in the employment of, or may have a beneficialinterest in, professional services firms which derive income for services provided to the Society. The Society believes the termsand conditions of these transactions would be to the advantage of the Society.(b) Wholly-combined groupIn states and territories where Blood Service is located on <strong>Australian</strong> <strong>Red</strong> <strong>Cross</strong> premises, there are contractual arrangementsbetween the respective operating units of Blood Service and <strong>Australian</strong> <strong>Red</strong> <strong>Cross</strong> state / territory division for the sharing of facilitiesand outgoings. The payments to <strong>Australian</strong> <strong>Red</strong> <strong>Cross</strong> state / territory Divisions under this arrangement totalled $2.881m (<strong>2008</strong>:$2.611m). The effect of the above transactions has been eliminated in full in the financial statements and supporting notes.(c) Other related partiesDivisions actively solicit support and assistance of their volunteers and acquire goods and services from commercial enterprisesof which some members are servants or may have a beneficial interest. The Society believes that the terms and conditions ofthese transactions are favourable to the Society.48
SupplementComplying with ACFID Code of ConductThe <strong>Australian</strong> <strong>Red</strong> <strong>Cross</strong> Society is a signatory to the <strong>Australian</strong> Council for International Development (ACFID) Code of Conduct,and as such has an obligation to provide the following supplementary information which demonstrates our adherence to theCode's financial standards.The Income Statement and Table of Cash Movements for Designated Purposes provided below, represent a true reflection ofthe financial statements for this year.The information contained in this supplement should be read in conjunction with the financial statements and accompanyingnotes on pages 5 to 48.Income Statementfor the financial year ended 30 June <strong>2009</strong>(Statement of Financial Performance)SOCIETY<strong>2009</strong>$’000<strong>2008</strong>$’000REVENUEDonations and gifts - monetary & non-monetary* 401,445 44,159Legacies and bequests 13,431 11,331Grants• AusAID 17,988 24,189• other <strong>Australian</strong> 527,986 447,059• other overseas 288 847Investment income 11,750 16,013Other income 54,623 50,025Total revenue 1,027,511 593,623EXPENSESOverseas projects• funds to overseas projects 40,932 46,089• other project costs 8,574 5,882Domestic projects 903,018 472,676Community education 1,008 1,006Fundraising costs• public 15,526 16,483• government, multilateral and private 1,037 882Retail activities 32,791 29,295Administration 32,059 24,751Total expenses 1,034,945 597,064Excess of revenue over expenses (shortfall)from continuing operations(7,434) (3,441)*During the financial year nil (<strong>2008</strong>: nil) was recorded as non-monetary donations and gifts.49
SupplementComplying with ACFID Code of ConductTable of Cash Movements for Designated Purposesfor the financial year ended 30 June <strong>2009</strong>Cash availableat beginningof yearCash raisedduring yearCash disbursedduring yearCash availableat end of yearDesignated Purpose:Asia Quake and Tsunami Appeal 2,199 12,652 (14,357) 494Victorian Bushfire Appeal - 373,142 (371,964) 1,178Total for other purposes 69,085 743,294 (732,131) 80,248TOTAL 71,284 1,129,088 (1,118,452) 81,920Working capital for Asia Quake and Tsunamis Appeal is held in cash and cash equivalents and residual funds are held in financial assets.Vistorian Bushfire Appeal funds are held in cash and are transferred by <strong>Australian</strong> <strong>Red</strong> <strong>Cross</strong> Society daily into the <strong>2009</strong> Victorian BushfireAppeal Fund Trust Account maintained by the Victorian Department of Human Services (refer note 3(b)).50
Board Members’ DeclarationThe Board Members declare that:(a) in the Board’s opinion, there are reasonable grounds to believe that the Society will be able to payits debts as and when they become due and payable;(b) in the Board’s opinion, the attached financial statements and notes thereto are in compliance withaccounting standards and give a true and fair view of the financial position and performance ofthe Society; and(c) the Board has been given signed declarations by the Chief Financial Officer and the Chief Executive Officerregarding the integrity of the financial statements and that the Society’s risk management and internalcompliance and control system is operating efficiently and effectively in all material respect.Signed in accordance with a resolution of the Board.On behalf of the BoardGreg VickeryChairman of the BoardMelbourne29th October <strong>2009</strong>51
Independent Auditor’s Reportto the Members of the <strong>Australian</strong> <strong>Red</strong> <strong>Cross</strong> SocietyDeloitte Touche TohmatsuABN 74 490 121 060550 Bourke StreetMelbourne VIC 3000GPO Box 78Melbourne VIC 3001 AustraliaDX: 111Tel: +61 (03) 9671 7000Fax: +61 (03) 9671 7001www.deloitte.com.auWe have audited the accompanying financial report of the <strong>Australian</strong> <strong>Red</strong> <strong>Cross</strong> Society, which comprises thebalance sheet as at 30 June <strong>2009</strong>, and the income statement, cash flow statement, statement of recognisedincome and expense, and statement of changes in equity for the year ended on that date, a summary ofsignificant accounting policies, other explanatory notes and the Board Member’s declaration as set out onpages 5 to 51.The financial report of the <strong>Australian</strong> <strong>Red</strong> <strong>Cross</strong> Society includes for disclosure purposes the separatedisclosure of Non Blood Humanitarian Services, an operating division of the <strong>Australian</strong> <strong>Red</strong> <strong>Cross</strong> Society, asdetailed in Note 2 to the financial statements.The Responsibility of Board Members for the Financial ReportThe Board Members of the entity are responsible for the preparation and fair presentation of the financial reportin accordance with <strong>Australian</strong> Accounting Standards (including the <strong>Australian</strong> Accounting Interpretations).This responsibility also includes establishing and maintaining internal control relevant to the preparation andfair presentation of the financial report that is free from material misstatement, whether due to fraud or error;selecting and applying appropriate accounting policies; and making accounting estimates that are reasonablein the circumstances.Auditor’s ResponsibilityOur responsibility is to express an opinion on the financial report based on our audit. We conducted ouraudit in accordance with <strong>Australian</strong> Auditing Standards. These Auditing Standards require that we complywith relevant ethical requirements relating to audit engagements and plan and perform the audit to obtainreasonable assurance whether the financial report is free from material misstatement.An audit involves performing procedures to obtain audit evidence about the amounts and disclosures in thefinancial report. The procedures selected depend on the auditor’s judgement, including the assessment ofthe risks of material misstatement of the financial report, whether due to fraud or error. In making those riskassessments, the auditor considers internal control relevant to the entity’s preparation and fair presentation ofthe financial report in order to design audit procedures that are appropriate in the circumstances, but not forthe purpose of expressing an opinion on the effectiveness of the entity’s internal control. An audit also includesevaluating the appropriateness of accounting policies used and the reasonableness of accounting estimatesmade by the Board Members, as well as evaluating the overall presentation of the financial report.We believe that the audit evidence we have obtained is sufficient and appropriate to provide a basis forour audit opinion.Auditor’s Independence DeclarationIn conducting our audit, we have complied with the independence requirements of the <strong>Australian</strong> professionalaccounting bodies.Auditor’s OpinionIn our opinion, the financial report of the <strong>Australian</strong> <strong>Red</strong> <strong>Cross</strong> Society presents fairly, in all material respects,the <strong>Australian</strong> <strong>Red</strong> <strong>Cross</strong> Society’s financial position as at 30 June <strong>2009</strong>, and of its financial performance, itscash flows and its changes in equity for the year ended on that date in accordance with <strong>Australian</strong> AccountingStandards (including the <strong>Australian</strong> Accounting Interpretations).DELOITTE TOUCHE TOHMATSURachel SmithPartnerChartered AccountantsMelbourne29 October <strong>2009</strong>52Liability limited by a scheme approved under Professional Standards Legislation.Member of Deloitte Touche Tohmatsu