tribology in industry 2-2013.pdf
tribology in industry 2-2013.pdf
tribology in industry 2-2013.pdf

Create successful ePaper yourself
Turn your PDF publications into a flip-book with our unique Google optimized e-Paper software.
<strong>tribology</strong> <strong>in</strong> <strong>in</strong>dustryISSN 0354-89962VOLUME 352013.
Vol. 35, Nº 2 ( 2013)Tribology <strong>in</strong> IndustryJournal of theSerbianTribology Societywww.<strong>tribology</strong>.f<strong>in</strong>k.rsEDITOR IN CHIEF:MANAGING EDITOR:EDITORIAL BOARD:TECHNICAL EDITOR:ISSN:Published by:F<strong>in</strong>ancially supported by:M. BABI C, Faculty of Eng<strong>in</strong>eer<strong>in</strong>g, University of Kragujevac, SerbiaB. IVKOVI C, Faculty of Eng<strong>in</strong>eer<strong>in</strong>g, University of Kragujevac, SerbiaS. MITROVI C, Faculty of Eng<strong>in</strong>eer<strong>in</strong>g, University of Kragujevac, SerbiaB. BHUSHAN, The Ohio State University, Columbus, USAK.-D. BOUZAKIS, Aristotle University of Thessaloniki, Thessaloniki, GreeceM.D. BRYANT, The University of Texas at Aust<strong>in</strong>, Aust<strong>in</strong>, USAM.A. CHOWDHURY, Dhaka University of Eng<strong>in</strong>eer<strong>in</strong>g & Technology, Gazipur,BangladeshL. DELEANU, Faculty of Mechanical Eng<strong>in</strong>eer<strong>in</strong>g, Mach<strong>in</strong>e Design Department,University "Dunarea de Jos", Galati, RomaniaM. KANDEVA, Technical University of Sofia, Sofia, BulgariaG. MANIVASAGAM, VIT University, Vellore, IndiaN. MANOLOV, Technical University of Sofia, Sofia, BulgariaM. MILOSAVLJEVI C, V<strong>in</strong>ča Institute of Nuclear Sciences, Belgrade, SerbiaN. MYSHKIN, Metal-Polymer Research Institute of National Academy of Sciencesof Belarus, Gomel, BelarusS. PYTKO, AGH University of Science and Technology, Krakow, PolandA. RAC, Faculty of Mechanical Eng<strong>in</strong>eer<strong>in</strong>g, University of Belgrade, SerbiaS. SEKULI C, Faculty of Technical Sciences, University of Novi Sad, SerbiaA.I. SVIRIDENOK, The Research Center of Resources Sav<strong>in</strong>g Problems of theNational Academy of Sciences of Belarus, G rodno, BelarusA. TUDOR, University Politehnica of Bucharest, Bucharest, RomaniaA. VENCL, Faculty of Mechanical Eng<strong>in</strong>eer<strong>in</strong>g, University of Belgrade, SerbiaS. MITROVIC,Faculty of Eng<strong>in</strong>eer<strong>in</strong>g, University of Kragujevac, SerbiaM. PANTIC, Faculty of Eng<strong>in</strong>eer<strong>in</strong>g, University of Kragujevac, Serbia0354-8996 (pr<strong>in</strong>t version) ; 2217-7965 (electronic version)Tribology Center, Faculty of Eng<strong>in</strong>eer<strong>in</strong>g, University of KragujevacSestre Janjić 6, 34000 Kragujevac, SerbiaM<strong>in</strong>istry of Education, Science and Technological DevelopmentRepublic of SerbiaNemanj<strong>in</strong>a 22-26, 11000 Belgrade, SerbiaPublished quarterly
www.<strong>tribology</strong>.f<strong>in</strong>k.rsVol. 35, Nº 2 ( 2013)Tribology <strong>in</strong> IndustryContentsRESEARCHN.K. MYSHKIN, A.YA. GRIGORIEV: Roughness and Texture Concepts <strong>in</strong>Tribology .............................................................97K.D. BOUZAKIS, R. PARASKEVOPOULOU, G. KATIRTZOGLOU,S. MAKRIMALLAKIS, E. BOUZAKIS, P. CHARALAMPOUS: Prediction ofCoated Tools Performance <strong>in</strong> Mill<strong>in</strong>g Based on the Film Fatigue atDifferent Stra<strong>in</strong> Rates ...............................................A. LANZUTTI, M. LEKKA, E. MARIN, L. FEDRIZZI: Tribological Behaviorof Thermal Spray Coat<strong>in</strong>gs, Deposited by HVOF and APS Techniques,and Composite Electrodeposits Ni/SiC at Both Room Temperatureand 300 °C ...................................................A. VENCL, B. GLIGORIJEVIC, B. KATAVIC, B. NEDIC,D.DZUNIC: AbrasiveWear Resistance of the Iron- and WC-based Hardfaced Coat<strong>in</strong>gsEvaluated with Scratch Test Method ...............................J.H. HORNG, C.C. WEI, S.Y. CHERN, W.H. KAO, K.W. CHEN, Y.S. CHEN:Tribological Study of Biocompatible Hybrid Organic Molecules Filmwith Antibacterial Effect ................................... ...........C. GEORGESCU, M. BOTAN, L. DELEANU: Tribological Characterisationof PBT + Glass Bead Composites with the Help of Block-on-R<strong>in</strong>g Test ....M. GULZAR, S.A. QASIM, R.A. MUFTI:Model<strong>in</strong>g Surface RoughnessEffects on Piston Skirt EHL <strong>in</strong> Initial Eng<strong>in</strong>e Start Up Us<strong>in</strong>g High and LowViscosity Grade Oils ................................................M. BABIC, B. STOJANOVIC, S. MITROVIC, I. BOBIC, N. MILORADOVIC,M. PANTIC, D.DZUNIC: Wear Properties of A356/10SiC/1Gr HybridComposites <strong>in</strong> Lubricated Slid<strong>in</strong>g Conditions ............ ............148O.I. ABDULLAH, J. SCHLATTMANN, A.M. AL-SHABIBI: Stresses andDeformations Analysis of a Dry Friction Clutch System ...............K. K. ALANEME, T. M. ADEWALE:Influence of Rice Husk Ash – SiliconCarbide Weight Ratios on the Mechanical behaviour of Al-Mg-Si AlloyMatrix Hybrid Composites ...........................................10441134123412841344141155163
<strong>tribology</strong> <strong>in</strong> <strong>in</strong>dustryISSN 0354-8996VOLUME 332011.3
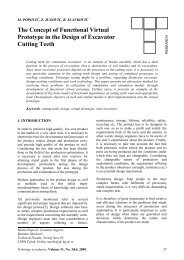
N.K. Myshk<strong>in</strong> and A.Ya. Grigoriev, Tribology <strong>in</strong> Industry Vol. 35, No. 2 (2013) 97‐103f<strong>in</strong>ite sizes, the atoms and molecules of solidsare located with<strong>in</strong> a certa<strong>in</strong> distance from eachother. If assume that the boundary of solidscorresponds to some constant potential ofatomic <strong>in</strong>teraction with the surround<strong>in</strong>g phase,it is evident that its relief has a periodic nature.Surface image with atomic resolution presentedon Fig. 1a confirms that.crystallites and can reach up to hundreds ofmicrons. Usually this type of relief is observedon the fracture surfaces of metals (Fig. 1 d).Technological roughness is a result of mechanical,thermal or any other types of material process<strong>in</strong>g.These surface deviations consist of periodical andrandom components. Formation of periodicalcomponents results from the processes of copy<strong>in</strong>gof tool cutt<strong>in</strong>g edges and roughness is affected bytechnology (Fig. 2). The appearance of the randomcomponents is associated with materialdestruction dur<strong>in</strong>g chip formation and its adhesionto cutt<strong>in</strong>g edges (build‐up), work harden<strong>in</strong>g andfatigue failure of surface layers, etc.Fig. 1. а – AFM image of pyrolytic graphite surface(amplitude of surface deviation 0.43 nm);b – deformation of gold surface structure under effectof surface forces [7] (TEM); c – surface of spiraldislocation; d – surface of steel fracture.The relief characteristics at this level are closelyrelated to surface forces and here significantquantum‐mechanical effects occurs such asthermal oscillations of atoms with amplitudes upto 10% percent of <strong>in</strong>teratomic distances andspontaneous changes <strong>in</strong> their position. Moreovervarious atomic stack<strong>in</strong>g faults <strong>in</strong> the surfacelayer produce compensat<strong>in</strong>g deformations of thelayer material (Fig. 1 b). However, from apractical po<strong>in</strong>t of view, these properties are notsignificant, at least for the present level oftribological problems.Strict periodicity of atomic roughness ischaracteristic only for ideal crystals. Real solidsare imperfect. The imperfections of atomicstructure known as dislocations form next levelof physical roughness (Fig. 1 c).Crystall<strong>in</strong>e structure of solids can form last levelof structural roughness. Unlike to previous typesof irregularities which characterized by subnanometerheights, the size of correspondedasperities is comparable to the size ofFig. 2. Mach<strong>in</strong>ed surfaces (Ra 1.6): a – cyl<strong>in</strong>dricalgr<strong>in</strong>d<strong>in</strong>g ; b – turn<strong>in</strong>g.Errors <strong>in</strong> mount<strong>in</strong>g of the parts dur<strong>in</strong>gmach<strong>in</strong><strong>in</strong>g, the presence of elastic deformationsand vibration <strong>in</strong> the mach<strong>in</strong>e‐tool system,cutt<strong>in</strong>g tool wear, and so on, leads to wav<strong>in</strong>essand deviations of form (hour‐glass<strong>in</strong>g, facet<strong>in</strong>g,barrell<strong>in</strong>g, etc.) of the real surface or the profilefrom the correspond<strong>in</strong>g parameters specified onthe basis of design. These deviations can beperiodic or stochastic.Operation roughness. Ma<strong>in</strong> reasons of surfacedegradation of mach<strong>in</strong>e parts dur<strong>in</strong>g operationare wear and corrosion. Nowadays it is generallyaccepted that mechanisms of wear andcorrosion corresponded to certa<strong>in</strong>morphological types of formed surfaces andfracture fragments (wear particles or oxides). Itis a basis of modern methods of tribomonitor<strong>in</strong>gand triboanalysis [8,9].The theoretical background of the methods isprovided by phenomenological models offriction contact damage. While us<strong>in</strong>g thesemodels the actual wear mechanism isestablished bas<strong>in</strong>g on classification of frictionsurface morphology (Fig. 3).98
N.K. Myshk<strong>in</strong> and A.Ya. Grigoriev, Tribology <strong>in</strong> Industry Vol. 35, No. 2 (2013) 97‐103concept of the surface as an ensemble ofasperities of four dimensional levels:macrodeviations, wav<strong>in</strong>ess, roughness, andsubroughness (Fig. 4) [12].Fig. 3. Surface damage at friction: a – abrasion wear;b – plastic deformation; c – plough<strong>in</strong>g and adhesivefracture; d – fatigue wear.Thus, the delam<strong>in</strong>ation of th<strong>in</strong> material layersand the formation of exfoliation and spall<strong>in</strong>gregions are related to fatigue wear at cyclicelastic contact. It is followed by the separationof material debris which po<strong>in</strong>ts to plasticdeformation of the surface layer at excessiveload<strong>in</strong>g and lubricant film tear<strong>in</strong>g. Theappearance l<strong>in</strong>ear relief of asperities with sharpedges <strong>in</strong>dicates abrasive wear. Defects shaped asdeep tear‐outs, delam<strong>in</strong>ated th<strong>in</strong> films po<strong>in</strong>t toadhesive and cohesive <strong>in</strong>teraction of the contactsurfaces. Thus, analysis of wear debris andfriction surfaces allows for evaluation of theoperat<strong>in</strong>g conditions of tribosystem, condition oflubricant, and provides the opportunity topredict failure of the tribosystem and takemeasures to prevent it [10].3. SCALE STRUCTURE OF ROUGH LAYERAs it can be seen the heights of the surfaceasperities lie <strong>in</strong> a wide range. On lower side theyare limited by the dimensions of the atomic andsupermolecular formations, on the upper one bymaximal heights which are proportional to thelength of the exam<strong>in</strong>ed profile [11].It is evident that <strong>in</strong> this case there are nolimitations on the existence of asperities <strong>in</strong>various dimensional ranges (both spac<strong>in</strong>g‐wiseand height‐wise). However, <strong>in</strong> spite of the factthat there is no universally substantiatedcriterion for dist<strong>in</strong>guish<strong>in</strong>g asperities on thebasis of scale, at the present time there exists theFig. 4. Diagram of the height and spac<strong>in</strong>g parametersof surface asperities.4. SURFACE MEASUREMENTIn study<strong>in</strong>g the topography the need arises forthe solution of three basic problems: descriptionof the surface, development of representativesurface evaluation systems and technicalrealization of the measurement processes. Inspite of the fact that these problems are<strong>in</strong>terdependent, the last problem is of specialimportance, s<strong>in</strong>ce our theoretical concepts, andtherefore our understand<strong>in</strong>g of how anyparticular phenomena may take place on thesurface, are based on the quantitative estimates.Therefore it is evident that roughnessmeasurements are of primary importance <strong>in</strong>study<strong>in</strong>g the topography. Nowadays a greatnumber of experimental methods of surfacemeasurement are used. Stylus methods rema<strong>in</strong>the most widespread; they yield results form<strong>in</strong>gthe basis for current standards. Optical methods<strong>in</strong>volv<strong>in</strong>g electromagnetic radiation such as lightsection, shadow projection, <strong>in</strong>terferencetechniques etc. have become widely applied.Atomic‐force microscopy has found a widespread <strong>in</strong> surface metrology now. Figure 5represents some capabilities of differentmethods of roughness measurement and theirvertical and lateral resolution. As can be seenthere is no method for measur<strong>in</strong>g full range ofasperities deviations.99
N.K. Myshk<strong>in</strong> and A.Ya. Grigoriev, Tribology <strong>in</strong> Industry Vol. 35, No. 2 (2013) 97‐103(obta<strong>in</strong>ed on a scann<strong>in</strong>g electron microscope(SEM)) of surfaces hav<strong>in</strong>g different spatialstructure. Table 1 present the results of acomprehensive study of their microgeometry.Fig. 5. Resolution of various methods of roughnessmeasurement.Fig. 6. Two types of surface textures.Table 1. Roughness parameters of surfaces on Figure 6.RoghnessparameterSample on Figure 5abRa 3.20.5 2.30.3Rz 19.34.2 15.92.0Rmax 15.03.7 12.21.4S 56.718.6 43.27.6Sm 165.9 4.4 117.78.7The forego<strong>in</strong>g concepts form the basis of therepresentation of a surface <strong>in</strong> such discipl<strong>in</strong>es asmechanical eng<strong>in</strong>eer<strong>in</strong>g, mach<strong>in</strong>e design,technology, <strong>tribology</strong>, heattransfer, and so on.On the whole <strong>in</strong> this representation the surfaceis exam<strong>in</strong>ed as the realization of a random field,the characteristics of which are evaluated on thebasis of two‐dimensional profilogram samples[12]. In this case the system of topographyestimates is based on analysis of the histogramcharacteristics of the asperities <strong>in</strong> some range oftheir values.A characteristic feature of this approach is thefact that the mutual <strong>in</strong>fluence and<strong>in</strong>terrelationship of the asperities are generallyignored (except for the fact that the surfacesmay be classified as isotropic or anisotropic), i.e.,the spatial organization of the asperities is nottaken <strong>in</strong>to account. We can illustrate theambiguity aris<strong>in</strong>g <strong>in</strong> the surface representations<strong>in</strong> this case. Figure 6 a, b shows photographsIt can be seen that <strong>in</strong> spite of the significantdifference between the studied objectspractically all the quantitative estimatesco<strong>in</strong>cide <strong>in</strong> the limits of the measurement errors.It is impossible to determ<strong>in</strong>e criteria on the basisof which we can judge the difference betweenthese surfaces.The pr<strong>in</strong>cipal reasons why it is not possible toevaluate the topographic properties of surfacessolely with the aid of histogram estimates werediscussed <strong>in</strong> [14,15]. Specifically, it was shownthat on the basis of these characteristics wecannot construct a satisfactory prognosticmodel, s<strong>in</strong>ce <strong>in</strong> the f<strong>in</strong>al analysis it is valid only<strong>in</strong> the limits of those values that were used forits construction. The use of this model may leadto unexpected results. For example, accord<strong>in</strong>g tothe authors of [15], by superpos<strong>in</strong>g theparameters we can achieve a good description ofpractically any phenomenon, <strong>in</strong>clud<strong>in</strong>g those notrelat<strong>in</strong>g to the exam<strong>in</strong>ed object. Consider<strong>in</strong>g thatthe modern <strong>in</strong>struments yield about fiftydifferent characteristics (<strong>in</strong>clud<strong>in</strong>g 3D) that maybe subsequently used, the drawbacks of thisapproach become still more evident [6]For more correct representation of the surface itis necessary to have the possibility ofcharacteriz<strong>in</strong>g it as an object, hav<strong>in</strong>g a def<strong>in</strong>itetopology. In <strong>tribology</strong> this approach isformalized by concept of texture [16,17].5. CONCEPT OF TEXTURESurface texture is rather difficult to def<strong>in</strong>e. Mostauthors agree that this notion reflects thefeatures of the surface relief caused by the twolevelmodel of spatial relations of irregularitiesheights [18,19]. The mode of these relations atthe local level governs the shape of irregularitiesand at the global level, the position ofirregularities relatively to each other. To someextent, the concept of texture unites the ideas oftreatment direction and irregularity directionaccord<strong>in</strong>g to the USSR Standards GOST 2789–73and 9378–93. The texture is outl<strong>in</strong>edqualitatively by several adjectives characteriz<strong>in</strong>g100
N.K. Myshk<strong>in</strong> and A.Ya. Grigoriev, Tribology <strong>in</strong> Industry Vol. 35, No. 2 (2013) 97‐103the shape and mutual position of irregularities,such as stepwise l<strong>in</strong>ear, facet random, spherical,spherical radial, etc.There are numerous approaches to the descriptionof texture; however, all of them are reduced to oneof the follow<strong>in</strong>g: comparative and parametricalapproach, usage of <strong>in</strong>variant presentations, andparameterization of visual content.Comparative methods are based on expert visualevaluation of the similarity of the object under<strong>in</strong>vestigation and the reference. The features ofman’s vision allow him to notice and identifym<strong>in</strong>ute dist<strong>in</strong>ctions <strong>in</strong> roughness, texture, color,and shape of objects. The simplicity ofcomparative methods and the fact that theyprovide sufficient accuracy for most applicationsencouraged their widespread use. Thus, forqualitative evaluation of roughness, samplereference surfaces are used accord<strong>in</strong>g to GOST9378–93 (Fig. 2).Comparative methods are very simple and <strong>in</strong>most cases a set of references and an opticalmicroscope are sufficient to realize them. Theirdisadvantages are the subjective and qualitativenature of the estimates obta<strong>in</strong>ed. To overcomethem, the op<strong>in</strong>ions and agreement of multipleexperts are used [20].Parametric methods use different statistics ofsurface asperity heights and spac<strong>in</strong>g, brightness,and color characteristics of their images.In order to evaluate texture properties,roughness parameters are most often used, e.g.,accord<strong>in</strong>g to GOST 25142–82. S<strong>in</strong>ce 2007, theISO 25178 standard has been used to describe3D surface properties. However, they are ma<strong>in</strong>lysimilar to standard profile estimates and hence<strong>in</strong>herit all their shortcom<strong>in</strong>gs [6,15].The advantages of the parametric approach are<strong>in</strong> the simple <strong>in</strong>terpretation of the respectiveestimates, while their weak descriptive abilitycan be considered a shortcom<strong>in</strong>g. Nevertheless,when a great number of similar characteristicsare used, the approach is capable to solve theproblems with accuracy sufficient for mostpractical applications.The essence of <strong>in</strong>variant representation is theapplication of normalized description methods, i.e.,the representation of analysis objects <strong>in</strong> a form<strong>in</strong>dependent of their scale and coord<strong>in</strong>ate orig<strong>in</strong>.The simplest procedure of <strong>in</strong>variantrepresentation is based on the Fouriertransform of surface heights [21]. Withrespective normalization, the coefficients of theamplitude spectrum (Fourier descriptors) do notdepend on the scale and position and can beconsidered as a complete (s<strong>in</strong>gle‐valued andreversible) system of features. More complicatedmethods use fractal compression of images andwavelet transforms [22,23].Features are not def<strong>in</strong>ed <strong>in</strong> the given approachat all. It is believed that all elements ofnormalized representations are features. It is ofno significance that they can be numerous anddo not have visual <strong>in</strong>terpretation. It is assumedthat they are analysed and classified bycomputer methods; therefore, the size of thefeature vector is not important. The approach isunsuitable for research because of the absenceof any visual and geometric <strong>in</strong>terpretation.Parameterization of visual content is based onthe assumption that representative descriptionof texture is the only possible by means ofestimates reflect<strong>in</strong>g the visual content of theobjects under <strong>in</strong>vestigation.Realization of the approach is based on the<strong>in</strong>troduction of a structural element, i.e., them<strong>in</strong>imal visually perceived region of the objectunder analysis. It is believed that the features ofdislocation of structural elements relative toeach other govern local morphologicalproperties at small distances, and global ones atlarge distances. Differences <strong>in</strong> the choice ofstructural element type and description of theirmutual position are responsible for the varietyof the methods for realiz<strong>in</strong>g the given approach.One of the methods is based on the use of cooccurrencematrices (COM) [16,17]. The use ofCOM is motivated by the known assumption thatthe second order probabilities of featuresderived from the images reflect their visualcontent [24].In order to describe the texture by the givenmethod, a surface region is chosen as astructural element whose position ischaracterized by the direction of gradient G i and101
N.K. Myshk<strong>in</strong> and A.Ya. Grigoriev, Tribology <strong>in</strong> Industry Vol. 35, No. 2 (2013) 97‐103distance P i from the coord<strong>in</strong>ate center (Fig. 7 a).The mutual position of two structural elementsis specified by the distance between them ρ andthe difference <strong>in</strong>variant description based onCOM (Fig. 7 b), the number of pairs of structuralelements is counted with certa<strong>in</strong> ρ and g be<strong>in</strong>gpresent at the surface area under analysis. Bothheight‐coded and half‐tone images can be usedtaken by various microscopy methods arrangedas upside lighten<strong>in</strong>g.morphology and classification much easier.However, its realization is rather complicated.Prospects <strong>in</strong> development of texture analysisand applications look very promis<strong>in</strong>g. Theanalytical and computational tools <strong>in</strong> textureanalysis are progress<strong>in</strong>g quickly [27]. Theprogress <strong>in</strong> technology results <strong>in</strong> a possibility touse a variety of methods for mak<strong>in</strong>g regulartextures and micro‐textures e.g. by laser [28] orpattern<strong>in</strong>g with rigid asperities [29]. Thesetechnological advances can br<strong>in</strong>g a lot of fruitfulapplications <strong>in</strong> many areas of <strong>tribology</strong>.6. CONCLUSIONSFig. 7. Parameterization of visual contents of texture:a – scheme of determ<strong>in</strong>ation of structure element; b –matrix of co‐occurrence of texture elements.With respective normalization, COM does notdepend on scale and object position <strong>in</strong> the field ofview. As with <strong>in</strong>variant presentations, each of theCOM elements can be considered as a feature.However, s<strong>in</strong>ce COM elements def<strong>in</strong>e the areas ofthe surface, and then the possibility arises of nonparametriccomparison of objects withvisualization of their similarity or dissimilarity [25,26]. The technique <strong>in</strong>volves mark<strong>in</strong>g the areaswhose COM elements have either close oressentially different values on the images of thecompared objects. In the former case, this allowsfor visualiz<strong>in</strong>g the similarity of the objects, and <strong>in</strong>the latter their dist<strong>in</strong>ction. Figure 8 shows theresults of the solutions of this problem.Fig. 8. The visual match<strong>in</strong>g of surface texturedifferences: a, b – surface of two types of hard drivemagnetic media; d – difference of the surface a from b(presence of “kidney‐like” structures).The advantage of the approach consists <strong>in</strong> itsgeneral nature, allow<strong>in</strong>g us to unite the featuresof texture of objects. This makes analysis of theirSurface 3D organization can be described bydef<strong>in</strong>ition of texture. Experience of imagerecognition theory can provide methods forrough surface texture description andvisualization of texture similarity/dissimilarity.The description of a surface texture by specialtype of COM is <strong>in</strong> a good agreement with thetexture dist<strong>in</strong>ctions obta<strong>in</strong>ed by expert visualperception. Texture analysis can be efficientlyapplied for solv<strong>in</strong>g practical tribologicalproblems <strong>in</strong> micro/nanoscale.REFERENCES[1] N.K. Myshk<strong>in</strong>, C.K. Kim, M.I Petrokovets:Introduction to Tribology, Cheong Moon Gak, 1997.[2] Micro/Nano Tribology, Ed. By B. Bhushan, CRCPress, 1998.[3] G.W. Stachowiak: Eng<strong>in</strong>eer<strong>in</strong>g Tribology.Butterworth‐He<strong>in</strong>emann, 2005.[4] I.V. Dun<strong>in</strong>‐Barkovskii and A.N. Kartashova:Measurement and Analysis of Surface Roughness,Wav<strong>in</strong>ess, and Noncircularity [<strong>in</strong> Russian],Moscow, 1978.[5] T.R. Thomas: Rough Surfaces, Imperial CollegePress, London, 1999.[6] D. Whitehouse: Surface and Their Meausrement,Kogan Page Science, 2004.[7] M. Pruton: Surface Physics, Clarendon: Oxford,1985.[8] B.J. Roylance, R. Dwyer‐Joyce: Wear debris andassociated wear phenomena – fundamentalresearch and practice, Proc. Inst. Mech. Eng. PartJJ Eng. Tribology, No. 214, pp. 79‐105, 2000.102
N.K. Myshk<strong>in</strong> and A.Ya. Grigoriev, Tribology <strong>in</strong> Industry Vol. 35, No. 2 (2013) 97‐103[9] N.K. Myshk<strong>in</strong>, A.Ya. Grigoriev: Morphology:Texture, Shape and Color of Friction Surfaces andWear Debris, Journal of Friction and Wear, Vol.29, No. 3, pp. 192‐199, 2008.[10] D.W. Anderson: Wear particle atlas, ReportNAEC‐92‐163.[11] R.S. Sayles, T.R. Thomas: Surface Topography asa Non‐Stationary Random Process, Nature, Vol.271, pp. 431–434, 1978.[12] N.B. Demk<strong>in</strong> and E.V. Ryzhov: Surface Qualityand Contact of Mach<strong>in</strong>e Parts [<strong>in</strong> Russian],Moscow, 1981.[13] A.P. Khusu, Yu.R. Vitenberg, and V.A. Pal'mov:Surface Roughness (Theoretical‐ProbabilisticApproach) [<strong>in</strong> Russian], Moscow, 1975.[14] A.Ya. Grigoriev, N.K. Myshk<strong>in</strong>, O.V. Kholodilov:Surface Microgeometry Analysis Methods, SovietJournal of Friction and Wear, Vol. 10, No. 1, pp.138‐155, 1989.[15] M. Zecch<strong>in</strong>o: Characterization surface quality:why average roughness is not enough, AP. Notesof Iveco Instrument, December, pp. 24–30, 2003.[16] A.Ya. Grigoriev, S.A. Chizhik, N.K. Myshk<strong>in</strong>: Textureclassification of eng<strong>in</strong>eer<strong>in</strong>g surfaces with nanoscaleroughnes, Int. J. of Mach<strong>in</strong>e Tools and Manufacture,Vol. 38, No. 5–6, pp. 719–724, 1998.[17] N. K. Myshk<strong>in</strong>, A. Ya. Grigoriev: Spatialcharacterization of eng<strong>in</strong>eer<strong>in</strong>g surface, <strong>in</strong> Proc.of 3rd International Conference on SurfaceEng<strong>in</strong>eer<strong>in</strong>g, Chengdu, Ch<strong>in</strong>a, pp. 54–61, 2002[18] R.M. Haralick: Statistical and structuralapproaches to texture, Proceed<strong>in</strong>gs IEEE, Vol. 67,No. 5, pp. 786–804, 1979.[19] M. Sonka, V. Hlavac, R. Boyle: Image process<strong>in</strong>g,analysis and mach<strong>in</strong>e, Boston: PWS publish<strong>in</strong>g,1999.[20] A.Ya. Grigoriev, R. Chang, E.S. Yoon, H. Kong:Classification of Wear Particles by SemanticFeatures, Journal of Friction and Wear, Vol. 20,No. 2 pp. 42‐48, 1999.[21] Z. Peng, T.B. Kirk: Two‐Dimensional Fast FourierTransform and Power Spectrum for Wear ParticleAnalysis, Tribology Int, Vol. 30, No. 8, pp. 583‐590, 1997.[22] T.B. Kirk, G.W. Stachowiak, A.W. Batchelor:Fractal Parameters and Computer Image AnalysisApplied to Wear Particles Isolated byFerrography, Wear, Vol. 145, pp. 347‐365, 1991.[23] S.‐H. Lee, H. Zahouani, R. Cater<strong>in</strong>i, T.G. Mathia:Morphological characterization of eng<strong>in</strong>eeredsurfaces by wavelet transform, <strong>in</strong> Proc. of 7 th Int.Conf. on Metrology and Properties of Eng.Surfaces, Goteborg, pp. 182‐190, 1997.[24] H. Tamura, S. Mori, T. Yamawaki: Texturefeatures correspond<strong>in</strong>g to visual perception, IEEETrans. SMC‐8, Vol. 8, pp. 460–473, 1978.[25] N.K. Myshk<strong>in</strong>, A.Ya. Grigoriev, S.A. Chizhik, K.Y.Choi, M.I.: Surface Roughness and TextureAnalysis <strong>in</strong> Microscale, Wear, Vol. 254, pp. 1001‐1009, 2003.[26] P. Podsiadlo, G.W. Stachowiak: Development ofadvanced quantitative analysis methods for wearparticle characterization and classification to aidtribological diagnosis, Tribology International,Vol. 38, pp. 887‐892, 2005.[27] P.Podsiadlo, G.W.Stachowiak: DirectionalMultiscale Analysis and Optimization for SurfaceTextures, Tribology Letters, Vol. 49, pp. 179‐191,2013.[28] I. Etsion, State of the Art <strong>in</strong> Laser SurfaceTextur<strong>in</strong>g, ASME J. Tribology, Vol. 127, pp. 248‐253, 2005.[29] D.T. Nguen et al.: Friction of Rubber with SrfacesPatterned with Rigid Spherical Asperities,Tribology Letters, Vol. 49, pp. 135‐144, 2013.103
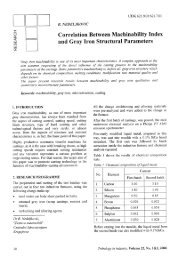
Vol. 35, No. 2 (2013) 104‐112Tribology <strong>in</strong> Industrywww.<strong>tribology</strong>.f<strong>in</strong>k.rsRESEARCHPrediction of Coated Tools Performance <strong>in</strong> Mill<strong>in</strong>gBased on the Film Fatigue at Different Stra<strong>in</strong> RatesK.D. Bouzakis a,b , R. Paraskevopoulou a , G. Katirtzoglou a,b , S. Makrimallakis a,b , E. Bouzakis a,b ,P. Charalampous aa Laboratory for Mach<strong>in</strong>e Tools and Manufactur<strong>in</strong>g Eng<strong>in</strong>eer<strong>in</strong>g, Aristoteles University of Thessaloniki, Thessaloniki, Greece,b Fraunhofer Project Center Coat<strong>in</strong>gs <strong>in</strong> Manufactur<strong>in</strong>g, <strong>in</strong> Centre for Research and Technology Hellas <strong>in</strong>Thessaloniki, Greece and <strong>in</strong> Fraunhofer Institute for Production Technology <strong>in</strong> Aachen, Germany.Keywords:Mill<strong>in</strong>gTool wearEntry impact durationCorrespond<strong>in</strong>g author:K.D. BouzakisLaboratory for Mach<strong>in</strong>e Tools andManufactur<strong>in</strong>g Eng<strong>in</strong>eer<strong>in</strong>g,Aristoteles University of Thessaloniki,Thessaloniki, Greece E‐mail:bouzakis@eng.auth.grA B S T R A C TThe knowledge of coated tool wear mechanisms <strong>in</strong> mill<strong>in</strong>g is pivotal forexpla<strong>in</strong><strong>in</strong>g the film failure and select<strong>in</strong>g the appropriate cutt<strong>in</strong>g strategyand conditions. In this paper, tool wear experiments were carried out <strong>in</strong>mill<strong>in</strong>g of four different steels us<strong>in</strong>g coated cemented carbide <strong>in</strong>serts. Thevariable stress, stra<strong>in</strong> and stra<strong>in</strong> rate fields developed <strong>in</strong> the tool dur<strong>in</strong>gcutt<strong>in</strong>g affect the film‐substrate deformations and <strong>in</strong> this way theresult<strong>in</strong>g coat<strong>in</strong>gs loads and its fatigue failure. For <strong>in</strong>vestigat<strong>in</strong>g the<strong>in</strong>fluence of cyclic impact loads magnitude and duration on the films’fatigue of coated specimens, an impact tester was employed whichfacilitates the modulation of the force signal. The atta<strong>in</strong>ed tool life up tothe films’ fatigue failure was associated to a critical force for the filmfatigue endurance and to the cutt<strong>in</strong>g edge entry impact duration. Thesefactors converge sufficiently to the tool life <strong>in</strong> all exam<strong>in</strong>ed mill<strong>in</strong>gk<strong>in</strong>ematics and workpiece material cases.© 2013 Published by Faculty of Eng<strong>in</strong>eer<strong>in</strong>g1. INTRODUCTIONMill<strong>in</strong>g operations are often associated withcomplicated cutt<strong>in</strong>g edge‐workpiece contact and<strong>in</strong>tensive tool impact loads. These facts renderthe prediction of the tool wear development adifficult to be achieved task [1,2]. Recent<strong>in</strong>vestigations with coated cemented carbide<strong>in</strong>serts revealed that the mill<strong>in</strong>g up or downk<strong>in</strong>ematic, as well as the cutt<strong>in</strong>g parameters,significantly affect the stress field developed <strong>in</strong>the cutt<strong>in</strong>g edge dur<strong>in</strong>g the material removal andconsequently the cutt<strong>in</strong>g performance [3,4].The present paper <strong>in</strong>troduces a method forcalculat<strong>in</strong>g the coated tool wear evolution <strong>in</strong>mill<strong>in</strong>g. In such cutt<strong>in</strong>g procedures, repetitiveimpact loads with variable duration andmagnitudes are exerted on the coated cutt<strong>in</strong>gedge, caused by the <strong>in</strong>terrupted materialremoval. Hence, it was necessary to quantify theeffect of the cutt<strong>in</strong>g edge entry impact durationon the coated tool fatigue failure at variouscutt<strong>in</strong>g loads. This was enabled by a developedimpact tester, facilitat<strong>in</strong>g the applied impactforce modulation [5].104
K.D. Bouzakis at al., Tribology <strong>in</strong> Industry Vol. 35, No. 2 (2013) 104‐1122. EXPERIMENTAL DETAILSIn the conducted <strong>in</strong>vestigations, peripheral andface mill<strong>in</strong>g experiments were conducted by a 3‐axis numerically controlled mill<strong>in</strong>g centerapply<strong>in</strong>g mill<strong>in</strong>g cutters of 17, 35, 57 and 90 mmeffective diameters. The geometry of the cuttersand the employed cutt<strong>in</strong>g <strong>in</strong>serts is exhibited <strong>in</strong>Fig. 1. The cemented carbide <strong>in</strong>serts are coated bya TiAlN PVD film of ca. 3 μm thickness.The chamfer of ca. 280 μm and edge radius 20μm respectively (see Fig. 1) contribute to cutt<strong>in</strong>gedge stabilization especially at elevated dynamicloads. This may lead to an effective avoidance ofcutt<strong>in</strong>g edge micro breakages, especially whenthe chip formation is not stable, as for exampleat the cutt<strong>in</strong>g edge entry <strong>in</strong>to the workpiecematerial dur<strong>in</strong>g up mill<strong>in</strong>g [3].The specifications of the applied workpiecematerial are displayed <strong>in</strong> Fig. 2. Four differentsteels were used; the hardened steel IMPAX, thesta<strong>in</strong>less steel 304 L and the hardened steelsNIMAX and 42CrMo4.Fig. 1. The employed mill<strong>in</strong>g cutters.Fig. 3. The employed coat<strong>in</strong>gs and substrate properties.The mechanical properties of the applied coat<strong>in</strong>gand substrate materials were detected bynano<strong>in</strong>dentations and a FEM‐based algorithm,facilitat<strong>in</strong>g the determ<strong>in</strong>ation of related stressstra<strong>in</strong>curves [6]. The elastoplastic film materiallaws are demonstrated <strong>in</strong> Fig. 3.Fig. 2. The employed workpiece material properties.For render<strong>in</strong>g possible the modulation of theimpact force characteristics such as of105
K.D. Bouzakis at al., Tribology <strong>in</strong> Industry Vol. 35, No. 2 (2013) 104‐112frequency, impact duration and force signalpattern, an impact tester has been employed, <strong>in</strong>which a piezoelectric actuator is applied for theforce generation [5]. By this device, the fatiguebehaviour of th<strong>in</strong> hard coat<strong>in</strong>gs at differentimpact force patterns amplitudes and durationscan be <strong>in</strong>vestigated.3. IMPACT FORCE AMPLITUDE ANDDURATION EFFECT ON COATINGS’FATIGUE FAILUREFor detect<strong>in</strong>g the effect of the cutt<strong>in</strong>g edge entryimpact duration on the film fatigue failure,impact tests at forces of various durations andamplitudes were carried out on the used coated<strong>in</strong>serts (see Fig. 4a).Fig. 4. a) Triangular and trapezoidal impact forcesignals b) Effect of impact signal and entry impactdurations on the critical force amplitude.All applied triangular force signals withdurations (FSD) of 10 ms, 20 ms and 35 ms andthe trapezoidal ones of 20 ms and 40 ms, whichare presented at the upper Figure 4a part, had aconstant signal growth time t e of 5 ms (entryimpact duration t e ). In contrast, the displayedforce signals at the bottom of Fig. 4a possessdifferent entry impact durations t e from about0.5 ms up to 15 ms. These force signals arecreated by the piezoelectric actuator andmeasured by the piezoelectric force transducer.The effect of the force pattern on the criticalforce amplitude, which <strong>in</strong>duces coat<strong>in</strong>g fatiguefailure after one million impacts, is monitored <strong>in</strong>Fig. 4b. Accord<strong>in</strong>g to these results, the criticalfatigue force amplitude rema<strong>in</strong>s practically<strong>in</strong>variable versus the force signal duration atconstant t e . On the other hand, t e affectssignificantly the film fatigue behaviour, as it isexhibited <strong>in</strong> the same diagram. An <strong>in</strong>crease ofthe impact entry duration t e from 0.05 ms up to15 ms results <strong>in</strong> a significant critical fatigueimpact force amplitude augmentation fromabout 60 daN up to 220 daN respectively. Thecutt<strong>in</strong>g load signal, i.e. the stress course versusthe cutt<strong>in</strong>g length, when a chamfered cutt<strong>in</strong>gedge is used, resembles to a triangular forcesignal at entry impact duration of 3.6 ms [3].Moreover, the stress course on a cutt<strong>in</strong>g edgewithout chamfer and smaller radius, versus thecutt<strong>in</strong>g length corresponds to a trapezoidal forcepattern at significantly lower entry impactduration of 0.036 ms.Consider<strong>in</strong>g these facts and the results exhibited<strong>in</strong> Fig. 4b, the chamfered coated cutt<strong>in</strong>g edgescan withstand to fatigue failure approximately atwo and half times higher entry impact forceamplitude. In this way, at the same stress level,the film failure of a chamfered cutt<strong>in</strong>g edge mayappear <strong>in</strong> up mill<strong>in</strong>g after a longer cutt<strong>in</strong>g timecompared to an <strong>in</strong>sert without chamfer. Thetemperature developed close to the transientregion of the cutt<strong>in</strong>g edge between flank andrake amounts to about 200 o C at a cutt<strong>in</strong>g speedof 200 m/m<strong>in</strong> and chip tool contact time up toroughly 15 ms [4]. Thus, <strong>in</strong> this cutt<strong>in</strong>g edgeregion, the crystall<strong>in</strong>e structure of the<strong>in</strong>vestigated TiAlN film rema<strong>in</strong>s stable, nodiffusion or oxidation takes place and the filmfatigue, which can be <strong>in</strong>vestigated by the impacttest, is the prevail<strong>in</strong>g factor.4. FLANK WEAR DEVELOPMENT VERSUS THECUTTING EDGE ENTRY IMPACT DURATIONThe contact conditions at the tool entry <strong>in</strong>to thematerial <strong>in</strong> mill<strong>in</strong>g are pivotal for the tool wear[1,2,4,7,8]. The impact load on the cutt<strong>in</strong>g edge106
K.D. Bouzakis at al., Tribology <strong>in</strong> Industry Vol. 35, No. 2 (2013) 104‐112at the tool entrance <strong>in</strong>to the workpiece materialdepends on the mill<strong>in</strong>g k<strong>in</strong>ematic (up or down,peripheral or face), s<strong>in</strong>ce these factors affect thedeveloped chip geometry and thus the stressfields of the coat<strong>in</strong>g versus the tool rotation. Theentry impact duration corresponds to the cutt<strong>in</strong>gtime, up to the development of the maximumequivalent stress <strong>in</strong> the coat<strong>in</strong>g.mill<strong>in</strong>g of different undeformed chip lengths.Further examples <strong>in</strong> mill<strong>in</strong>g at various conditions,k<strong>in</strong>ematics and materials are presented <strong>in</strong>[3,9,10,11]. As it can be observed <strong>in</strong> Fig. 5a, at anundeformed chip length of roughly 80 mm, asimilar tool wear evolution <strong>in</strong> up and down, faceor peripheral mill<strong>in</strong>g develops, lead<strong>in</strong>g to almostthe same accumulative tool life.Moreover, as it is demonstrated <strong>in</strong> Fig. 5b, whenup mill<strong>in</strong>g is applied, the flank weardevelopment is less <strong>in</strong>tense compared to downperipheral or face mill<strong>in</strong>g at a chip length ofabout 40 mm. The atta<strong>in</strong>ed accumulative tool life<strong>in</strong> up mill<strong>in</strong>g is approximately three times highercompared to those ones <strong>in</strong> down mill<strong>in</strong>g. Thisbehaviour can be expla<strong>in</strong>ed, based on thedeveloped cutt<strong>in</strong>g edge entry impact duration <strong>in</strong>the previously described cases.To highlight this effect, <strong>in</strong> Fig. 6, the obta<strong>in</strong>edaccumulative tool life <strong>in</strong> the <strong>in</strong>vestigatedperipheral and face mill<strong>in</strong>g cases is displayedversus the cutt<strong>in</strong>g edge entry impact duration t e .The curve <strong>in</strong> this chart describes the effect of thecutt<strong>in</strong>g entry impact duration on theaccumulated tool life. The relevant results wereobta<strong>in</strong>ed <strong>in</strong> mill<strong>in</strong>g, at various tool geometries,cutt<strong>in</strong>g k<strong>in</strong>ematics and conditions [3,9,10,11].Fig. 5. Flank wear land width versus number of cuts<strong>in</strong> various cases of face and peripheral mill<strong>in</strong>g.For describ<strong>in</strong>g the effect of the entry impactduration on the tool wear <strong>in</strong> mill<strong>in</strong>g with coatedtools, the accumulated tool life is <strong>in</strong>troduced.The latter parameter refers to a flank wear landwidth VB of 0.15 mm. This parameter can becalculated consider<strong>in</strong>g the undeformed chiplength l cu , the cutt<strong>in</strong>g speed v and the atta<strong>in</strong>ednumber of cuts NC 0.15 up to the same VBaccord<strong>in</strong>g to the equation shown <strong>in</strong> the upperpart of Fig. 5a. In Fig. 5a and 5b characteristicexamples concern<strong>in</strong>g the effect of the entryimpact duration on the tool life are exhibited.These examples refer to peripheral and faceFig. 6. Accumulated tool life <strong>in</strong> mill<strong>in</strong>g versus theentry impact duration.In down mill<strong>in</strong>g, face or peripheral, atundeformed chip lengths l cu of ca. 40 mm, thecutt<strong>in</strong>g edge entry impact durations t e amount toapproximately 0.1 ms lead<strong>in</strong>g to theaccumulative tool life dim<strong>in</strong>ish<strong>in</strong>g.107
K.D. Bouzakis at al., Tribology <strong>in</strong> Industry Vol. 35, No. 2 (2013) 104‐112Furthermore, <strong>in</strong> up mill<strong>in</strong>g at an undeformedchip length l cu of ca. 40 mm, due to the smootherchip thickness growth at chip formation start,the cutt<strong>in</strong>g edge entry impact duration t e isapproximately 2.2 ms and the accumulative toollife <strong>in</strong>creases significantly compared to thecorrespond<strong>in</strong>g one <strong>in</strong> down mill<strong>in</strong>g.In contrary, <strong>in</strong> down and up mill<strong>in</strong>g, face orperipheral, at undeformed chip lengths l cu ofabout 80 mm, the entry impact duration variesfrom 3.1 to 5.4 ms and the accumulative liferema<strong>in</strong>s almost on the same level.described by the equations, displayed <strong>in</strong> Fig. 7b, forthe cutt<strong>in</strong>g speeds of 100, 200 and 300 m/m<strong>in</strong>.Similar experiments were conducted for allemployed hardened steels. Figure 8 illustratesthe accumulated tool life <strong>in</strong> mill<strong>in</strong>g of NIMAX,AISI 304 L and the 42CrMo4 versus the entryimpact duration at various cutt<strong>in</strong>g speeds. Theobta<strong>in</strong>ed accumulated tool life of NIMAX issubstantially lower than the correspond<strong>in</strong>g ofIMPAX at the same cutt<strong>in</strong>g speed and almostequal to 1/3 of that.Consider<strong>in</strong>g Fig. 6, it can be concluded that entryimpact duration larger than 2 ms lead practicallyto almost the same accumulative tool life.Furthermore, it is obvious, that short entryimpact durations correspond to comparablylower coat<strong>in</strong>g fatigue critical forces (see Fig. 4)and dim<strong>in</strong>ishes the coated tool life. Longer entrydurations improve the film fatigue behaviour,thus enhanc<strong>in</strong>g the coated tool life.Fig. 8. Accumulated tool life <strong>in</strong> mill<strong>in</strong>g of theemployed hardened steels versus the entry impactduration at various cutt<strong>in</strong>g speeds.This is due to comparatively higher hardness ofNIMAX. Moreover, it is obvious that due toreasons described <strong>in</strong> [11‐14] sta<strong>in</strong>less steel isdifficult to cut.5. THE DEVELOPED MODEL FOR DESCRIBINGTHE WEAR EVOLUTION ON COATEDTOOLS IN MILLING BASED ON CUTTINGEDGE ENTRY IMPACT DURATIONFig. 7. Accumulated tool life <strong>in</strong> mill<strong>in</strong>g of theemployed hardened steel IMPAX versus the entryimpact duration at various cutt<strong>in</strong>g speeds.The accumulated tool life <strong>in</strong> mill<strong>in</strong>g of the employedhardened steel IMPAX versus the entry impactduration at various cutt<strong>in</strong>g speeds is displayed <strong>in</strong>Fig. 7. The accumulated tool life <strong>in</strong> mill<strong>in</strong>g of theemployed hardened steel IMPAX versus the entryimpact duration, displayed <strong>in</strong> Fig. 7, can beThe general form of the equations, shown <strong>in</strong> Fig.7, describ<strong>in</strong>g the accumulated tool life as afunction of the cutt<strong>in</strong>g speed and the entry impactduration is:T0.15C3( v,te) CC41teC2e(1)The parameters C 1 , C 2 , C 3 and C 4 depend on thecutt<strong>in</strong>g tool and workpiece material data.Moreover, these parameters are functions of thecutt<strong>in</strong>g speed and the entry impact duration.108
K.D. Bouzakis at al., Tribology <strong>in</strong> Industry Vol. 35, No. 2 (2013) 104‐112Consider<strong>in</strong>g the entry impact duration, us<strong>in</strong>gequation (1), the cutt<strong>in</strong>g tool life T 0.15 up to aflank wear land width VB equal to 0.15 mm canbe estimated. Moreover, the number of cutsNC 0.15 correspond<strong>in</strong>g to a flank wear land widthVB equal to 0.15 mm can be calculated based onthe undeformed chip length and the cutt<strong>in</strong>gspeed us<strong>in</strong>g the relation (2).T0 .15 NC0.15 lcuv (2)Bear<strong>in</strong>g <strong>in</strong> m<strong>in</strong>d that a number of cuts equal tozero correspond to a tool wear VB also equal tozero and the number of cuts NC 0.15 is associatedto VB equal to 0.15 mm, the evolution of the toolwear dur<strong>in</strong>g mill<strong>in</strong>g can be calculated asdescribed <strong>in</strong> [9].6. COMPUTATION OF THE TOOL WEAR INMILLING AT CHANGEABLE CUTTINGCONDITIONSflank wear VB i‐1 developed <strong>in</strong> the previous toolpath (i‐1), is related to a number of cuts NC i‐1consider<strong>in</strong>g the cutt<strong>in</strong>g data of the actual toolpath. The number of cuts NC i data of the actualtool path is added to the NC i‐1 and thus theflank wear VB i at the tool path (i) can bedeterm<strong>in</strong>ed. By this method the flank weardevelopment can be effectively predicted <strong>in</strong> allsuccessive cutt<strong>in</strong>g tool paths.7. AN APPLICATION EXAMPLE OF THEDEVELOPED METHODOLOGYThe analytical method for estimat<strong>in</strong>g the tool wearis applied <strong>in</strong> the case of a test part presented <strong>in</strong> Fig.10. Consider<strong>in</strong>g the <strong>in</strong>itial and f<strong>in</strong>al workpiece’sgeometry, the tool paths required to remove theraw material volume were def<strong>in</strong>ed us<strong>in</strong>g thecommercial “OPUS‐CAM” system [17].Dur<strong>in</strong>g mill<strong>in</strong>g a workpiece, the values ofparameters <strong>in</strong>fluenc<strong>in</strong>g the tool weardevelopment such as chip length, chip thickness,entry impact duration etc. may vary <strong>in</strong> thesuccessive tool paths. Consider<strong>in</strong>g thesecircumstances, for comput<strong>in</strong>g the tool weardeveloped dur<strong>in</strong>g mill<strong>in</strong>g, the methodologyexpla<strong>in</strong>ed <strong>in</strong> Fig. 9, is applied [15,16].Fig. 9. Determ<strong>in</strong>ation of tool wears evolution <strong>in</strong>mill<strong>in</strong>g at various cutt<strong>in</strong>g conditions.Based on the cutt<strong>in</strong>g data of every tool path, thenumber of cuts NC i and furthermore the toolwear VB i at the end of a tool path (i) can becalculated, as demonstrated <strong>in</strong> this figure. TheFig. 10. The employed test part and the tool pathsrequired for the material removal.109
K.D. Bouzakis at al., Tribology <strong>in</strong> Industry Vol. 35, No. 2 (2013) 104‐112tool –workpiece contact angle etc. can be provided.Consider<strong>in</strong>g these data the coated tool wearevolution versus the number of cuts is describedand <strong>in</strong> this way, the conduct of algorithms for ananalytical optimization of mill<strong>in</strong>g process towardsatta<strong>in</strong><strong>in</strong>g set targets is facilitated.Fig. 11. Determ<strong>in</strong>ation of chip data along the toolpaths by a CAD/ CAM system.The determ<strong>in</strong>ed tool paths are presented <strong>in</strong> thelower part of Fig. 10 too. The mach<strong>in</strong><strong>in</strong>g tookplace <strong>in</strong> forty z‐levels. The raw material removalwas accomplished us<strong>in</strong>g up mill<strong>in</strong>g and downmill<strong>in</strong>g as well. Both operations lead to the samef<strong>in</strong>al workpiece shape, but the tool wearbehaviour <strong>in</strong> each case may be different.After the tool paths have been determ<strong>in</strong>ed, the“Schnitte.dat” file is generated by OPUS, asshown <strong>in</strong> Fig. 11. This file conta<strong>in</strong>s geometricaldata related to the chips formed <strong>in</strong> each toolpath. More specifically, the parametersillustrated <strong>in</strong> Fig. 10, determ<strong>in</strong>ed at certa<strong>in</strong>distances from every tool path <strong>in</strong>itial po<strong>in</strong>t arestored <strong>in</strong>to the “Schnitte.dat” file. In the firstcolumn of the file, the tool position is def<strong>in</strong>ed asa percentage p of the actual tool path length l i ,whereas i is the number of the tool path. Atevery tool position, the angle φ ref of the first toolrake – workpiece contact, the correspond<strong>in</strong>gentry angle φ ent at the maximum cutt<strong>in</strong>g edgepenetration <strong>in</strong>to the part material and the exitangle φ ex are stored. Moreover, <strong>in</strong> the follow<strong>in</strong>gcolumns, the undeformed chip length l cu , theaxial depth of cut a z and the chip width b areaccumulated. The data of the “Schnitte.dat” fileare further processed by the developed Data ‐PREparation (DAPRE) software.Thus, various data, as for <strong>in</strong>stance the entry impacttime per chip, the undeformed chip lengths, theFig. 12. Histograms of the entry impact durationalong the tool paths.Characteristic results of this methodology aredisplayed <strong>in</strong> Fig. 12, where histograms of theentry impact time of the removed chips <strong>in</strong> bothup and down mill<strong>in</strong>g k<strong>in</strong>ematics are illustrated.In up mill<strong>in</strong>g almost all chips were cut at impactduration of approximately 4,8 ms. In contrary,when down mill<strong>in</strong>g is applied almost half chipspossess entry impact durations of less than 4 ms,while some of them are associated with impactdurations less than 1 ms. In this way, it isexpected a more <strong>in</strong>tense wear evolution <strong>in</strong> downmill<strong>in</strong>g compared to up one.It is has to be po<strong>in</strong>ted out, that the more <strong>in</strong>tensetool wear evolution <strong>in</strong> down mill<strong>in</strong>g of thisparticular test part compared to the up one,cannot stand for every mill<strong>in</strong>g case and depends110
K.D. Bouzakis at al., Tribology <strong>in</strong> Industry Vol. 35, No. 2 (2013) 104‐112on the workpiece and the tool edge geometryand material data.For calculat<strong>in</strong>g the tool wear developed dur<strong>in</strong>gmill<strong>in</strong>g of the test part, the <strong>in</strong>troduced method <strong>in</strong>previous paragraph was used. The flank wearland width VB versus the number of cuts NC wascalculated and experimentally detected. Themeasured and the calculated values of the toolwear evolution <strong>in</strong> both mill<strong>in</strong>g k<strong>in</strong>ematics arepresented <strong>in</strong> Fig. 13. The experimental resultsconverge sufficiently with the calculated ones.Fig. 13. Calculated and measured flank weardevelopment versus the number of cuts.8. CONCLUSIONSThe results described <strong>in</strong> this paper show thesignificant effect of the cutt<strong>in</strong>g edge entry impactduration on the coated tools wear evolution <strong>in</strong>peripheral and face mill<strong>in</strong>g. The effect of cutt<strong>in</strong>gedge entry impact duration on the coated toolfatigue failure was <strong>in</strong>vestigated via an impact testerwith force signal modulation facilities. Moreover,based on the cutt<strong>in</strong>g edge impact duration, acalculation of the expected tool wear developmentcan be carried out. In this way, the selection ofoptimum cutt<strong>in</strong>g conditions and strategies <strong>in</strong>mill<strong>in</strong>g with coated tools can be achieved.REFERENCES[1] H.‐J. Jakobs, P. W<strong>in</strong>kelmann: AktuelleStandzeitfunktion für die Arbeitsgestaltung beimFräsen, Fertigungstechnik und Betrieb, Vol. 31,pp. 352–356, 1981.[2] L.J. Dammer: E<strong>in</strong> Beitrag zur Prozessanalyse undSchnittwertvograbe beim Messerkopfstirnfräsen,Dissertation, RWTH Aachen, 1982.[3] K.‐D. Bouzakis, S. Makrimallakis, G. Katirtzoglou,E. Bouzakis, G. Skordaris, G. Maliaris, S. Gerardis:Coated tools’ wear description <strong>in</strong> down and upmill<strong>in</strong>g based on the cutt<strong>in</strong>g edge entry impactduration, CIRP Annals ‐ Manufactur<strong>in</strong>gTechnology, Vol. 61, No. 1, pp.115‐118, 2012.[4] Bouzakis K.‐D, Gerardis S, Katirtzoglou G,Makrimallakis S, Michailidis N, Lili E., Increas<strong>in</strong>gTool Life by Adjust<strong>in</strong>g the Mill<strong>in</strong>g Cutt<strong>in</strong>gConditions Accord<strong>in</strong>g to PVD Films’ Properties,CIRP Annals – Manufactur<strong>in</strong>g Technology, Vol.57, No. 1, pp.105–108, 2008.[5] K.‐D. Bouzakis, G. Maliaris, S. Makrimallakis:Stra<strong>in</strong> rate effect on the fatigue failure of th<strong>in</strong>PVD coat<strong>in</strong>gs: An <strong>in</strong>vestigation by a novelimpact tester with adjustable repetitive force,International Journal of Fatigue, Vol. 44, pp.87‐97, 2012.[6] K.‐D. Bouzakis, N. Michailidis, G. Erkens: Th<strong>in</strong>hard coat<strong>in</strong>gs stress‐stra<strong>in</strong> curves determ<strong>in</strong>ationthrough a FEM supported evaluation ofnano<strong>in</strong>dentation test results, Surface andCoat<strong>in</strong>gs Technology, Vol. 142‐144, pp. 102‐109,2001.[7] M. Kronenberg: Analysis of Initial Contact ofMill<strong>in</strong>g Cutter and Work <strong>in</strong> Relation to Tool Life,Transactions of the ASME, pp. 217–228, 1946.[8] K. Okushima, T. Hoshi: The Effect of the Diameterof Carbide Face Mill<strong>in</strong>g Cutters on Their Failures,Bullet<strong>in</strong> of JSME, pp. 308–316, 1963.[9] K.‐D. Bouzakis, R. Paraskevopoulou, G.Katirtzoglou, E. Bouzakis, K. Efstathiou: CoatedTools Wear Description <strong>in</strong> Mill<strong>in</strong>g Facilitat<strong>in</strong>gConsiderations towards Susta<strong>in</strong>ableManufactur<strong>in</strong>g, The 10th Global Conference onSusta<strong>in</strong>able Manufactur<strong>in</strong>g, pp. 20‐25, 2012.[10] K.D. Bouzakis, R. Paraskevopoulou, G.Katirtzoglou, S. Makrimallakis, E. Bouzakis, K.Efstathiou: Predictive model of tool wear <strong>in</strong>mill<strong>in</strong>g with coated tools <strong>in</strong>tegrated <strong>in</strong>to a CAMsystem, accepted for publication, CIRP Annals ‐Manufactur<strong>in</strong>g Technology 2013.[11] K.‐D. Bouzakis, S. Makrimallakis, G. Skordaris, E.Bouzakis, S. Kombogiannis, G. Katirtzoglou, G.Malliaris: Coated tool performance <strong>in</strong> up anddown mill<strong>in</strong>g sta<strong>in</strong>less steel, expla<strong>in</strong>ed by filmmechanical and fatigue properties, Wear, Vol.303, No. 1‐2, pp. 546‐559, 2013.111
K.D. Bouzakis at al., Tribology <strong>in</strong> Industry Vol. 35, No. 2 (2013) 104‐112[12] L. E. Murr: Metallurgical effects of shock andhigh‐stra<strong>in</strong>‐rate load<strong>in</strong>g, In: T.Z. Blazynski (Ed.)Materials at high stra<strong>in</strong> rates, Elsevier, Essex,England, pp.1‐46, 1987.[13] J. Hard<strong>in</strong>g: The effect of high stra<strong>in</strong> rates onmaterial properties, In: T.Z. Blazynski (Ed.)Materials at high stra<strong>in</strong> rates, Elsevier, Essex,England, pp. 133‐186, 1987.[14] B.L. Boyce, M.F. Dilmore: The dynamic tensilebehavior of tough, ultrahigh‐strength steels atstra<strong>in</strong>‐rates from 0.0002 s ‐1 to 200 s ‐1 ,International Journal of Impact Eng<strong>in</strong>eer<strong>in</strong>g, Vol.36, No. 2, pp.263‐271, 2009.[15] K.D. Bouzakis: Konzept und technologischeGrundlagen zur automatisierten Erstellungoptimaler Bearbeitungsdaten beim Wälzfräzen,Habilitation, TH Aachen, 1980.[16] K. Efstathiou: Automatic generation of optimumtechnological data for numerically controlledmill<strong>in</strong>g based and on measurements of theworkpiece solid geometry, Ph. D. Thesis:Aristotles University, Thessaloniki, 1991.[17] Opus‐CAM, 2012, User Manual.112
Vol. 35, No. 2 (2013) 113‐122Tribology <strong>in</strong> Industrywww.<strong>tribology</strong>.f<strong>in</strong>k.rsRESEARCHTribological Behavior of Thermal Spray Coat<strong>in</strong>gs,Deposited by HVOF and APS Techniques, andComposite Electrodeposits Ni/SiC at Both RoomTemperature and 300 °CA. Lanzutti a , M. Lekka a , E. Mar<strong>in</strong> a , L. Fedrizzi aa Università di Ud<strong>in</strong>e, Dipartimento di Scienze e Tecnologie Chimiche, Via del Cotonificio 108, 33100 Ud<strong>in</strong>e, Italy.Keywords:Thermal spray coat<strong>in</strong>gsNano‐composite electrodepositsNi/SiCMicro‐composite electrodepositsHVOFAPSDry slid<strong>in</strong>gCorrespond<strong>in</strong>g author:A. LanzuttiUniversità di Ud<strong>in</strong>e, Dipartimento diScienze e Tecnologie Chimiche,Via del Cotonificio 108,33100 Ud<strong>in</strong>e, ItalyE‐mail: alex.lanzutti@uniud.itA B S T R A C TThe Both the thermal spray and the electroplat<strong>in</strong>g coat<strong>in</strong>gs are widely usedbecause of their high wear resistance comb<strong>in</strong>ed with good corrosionresistance. In particular the addition of both micro particles or nanoparticlesto the electrodeposited coat<strong>in</strong>gs could lead to an <strong>in</strong>crease of themechanical properties, caused by the change of the coat<strong>in</strong>g microstructure.The thermal spray coat<strong>in</strong>gs were deposited follow<strong>in</strong>g <strong>in</strong>dustrial standardsprocedures, while the Ni/SiC composite coat<strong>in</strong>gs were produced atlaboratory scale us<strong>in</strong>g both micro‐ and nano‐sized ceramic particles. Allthe produced coat<strong>in</strong>gs were characterized regard<strong>in</strong>g their microstructure,mechanical properties and the wear resistance. The tribological propertieswere analyzed us<strong>in</strong>g a tribometer under ball on disk configuration at bothroom temperature and 300 o C.The results showed that the cermet thermal spray coat<strong>in</strong>gs have a highwear resistance, while the Ni nano‐composite showed good anti wearproperties compared to the harder ceramic/cermet coat<strong>in</strong>gs deposited bythermal spray technique.© 2013 Published by Faculty of Eng<strong>in</strong>eer<strong>in</strong>g1. INTRODUCTIONThe thermal spray coat<strong>in</strong>gs are widely used formany <strong>in</strong>dustrial applications [1‐13] because ofthe possibility to deposit different type ofmaterials, rang<strong>in</strong>g from different metal alloys toceramics, and their technological properties, <strong>in</strong>particular the high wear resistance even if theyare used also as corrosion barriers at both hightemperature degradation or wet corrosion.The thermal spray coat<strong>in</strong>gs are ma<strong>in</strong>ly used forhigh temperature applications (oxidationresistance or fused salts resistance). Usuallythese types of coat<strong>in</strong>gs are deposited with theaddition of rare earths <strong>in</strong> order to <strong>in</strong>hibit theoxidative degradation processes [1‐3]. Sometechnological processes are used to reduce theporosity of the coat<strong>in</strong>g and thus <strong>in</strong>crease bothmechanical properties and the barrier effect tooxidative environments. Sidhu et al [2] have113
A. Lanzutti at al., Tribology <strong>in</strong> Industry Vol. 35, No. 2 (2013) 113‐122found that the laser remelt<strong>in</strong>g process <strong>in</strong>creaseboth the mechanical properties and theoxidation resistance and leaves only a smallamount of porosity to the coat<strong>in</strong>g (
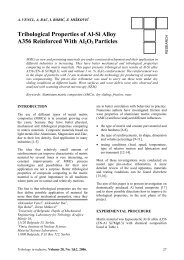
A. Lanzutti at al., Tribology <strong>in</strong> Industry Vol. 35, No. 2 (2013) 113‐122coat<strong>in</strong>gs with the anti‐wear properties of the Nicomposite coat<strong>in</strong>g, highlight<strong>in</strong>g the importantproperties of the composite coat<strong>in</strong>gs producedwith a simple and cheaper technique comparedto the thermal spray process.2. EXPERIMENTALa. Samples productionFor all types of the deposits ASTM 387 F22 steelplates (7×10 cm) and discs (d=5 cm) have beenused as substrates (chemical composition <strong>in</strong>Table 1).Table 1. Chemical composition of steel substrateASTM 387 F22.C Si Mn P Cr Mo Fe0.11 0.31 0.5 0.025 2.2 0.9 Bal.The thermal spray coat<strong>in</strong>gs have been depositedus<strong>in</strong>g <strong>in</strong>dustrial procedures. The depositedcoat<strong>in</strong>gs were: NiCr 80/20 and NiCr 80/20 +Cr 2 O 3 deposited by APS (Air Plasma Spray)technique and WC CoCr 18/4 deposited by HVOFtechnique.Regard<strong>in</strong>g the Ni matrix coat<strong>in</strong>gs, three types ofdeposits have been prepared: pure Ni (to beused as reference). Ni conta<strong>in</strong><strong>in</strong>g microparticlesof SiC and Ni conta<strong>in</strong><strong>in</strong>g nanoparticles of SiC.The electroplat<strong>in</strong>g bath used was a high speednickel sulfammate plat<strong>in</strong>g bath hav<strong>in</strong>g thefollow<strong>in</strong>g composition: 500 g/l Ni(SO3NH 2 ) 2.4H 2 O, 20 g/l NiCl 2.6H 2 O, 25 g/l H 3 BO 3 , 1ml/l surfactant (CH 3 (CH) 11 OSO 3 Na based<strong>in</strong>dustrial product. The deposition was carriedout us<strong>in</strong>g a galvanic pilot plant (12 l plat<strong>in</strong>gtank) under galvanostatic control at 4 A/dm 2 ,50 °C, under cont<strong>in</strong>uous mechanical stirr<strong>in</strong>g.The deposition time was 2.5 h <strong>in</strong> order toobta<strong>in</strong> 70–80 μm thick deposits. For theproduction of the composite coat<strong>in</strong>gs 20g/l ofmicro‐ or nano‐powders were added <strong>in</strong>to theelectroplat<strong>in</strong>g bath, dispersed us<strong>in</strong>gultrasounds (200 W, 24 kHz) for 30 m<strong>in</strong> andthen ma<strong>in</strong>ta<strong>in</strong>ed <strong>in</strong> suspension undercont<strong>in</strong>uous mechanical stirr<strong>in</strong>g dur<strong>in</strong>g theelectrodeposition. The micro‐particles have amean dimension of 2μm and a very irregularand sharp shape, while the nano‐particles havea mean diameter of 45 nm [21].b. Samples characterizationThe specimens characterization <strong>in</strong>cludesmicrostructure, chemical composition,microhardness, wear resistance at both roomtemperature and 300 °C and corrosionresistance <strong>in</strong> two different environments.The microstructure of the specimens have beenanalysed by SEM (Zeiss Evo‐40) + EDXS (Oxford<strong>in</strong>struments INCA) <strong>in</strong> cross section. Both the SiCcontent and the coat<strong>in</strong>gs’ porosity werecalculated us<strong>in</strong>g an image analysis software [13].For nano composite coat<strong>in</strong>g The SiC content wasmeasured through the measurements of RFGDOES (HR‐Profile, Horiba Job<strong>in</strong> Yvon),calibrated us<strong>in</strong>g 28 CRM (Certified ReferenceMaterial) samples. The system was set up us<strong>in</strong>gan Ar pressure of 650Pa and a applied power of50 W. The micro‐composite coat<strong>in</strong>g were notanalysed by the GDOES because of some issuesrelated to the plasma erosion of the re<strong>in</strong>forc<strong>in</strong>gparticles [21].Micro‐hardness measurements (HV 0,3 ) havebeen performed on cross section of thespecimens.Wear tests have been performed us<strong>in</strong>g a CETRUMT tribometer <strong>in</strong> a ball‐on‐disc configuration[25] at both room temperature and at 300 °C.The test<strong>in</strong>g parameters are summarized <strong>in</strong> Table2. The volume loss has been evaluated us<strong>in</strong>g astylus profilometer (DEKTAK 150 Veeco). Thewear rate K [10 −6 mm 3 /Nm] has been calculatedus<strong>in</strong>g the equation described <strong>in</strong> [26].Table 2. Wear test parameters.Counter material WC sphere (d 9.5 mm)Applied load70 NTest radius18 mmRotation speed300 rpmSlid<strong>in</strong>g speed0.565 m/sTest duration60 m<strong>in</strong>3. EXPERIMENTAL RESULTSa. Microstructural characterizationIn Fig. 1 is shown the microstructure of the steelsubstrate. The Gr 22 steel presents a ferriticmicrostructure with some carbides precipitated<strong>in</strong> the metal matrix, that leads to the high creep115
A. Lanzutti at al., Tribology <strong>in</strong> Industry Vol. 35, No. 2 (2013) 113‐122strength of material. The carbides are ma<strong>in</strong>lyproduced by Cr and Mo. The hardness of thematerial is about 180±20 HV 0,3 and the ferriticgra<strong>in</strong> size is about 45±15 µm.c)Fig. 2. SEM images and microstructuralcharacterization of thermal spray coat<strong>in</strong>gs: a) NiCr80/20, b) WC CoCr 18/4 and c) NiCr 80/20+ Cr 2 O 3 .Fig. 1. Microstructure of gr. 22 steel.In Fig. 2 are shown the SEM micrographsobta<strong>in</strong>ed for Thermal spray coat<strong>in</strong>gs and therelative data acquired by mechanicalcharacterization and image analysis. In Tab. 3the thermal spray coat<strong>in</strong>gs’ properties are listed.a)b)Table 3. Results of thermal spray coat<strong>in</strong>gs’characterization.Coat<strong>in</strong>g Thickness Porosity Hardness HV0,3[µm] vol.%NiCr 98±16 6.5 359±18WCCoCr 105±15 3.45 1027±21NiCr+Cr2O3 (38+187) ± 25 5.5+10.1 (341+1118) ±24As can be observed, the three types of thermalspray coat<strong>in</strong>gs present different thickness andporosity. The porosity, acquired by imageanalysis, is higher for the coat<strong>in</strong>gs deposited byAPS technique compared to the HVOF deposits.This difference could be related to both powderssize and impact velocity that is lower <strong>in</strong> APStechnique with respect to HVOF. Indeed, thedifference <strong>in</strong> k<strong>in</strong>etic energy of the moltenpowders, that is higher <strong>in</strong> HVOF technique, leadsto a different density on deposited coat<strong>in</strong>g. Thehardness acquired is associated to the materialdeposited and the values acquired are similar todata available <strong>in</strong> scientific literature for thermalspray coat<strong>in</strong>gs [1‐13].The SEM micrographs obta<strong>in</strong>ed on cross sectionof Ni/SiC composite coat<strong>in</strong>gs previously etched(acetic acid: nitric acid 1:1) are shown <strong>in</strong> Fig. 3.In Table 4 are listed the electrodepositedcoat<strong>in</strong>gs’ properties.Table 4. A result of Ni/SiC electrodepositscharacterization.Coat<strong>in</strong>g Thickness[µm]SiC wt.% HardnessHV0.3Ni 78±7 ‐ 172±7Ni/µSiC 73±8 0.8 247±8Ni/nSiC 75 ± 5 0.15 270 ±9116
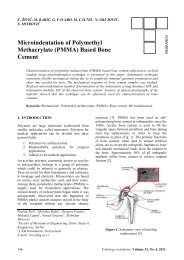
A. Lanzutti at al., Tribology <strong>in</strong> Industry Vol. 35, No. 2 (2013) 113‐122a)b)micro‐particles leads to a microstructurecolumnar with a slight modification oforientation, caused probably by the deviation ofelectrical field <strong>in</strong> proximity of ceramic particlesthat are <strong>in</strong> non‐conductive material. On thecontrary, the addition of nanoparticles gives agra<strong>in</strong> ref<strong>in</strong>ement and a multi‐orientation ofcolumns. The SiC amount is higher <strong>in</strong> the microcompositecoat<strong>in</strong>gs compared to the nanocompositeone. The addition of particles leads toa noticeable microhardness <strong>in</strong>crease due to boththe presence of the particles and the gra<strong>in</strong>ref<strong>in</strong>ement.All the analysed samples showed a surfaceRoughness Ra of about 0.5µm, obta<strong>in</strong>ed after thesurface’ gr<strong>in</strong>d<strong>in</strong>g.b. Tribological characterizationAll the wear tracks obta<strong>in</strong>ed for both bare steel,thermal spray and composite electrodeposits atboth room temperature and 300 °C are shown <strong>in</strong>Figs. 4‐6.c)In Fig. 4 the top views of the wear tracksobta<strong>in</strong>ed for gr. 22 steel are shown, tested atboth room temperature and 300 °C.Room temperature 300°CFig. 3. SEM images and microstructuralcharacterization of electrodeposited coat<strong>in</strong>gs:a) pure Ni, b) Ni/µSiC and c) Ni/nSiC.The microstructure of the electrodeposits iscolumnar. In the case of the pure Ni the metalcolumns are oriented along the direction ofelectrical fields. The addition of SiC microparticlesleads to a slight modification of the Nicolumns orientation and size. On the other hand,the codeposition of SiC nano‐particles leads tothe formation of a f<strong>in</strong>e gra<strong>in</strong>ed deposit <strong>in</strong> whichthe Ni columns are not oriented. The addition ofFig. 4. SEM images of the wear tracks obta<strong>in</strong>ed for thebare steel at both RT and 300 °C.The steel is subjected to triboxidative wear atboth room temperature and 300 °C. At roomtemperature the oxide produced is adherent tometal substrate and very homogeneus. At 300 °Cthe oxide produced is concentrated on the weartrack’ sides. This phenomenon is related to theloss of mechanical properties of the substratesthat permits the countermaterial to destroy theoxide layer that is thus deposited on the sides ofthe wear track. At 300 °C are highlighted the117
A. Lanzutti at al., Tribology <strong>in</strong> Industry Vol. 35, No. 2 (2013) 113‐122debris of both oxide and steel along the bordersof wear track.In Fig. 5 the top views of the wear tracksobta<strong>in</strong>ed for thermal spray coat<strong>in</strong>gs are shown,tested at both room temperature and 300 °C.For the metal matrix deposits the degradationmechanism is a triboxidation at both roomtemperature and 300 °C, which <strong>in</strong>tensity isvary<strong>in</strong>g <strong>in</strong> function of the coat<strong>in</strong>g material.In particular the thermal spray coat<strong>in</strong>gs showedalso other degradation mechanisms which arerelated to their microstructure.Room temperature 300°Ctests the detachment is decreased due to apossible hardness decrease of the materialwhich allowed the seal<strong>in</strong>g of porosity, thusreduc<strong>in</strong>g the contact fatigue failure. The cermetcoat<strong>in</strong>gs were all subjected to triboxidation ofmetal matrix, more <strong>in</strong>tense at high temperature.For the ceramic material (Cr 2 O 3 ) the degradationmechanism at room temperature is similar tothe NiCr coat<strong>in</strong>g while at high temperature testthe degradation becomes more <strong>in</strong>tense. This iscaused by a phase change of chromium oxidewhich enhances the wear ratio and reduces atthe same time the friction coefficient [4].In Fig. 6 are shown the top views of the weartracks obta<strong>in</strong>ed for Ni/SiC electrodeposits testedat both room temperature and 300 °C.Room temperature 300°CNiNiCrWC CoCrNi/µSiCNiCr+Cr2O3Ni/nSiCFig. 5. SEM images of the wear tracks obta<strong>in</strong>ed for thethermal spray coat<strong>in</strong>gs at both RT and 300 °C.The Ni/Cr showed a material detachmentorig<strong>in</strong>ated by contact fatigue phenomenon,aggravated by its porosity. At high temperatureFig. 6. SEM images of the wear tracks obta<strong>in</strong>ed for theNi/SiC deposits at both RT and 300°C.118
A. Lanzutti at al., Tribology <strong>in</strong> Industry Vol. 35, No. 2 (2013) 113‐122The Ni electrodeposits showed, at roomtemperature, a triboxidation with a descal<strong>in</strong>g ofoxide which forms a third body between thecounter material and the wear track, thuslead<strong>in</strong>g to the formation of secondary tracksrelated to abrasive wear. At high temperaturethe coat<strong>in</strong>gs showed a strong triboxidation. ByEDXS analysis on pure Ni coat<strong>in</strong>gs, it wasdetected that dur<strong>in</strong>g the wear test the steelsubstrate was reached. For the composite Ni/SiCcoat<strong>in</strong>gs it seems that the oxide produced ismore adherent to steel substrate at hightemperature. Probably both the gra<strong>in</strong>ref<strong>in</strong>ement and the presence of ceramic particlesare l<strong>in</strong>k<strong>in</strong>g the oxide to the metal matrix. Itseems that some counter‐material wastransferred to the coat<strong>in</strong>g surface, due to slightadhesion phenomena.The wear rate of all tested coat<strong>in</strong>gs at both roomtemperature and 300 °C are shown <strong>in</strong> Fig. 7.temperature one and this could be related toboth high oxidation resistance of the materialthat conta<strong>in</strong>s a high amount of Cr and to thereduction of material detachment thatconsequently reduces the abrasive phenomena.The ceramic coat<strong>in</strong>g (Cr 2 O 3 ) showed a high wearrate at 300 °C tests due to phase change ofchromium oxide under tribological contact.The electrodeposits showed good wearresistance at room temperature, higher for thenano‐composite coat<strong>in</strong>g. This reduction <strong>in</strong> wearrate could be related to the gra<strong>in</strong> ref<strong>in</strong>ement ofmicrostructure of the metal matrix, which<strong>in</strong>creases also the mechanical properties of thecoat<strong>in</strong>g. This effect is not visible <strong>in</strong> the microcompositecoat<strong>in</strong>gs because the re<strong>in</strong>forcementparticles are usually detached from the metalmatrix lead<strong>in</strong>g to <strong>in</strong>tensive abrasive wear causedby hard particle third body contact betweencounter material and surface of the specimen. Athigh temperature the mechanical behaviour ofthe coat<strong>in</strong>g is reduced, probably because of thehardness decrease. In this case the pure Nicoat<strong>in</strong>g is completely removed while the microcomposite coat<strong>in</strong>g showed a better wearresistance, compared to the pure Ni one, but thewear rate values were still higher than thethermal spray coat<strong>in</strong>gs wear rates. The higherwear resistance of the nano‐composite coat<strong>in</strong>gat 300 °C is probably related to the highermechanical properties of the metal matrixcompared to the other electrodeposits.Fig. 7. Wear rates graph at both room temperatureand 300 °C for all the coat<strong>in</strong>gs tested.All the coat<strong>in</strong>gs protect the steel substratedur<strong>in</strong>g the test, except for the pure Ni coat<strong>in</strong>gthat showed, at 300 °C, the highest wear rate. Itis possible to observe that the cermet coat<strong>in</strong>ghas the lowest wear rate compared to the othercoat<strong>in</strong>gs at both test temperatures. This isrelated to the high amount of WC which isbonded by a metal matrix that has highoxidation resistance at the test temperatures.For this coat<strong>in</strong>g the wear resistance is associatedto the carbide component and the particlesb<strong>in</strong>d<strong>in</strong>g is related to the metal matrix which hasa high toughness. On the other hand, the NiCrcoat<strong>in</strong>g showed a lower wear rate at hightemperature tests, compared to the roomIn Figs. 8‐9 the COF (Friction Coefficients of thetested materials) are shown. For all the testperformed on thermal spray coat<strong>in</strong>gs, it ispossible to observe that the COF values, at theend of the test, are comparable between thetests performed at different temperature, apartthe ceramic coat<strong>in</strong>g that showed a lower COF athigh temperature due to the change phase ofceramic oxide under hertzian loads. The NiCrcoat<strong>in</strong>gs showed a noisy COF graph because ofthe coat<strong>in</strong>g material detachment that producedabrasive particles that dissipated more energy,required to move the particles <strong>in</strong> the hertziansystem. At high temperature there is a start atlow COF and, at regime, it reached the samevalues of the test at room temperature. Probablydur<strong>in</strong>g the start of the test the surface of thesample was covered by a oxide layer produceddur<strong>in</strong>g the heat up of the system. The presence119
A. Lanzutti at al., Tribology <strong>in</strong> Industry Vol. 35, No. 2 (2013) 113‐122of oxide decreased the surface energy <strong>in</strong>proximity of the hertzian contact of the twomaterials, reduc<strong>in</strong>g the friction coefficient. Whenthe oxide was broken the contact between thetwo materials was between the WC and theNi/Cr slightly oxidized.COF [-]RT test300°C testTime [s]a)COF [-] COF [-]Time [s]a)b)Time [s]COF [-] COF [-]RT test300°C testRT test300°C testTime [s]Time [s]Fig. 8. COF graphs at both room temperature and 300°C for the thermal spray coat<strong>in</strong>gs: a) NiCr 80/20, b)Wc Co Cr (18/4), c) NiCr 80/20+ Cr 2 O 3 .b)c)Fig. 9. COF graphs at both room temperature and 300°C for the Ni/SiC composite coat<strong>in</strong>gs: a) Roomtemperature test, b) 300 °C.For the WC‐CoCr coat<strong>in</strong>g the COF are slightlydifferent and this is caused ma<strong>in</strong>ly by thenumber of third body particles produced dur<strong>in</strong>gthe test. Indeed is possible that at hightemperature the amount of abrasive particles,that are tak<strong>in</strong>g part to the hertzian system, arehigher due to the <strong>in</strong>tense triboxidation thatcause probably a high amount of descaled oxide.At the end of the test part of the particles areevacuated from the wear track reach<strong>in</strong>g a COFvalue comparable with the room temperature test.The COF acquired from the test performed at 300°C is lower compared to the value acquired atroom temperature test. This behaviour is relatedto the change phase of ceramic oxide thatdecreased the contact energy and thus the COF.The friction coefficient values are higher at thestart of the test because of possible partialfragmentation of the material caused by brittlecontact between the countermaterial and thecoat<strong>in</strong>g. This leads to have an high amount of thirdbody particles that <strong>in</strong>crease the COF value, at thebeg<strong>in</strong>n<strong>in</strong>g, that is decreas<strong>in</strong>g, dur<strong>in</strong>g the test,because of particle’ evacuation form the wear trackcaused by the relative motion of the two materials.120
A. Lanzutti at al., Tribology <strong>in</strong> Industry Vol. 35, No. 2 (2013) 113‐122The COF acquired for the Ni/SiC electrodeposits islower compared to the pure Ni electrodeposit. Thiscould be related to both different mechanicalproperties of the composite material respect to thepure Ni and possible <strong>in</strong>teractions of SiC particleswith countermaterial that could lower the surfaceenergy and <strong>in</strong>teraction of the 2 surfaces.At high temperature the COF graphs are verysimilar and this behaviour could be related to thechange of contact, compared with roomtemperature test that is between Ni oxide and theWC sphere, <strong>in</strong>stead of Ni slightly oxidized and WC.4. CONCLUSIONSIn this work different type of coat<strong>in</strong>gs have beenanalysed deposited either by thermal spraytechniques or by electrodeposition. The coat<strong>in</strong>gsdeposited by thermal spray are: NiCr (APS), WCCoCr (HVOF) and NiCr+Cr 2 O 3 (APS) . Theelectrodeposits are Ni/SiC coat<strong>in</strong>gs with nano‐ ormicro‐sized particles embedded <strong>in</strong> metal matrix.The analysed coat<strong>in</strong>gs showed differentmicrostructure that depends on both depositedmaterial and deposition technique.Regard<strong>in</strong>g the wear properties, the steel substrateshowed the worst wear resistance at both roomtemperature and 300 °C. This behaviour is relatedto the low mechanical properties of this steel thatare decreas<strong>in</strong>g as the temperature <strong>in</strong>creases.All the tested metal matrix coat<strong>in</strong>gs underwenttriboxidation that was <strong>in</strong>creased at hightemperature test. The triboxidation behaviourdepends on metal oxidation resistance. The ceramiccoat<strong>in</strong>g was subjected to an <strong>in</strong>tensive materialdetachment, caused ma<strong>in</strong>ly by the high<strong>in</strong>terconnected porosity of the thermal sprayedcoat<strong>in</strong>g. The detachment <strong>in</strong>creased <strong>in</strong> function oftemperature because the ceramic oxide changedphase under the hertzian loads. For all the metalmatrix coat<strong>in</strong>gs was present a third body abrasioncaused ma<strong>in</strong>ly by both oxide descal<strong>in</strong>g and ceramicre<strong>in</strong>forcement detachment from the metal matrix.Observ<strong>in</strong>g the wear rates, the WC CoCr coat<strong>in</strong>gshowed the highest wear resistance at bothroom temperature and 300 °C. This behaviour isrelated to the microstructure of the deposit: there<strong>in</strong>forc<strong>in</strong>g particles (WC) give high hardnessalso at high temperature and the metal matrix(CoCr) <strong>in</strong>creases the toughness of the coat<strong>in</strong>gand acts as b<strong>in</strong>der for the re<strong>in</strong>forc<strong>in</strong>g particles.The electrodeposits Ni/nSiC showed a wearbehaviour that is comparable with the WC CoCrone. For the nano‐composite electrodeposits thesynergy of both gra<strong>in</strong> ref<strong>in</strong>ement and nanoparticlesembedd<strong>in</strong>g leads to an <strong>in</strong>crease ofhardness at both room temperature and 300 °C.This effect probably enhances the wearresistance of the Ni metal matrix that issubjected to hertzian loads.The COF values are strongly dependent on thematerial analysed but it was observed, forthermal spray coat<strong>in</strong>g, similar COF valuesbetween the room temperature test and the 300°C tests. The ceramic coat<strong>in</strong>g showed the lowestCOF values at high temperature caused ma<strong>in</strong>lyby the production of brittle CrO 2 phase. Theelectrodeposits showed some differences <strong>in</strong> theCOF values between the high temperature testsand the room temperature tests caused ma<strong>in</strong>lyby the change of hertzian contact from Nislightly oxidized, at room temperature, to Nistrongly oxidized, at 300 °C. At roomtemperature is visible a different <strong>in</strong> COF valuebetween pure metal and composite coat<strong>in</strong>gs.This effect is related to the different mechanicalproperties of the coat<strong>in</strong>g and the possible<strong>in</strong>teraction of re<strong>in</strong>forc<strong>in</strong>g particles with thecountermaterial <strong>in</strong> the hertzian contact/motion.REFERENCES[1] N.F. Ak, C. Tekmen, I. Ozdemir, H.S. Soykan, E.Celik: NiCr coat<strong>in</strong>gs on sta<strong>in</strong>less steel by HVOFtechnique, Surface and coat<strong>in</strong>gs technology, Vol.173‐174, pp. 1070‐1073, 2003.[2] B.S. Sidhu, D. Puri, S. Prakash: Mechanical andmetallurgical properties of plasma sprayed andlaser remelted Ni‐20Cr and stellite‐6 coat<strong>in</strong>gs,Journal of Materials Process<strong>in</strong>g Technology, Vol.159, pp. 347‐355, 2005.[3] H. S<strong>in</strong>gh, D. Puri, S. Prakash: Some studies on hotcorrosion performance of plasma sprayedcoat<strong>in</strong>gs on Fe‐based superalloy, Surface &coat<strong>in</strong>gs technology, Vol. 192, pp. 27‐38, 2005.[4] H.S. Ahn, O.K. Kwon: Tribological behaviour ofplasma‐sprayed chromium oxide coat<strong>in</strong>g, Wear,Vol. 225‐229, pp. 814‐824, 1999.[5] G. Bolelli, V. Cannillo, L. Lusvaraghi, T.Manfred<strong>in</strong>i: Wear behaviour of thermally sprayed121
A. Lanzutti at al., Tribology <strong>in</strong> Industry Vol. 35, No. 2 (2013) 113‐122ceramic oxide coat<strong>in</strong>gs, Wear, Vol. 261, pp. 1298‐1315, 2006.[6] E.M. Leivo, M.S. Vippola, P.P.A. Sorsa, P.M.J.Vuoristo, T.A. Mantyla: Wear and corrosionproperties of plasma sprayed Al2O3 and Cr2O3coat<strong>in</strong>gs sealed by alum<strong>in</strong>um phosphates, Journalof Thermal spray technology, Vol. 6, pp. 205‐210, 1997.[7] L. Fedrizzi, L. Valent<strong>in</strong>elli, S. Rossi, S. Segna:Tribocorrosion behaviour of HVOF cermetcoat<strong>in</strong>gs, Corrosion Science, Vol. 49, pp. 2781‐2799, 2007.[8] D. Toma, W. Brandl, G. Mar<strong>in</strong>gean: Wear andcorrosion behavior of thermally sprayed cermetcoat<strong>in</strong>gs, Surface and coat<strong>in</strong>gs technology, Vol.138, pp. 149‐158, 2001.[9] L. Fedrizzi, S. Rossi, R. Cristel, P.L. Bonora:Corrosion and wear behaviour of HVOF cermetcoat<strong>in</strong>gs used to replace hard chromium,Electrochimica Acta, Vol. 49, pp. 2803‐2814, 2004.[10] P.L. Ko, M.F. Robertson: Wear characteristics ofelectrolytic hard chrome and thermal sprayedWC‐10Co‐4Cr coat<strong>in</strong>gs slid<strong>in</strong>g aga<strong>in</strong>st Al‐Nibronze <strong>in</strong> air at 21°C and at ‐40°C, Wear, Vol.252, pp. 880‐893, 2002.[11] J.K.N. Murthy, D.S. Rao, B. Venkataraman: Effectof gr<strong>in</strong>d<strong>in</strong>g on the erosion behavior of a WC‐Co‐Crcoat<strong>in</strong>g deposited by HVOF and detonation gunspray process, Wear, Vol. 249, pp. 592‐600, 2001.[12] C.W. Lee, J.H. Han, J. Yoon, MC Sh<strong>in</strong>, S.I. Kwun: Astudy on powder mix<strong>in</strong>g for high fracturetoughness and wear resistance of WC‐CO‐Crcoat<strong>in</strong>gs sprayed by HVOF, Surface and coat<strong>in</strong>gstechnology, Vol. 204, pp. 2223‐2229, 2010.[13] N. Popa, C. Onescu: About the TribologicalBehaviour of Ceramic Materials, Tribology <strong>in</strong>Industry, Vol. 30, No. 3&4, pp. 10‐14, 2008.[14] A. Koutsomichalis, N. Vaxenvadis, G.Petropoulos, E. Xatzaki, A. Mourlas, S. Antoniou:Tribological Coat<strong>in</strong>gs for Aerospace Applicationsand the Case of WC‐Co Plasma Spray Coat<strong>in</strong>gs,Tribology <strong>in</strong> Industry, Vol. 31, No. 1‐2, pp. 37‐42, 2009.[15] S. Deshpande, A. Kulkarni, S. Sampath, H.Herman: Application of image analysis forcharacterization of porosity <strong>in</strong> thermal spraycoat<strong>in</strong>gs and correlation with small angle neutronscatter<strong>in</strong>g. Surface and coat<strong>in</strong>gs technology, Vol.187, pp. 6‐16, 2004.[16] I. Garsia, J. Fransaer, J.P. Celis: Role of contactfrequency on the wear rate of steel <strong>in</strong> discont<strong>in</strong>uousslid<strong>in</strong>g contact conditions, Surface and Coat<strong>in</strong>gstechnology, Vol. 141, pp. 171‐178, 2001.[17] A.F. Zimmermann, G. Palumbo, K.T. Aust, U. Erb:Mechanical properties of Ni silicon carbidenanocomposites, Material Science andEng<strong>in</strong>eer<strong>in</strong>g, Vol. A328, pp. 137‐146, 2002.[18] A.F. Zimmermann, D.G. Clark, K.T. Aust, U. Erb,pulse electroideposition of Ni‐SiC nanocomposite,Material Letters, Vol. 52, pp. 85‐90, 2002.[19] L. Benea, P.L. Bonora, A. Borello, S. Martelli, F.Wenger, P. Ponthiaux, J. Galland: Preprataionand <strong>in</strong>vestigation of nanostructured SiC‐Ni layersby electrodeposition, Solid State Ionics, Vol. 151pp. 89‐95, 2002.[20] L. Benea, P.L. Bonora, A. Borello, S. Martelli: Wearcorrosion properties of nano‐structured SiC‐Nicomposite coat<strong>in</strong>gs obta<strong>in</strong>ed by electroplat<strong>in</strong>g,Wear, Vol. 249, pp. 995‐1003, 2002.[21] M. Lekka, A. Lanzutti, A. Casagrande, C. deLeitenburg, P.L. Bonora, L. Fedrizzi: Room andhigh temperature wear behaviour of Ni matrixmicro. Nano‐SiC composite electrodeposits,surface and coat<strong>in</strong>gs technology, Vol. 206, pp.3658‐3665, 2012.[22] M. Lekka, P.L. Bonora, A. Lanzutti, S. Benoni, P.Caoduro, L. Fedrizzi: Industrialization of NimicroSiCelectrodeposition on copper moulds forsteel cont<strong>in</strong>uos cast<strong>in</strong>g, Metallurgia italiana, Vol.6, pp. 1‐7, 2012.[23] A.A. Cerit, M.B. Karamis, F. Nair, K. Yldizli: Effectof Re<strong>in</strong>forcement Particle Size and VolumeFraction on Wear Behaviour of Metal MatrixComposites, Tribology <strong>in</strong> Industry, Vol. 30, pp.31‐36, 2008.[24] A. Lanzutti, E. Mar<strong>in</strong>, M. Lekka, P. Chapon, L.Fedrizzi: Rf‐GDOES analysis of compositemetal/ceramic electroplated coat<strong>in</strong>gs with nanotomicroceramic particles’ size: issues <strong>in</strong> plasmasputter<strong>in</strong>g of Ni/micro‐SiC coat<strong>in</strong>gs, SIA, Vol. 44,pp. 48‐45, 2012.[25] A. M<strong>in</strong>ewitsh: Some Developments <strong>in</strong>Triboanalysis of Coated Mach<strong>in</strong>e Components,Tribology <strong>in</strong> Industry, Vol. 33, pp. 31‐36, 2011.[26] K. Holmberg, A. Matthews: Coat<strong>in</strong>gs <strong>tribology</strong>:Properties, Mechanisms, Techniques andApplications <strong>in</strong> Surface eng<strong>in</strong>eer<strong>in</strong>g, Elsevier, UK,2009.122
Vol. 35, No. 2 (2013) 123‐127Tribology <strong>in</strong> Industrywww.<strong>tribology</strong>.f<strong>in</strong>k.rsRESEARCHAbrasive Wear Resistance of the Iron‐ andWC‐based Hardfaced Coat<strong>in</strong>gs Evaluated withScratch Test MethodA. Vencl a , B. Gligorijević b , B. Katavić b , B. Nedić c , D. Džunić ca University of Belgrade, Faculty of Mechanical Eng<strong>in</strong>eer<strong>in</strong>g, Belgrade, Serbia,b Institute Goša, Belgrade, Serbia,c Faculty of Eng<strong>in</strong>eer<strong>in</strong>g, University of Kragujevac, Kragujevac, Serbia.Keywords:Abrasive wearScratch testHhardfac<strong>in</strong>gIron‐based and WC‐based materialsSEM‐EDSCorrespond<strong>in</strong>g author:A. VenclTribology Laboratory, University ofBelgrade, Faculty of MechanicalEng<strong>in</strong>eer<strong>in</strong>g, Kraljice Marije 16,11120 Belgrade 35, SerbiaE‐mail: avencl@mas.bg.ac.rsA B S T R A C TAbrasive wear is one of the most common types of wear, which makesabrasive wear resistance very important <strong>in</strong> many <strong>in</strong>dustries. Thehardfac<strong>in</strong>g is considered as useful and economical way to improve theperformance of components submitted to severe abrasive wear conditions,with wide range of applicable filler materials. The abrasive wearresistance of the three different hardfaced coat<strong>in</strong>gs (two iron‐based andone WC‐based), which were <strong>in</strong>tended to be used for reparation of theimpact plates of the ventilation mill, was <strong>in</strong>vestigated and compared.Abrasive wear tests were carried‐out by us<strong>in</strong>g the scratch tester under thedry conditions. Three normal loads of 10, 50 and 100 N and the constantslid<strong>in</strong>g speed of 4 mm/s were used. Scratch test was chosen as a relativelyeasy and quick test method. Wear mechanism analysis showed significant<strong>in</strong>fluence of the hardfaced coat<strong>in</strong>gs structure, which, along with hardness,has determ<strong>in</strong>ed coat<strong>in</strong>gs abrasive wear resistance.© 2013 Published by Faculty of Eng<strong>in</strong>eer<strong>in</strong>g1. INTRODUCTIONMore than 50 % of all wear‐related failures of<strong>in</strong>dustrial equipment are caused by abrasivewear [1]. The estimated costs of abrasive wearare between 1 and 4 % of the gross nationalproduct of an <strong>in</strong>dustrialized nation [2]. For thesereasons, the abrasive wear resistance is a subjectof great importance <strong>in</strong> many <strong>in</strong>dustries, such asagriculture, m<strong>in</strong><strong>in</strong>g, m<strong>in</strong>eral process<strong>in</strong>g etc.Hardfac<strong>in</strong>g could be def<strong>in</strong>ed as “coat<strong>in</strong>gdeposition process <strong>in</strong> which a wear resistant,usually harder, material is deposited on thesurface of a component by some of the weld<strong>in</strong>gtechniques”. In most cases, hardfac<strong>in</strong>g is used forcontroll<strong>in</strong>g abrasive and erosive wear, like <strong>in</strong>m<strong>in</strong><strong>in</strong>g, crush<strong>in</strong>g and gr<strong>in</strong>d<strong>in</strong>g, and agriculture<strong>in</strong>dustries (buckets, bucket teeth, mill hammers,ball mills, digg<strong>in</strong>g tools, conveyer screws, etc.[3,4]). Hardfac<strong>in</strong>g is also used to controlcomb<strong>in</strong>ations of wear and corrosion, asencountered by mud seals, plows, knives <strong>in</strong> thefood process<strong>in</strong>g <strong>in</strong>dustry, pumps handl<strong>in</strong>gcorrosive liquids, or slurries [5]. The hardfac<strong>in</strong>gis considered as economical way to improve the123
A. Vencl at al., Tribology <strong>in</strong> Industry Vol. 35, No. 2 (2013) 123‐127performance of components submitted to severewear conditions, with wide range of applicablefiller materials [6,7].The iron‐based filler materials have drawn muchattention due to their low cost and goodresistance to abrasion <strong>in</strong> the hardfacedcondition. However, their use is limited <strong>in</strong>applications where high impact load<strong>in</strong>g ispresent, i.e. high‐stress or goug<strong>in</strong>g abrasion [8].For this reason, efforts are be<strong>in</strong>g made towardsthe improvement of their impact and otherproperties [9]. The progress is achieved mostlyby modify<strong>in</strong>g the hardfaced coat<strong>in</strong>g’s structure.Tak<strong>in</strong>g <strong>in</strong>to account their low price andimproved properties, the resistance to abrasivewear of the iron‐based hardfaced coat<strong>in</strong>gs isnormally tested aga<strong>in</strong>st the resistance of proven,but more expensive materials, such as WC‐basedhardfaced coat<strong>in</strong>gs.Abrasive wear has been def<strong>in</strong>ed as “wear bydisplacement of material from surfaces <strong>in</strong>relative motion caused by the presence of hardparticles either between the surfaces orembedded <strong>in</strong> one of them, or by the presence ofhard protuberances on one or both of thesurfaces” [10]. The second part of this def<strong>in</strong>itioncorresponds to pure two‐body abrasion, wheretested material slides aga<strong>in</strong>st harder androugher counter face material, while the firstpart corresponds to the three‐ and two‐bodyabrasion, respectively. Another <strong>in</strong>terest<strong>in</strong>gexample of two‐body abrasion is the abrasiveerosion, which is the special case of erosivewear. Abrasive erosion has been def<strong>in</strong>ed as“erosive wear <strong>in</strong> which the loss of material froma solid surface is due to relative motion of solidparticles which are entra<strong>in</strong>ed <strong>in</strong> a fluid, mov<strong>in</strong>gnearly parallel to a solid surface” [10]. Scratchtest offers a possibility for comparison ofdifferent materials relatively easy and <strong>in</strong> shortperiod of time, with good reproducibility [11]. Ins<strong>in</strong>gle‐pass scratch test a stylus (which tip ismade of hard material) slide over the testsample produc<strong>in</strong>g a s<strong>in</strong>gle scratch, which seemsto be appropriate simulation of the two‐bodyabrasion.In this study, the abrasive wear resistance of thethree different hardfaced coat<strong>in</strong>gs (two ironbasedand one WC‐based) was <strong>in</strong>vestigated andcompared.2. EXPERIMENTAL DETAILS2.1 MaterialsThe filler materials (coat<strong>in</strong>g materials) weremanufactured by Castol<strong>in</strong> Eutectic Co. Ltd, Vienna.Their nom<strong>in</strong>al chemical composition is shown <strong>in</strong>Table 1. The iron‐based filler materials (basiccovered electrodes) were deposited by us<strong>in</strong>g theshielded metal arc weld<strong>in</strong>g (SMAW) process. TheWC‐based filler material was deposited by oxy‐fuelgas weld<strong>in</strong>g (OFW) process. The substratematerial was the hot‐rolled S355J2G3 steel.Table 1. Coat<strong>in</strong>gs composition, process and hardness.Coat<strong>in</strong>gNom<strong>in</strong>al chemicalcompositionHardfac<strong>in</strong>gprocessHardnessHV 54541 Fe‐Cr‐C‐Si SMAW 7395006 Fe‐Cr‐C‐Si SMAW 7817888 T WC‐Ni‐Cr‐Si‐B OFW 677All coat<strong>in</strong>gs were deposited by hardfac<strong>in</strong>g <strong>in</strong> as<strong>in</strong>gle pass (one layer). The substratepreparation and hardfac<strong>in</strong>g procedures(deposition parameters) are describedelsewhere [9,12]. The measurements of nearsurfacehardness are performed on the crosssectionof hardfaced samples by Vickers<strong>in</strong>denter (HV 5), and presented <strong>in</strong> (Table 1).The samples for structure characterization areobta<strong>in</strong>ed by cutt<strong>in</strong>g the hardfaced materialsperpendicular to coat<strong>in</strong>gs surface. The obta<strong>in</strong>edcross‐sections are ground with SiC abrasive papersdown to P1200 and polished with alum<strong>in</strong>asuspensions down to 1 μm. The polished surfacesare analyzed by us<strong>in</strong>g the scann<strong>in</strong>g electronmicroscope (SEM) equipped with energy dispersivesystem (EDS). The SEM‐EDS analysis wasperformed at University of Belgrade, Faculty ofM<strong>in</strong><strong>in</strong>g and Geology by us<strong>in</strong>g the JEOL JSM–6610LVSEM connected with the INCA350 energydispersion X‐ray analysis unit. The electronacceleration voltage of 20 kV and the tungstenfilament were used. Before SEM‐EDS analysis wasperformed, polished surfaces were 20 nm goldcoated <strong>in</strong> a vacuum chamber by use of a sputtercoater device.The Fig. 1a shows the near‐surface structure of the4541 iron‐based hardfaced coat<strong>in</strong>g. The primaryaustenite phase occupies more than a half ofvolume (50.7 vol. %) and the rest is the lamellareutectic mixture of austenite and Cr‐carbides [9].124
A. Vencl at al., Tribology <strong>in</strong> Industry Vol. 35, No. 2 (2013) 123‐127Fig. 1. The structures (SEM) of: (a) 4541, (b) 5006 and (c) 7888 T hardfaced coat<strong>in</strong>g; back‐scattered electron images.The 5006 material dur<strong>in</strong>g solidification achievesnear‐eutectic structure (Fig. 1b). A smallspherical primary Cr‐carbides are observed (9.1vol. %) <strong>in</strong> the eutectic matrix. Based on electronmicroprobe analysis (EMPA), both coat<strong>in</strong>gs 4541and 5006 conta<strong>in</strong> (Cr,Fe) 7 C 3 primary andeutectic carbides. The Figure 1c shows a largerWC gra<strong>in</strong>s (60 vol. %), which are embedded <strong>in</strong>the Ni‐Cr based matrix.2.2 Scratch abrasion test<strong>in</strong>gAbrasive wear tests are carried out on thescratch tester under the dry conditions, <strong>in</strong>ambient air at room temperature (≈ 25 °C). Aschematic diagram of scratch test<strong>in</strong>g is presented<strong>in</strong> Figure 2. Stylus (<strong>in</strong>denter) was pressed withselected normal load (10, 50 and 100 N) aga<strong>in</strong>stsurface of the test sample and moved withconstant speed (4 mm/s), produc<strong>in</strong>g the scratchof certa<strong>in</strong> width and length (10 mm) on the testsample. Indenter had Rockwell shape and thecone was diamond with radius of 0.2 mm.Fig. 2. Schematic diagram of scratch test<strong>in</strong>g.On surface of each material under <strong>in</strong>vestigationat least three scratches are made with a gapbetween scratches of at least 1 mm. Before andafter test<strong>in</strong>g, both the <strong>in</strong>denter and the testsamples are degreased and cleaned withbenzene. The wear scar widths on the surface ofthe test samples are measured from SEM imagesat the end of test<strong>in</strong>g. The wear scar widths andthe known <strong>in</strong>denter geometry are used tocalculate the volume loss. After test<strong>in</strong>g, themorphology of the test samples worn surfaces isexam<strong>in</strong>ed with SEM.3. RESULTS AND DISCUSSIONThe results of the wear tests are presented <strong>in</strong>Figures 3, 4 and 5. Tak<strong>in</strong>g <strong>in</strong>to account significantdifferences <strong>in</strong> structure homogeneity of thehardfaced coat<strong>in</strong>gs (Fig. 1), the repeatability ofthe results, <strong>in</strong> terms of standard deviations, issatisfactory (with<strong>in</strong> 16 %). Wear rate of thetested materials (volume loss divided by scratchlength) <strong>in</strong>creases with normal load<strong>in</strong>g, asexpected. The highest wear exhibits coat<strong>in</strong>g 7888T. Nevertheless, wear rates for all coat<strong>in</strong>gs arehigh, even for abrasive wear. The reason for thisis primarily due to the experimental conditions.The test conditions were specific, i.e. the speedswere very low (4 mm/s) and the contactstresses very high. At the end of test, the normalstresses were between 2 and 5 GPa, whichdepends on the material, i.e. scratch width andapplied normal load. With these conditions, ahigh‐stress or even goug<strong>in</strong>g abrasion can beexpected. With high‐stress abrasion, the wornsurface may exhibit vary<strong>in</strong>g degrees ofscratch<strong>in</strong>g with plastic flow of sufficientlyductile phases or fracture of brittle phases. Ingoug<strong>in</strong>g abrasion, the stresses are higher thanthose <strong>in</strong> high‐stress abrasion, and they areaccompanied by large particles removal from thesurface, leav<strong>in</strong>g deep groves and/or pits [8].The relation between the wear rate and thehardness of tested hardfaced coat<strong>in</strong>gs is shown<strong>in</strong> Figure 6. The first feature is that the abrasivewear rate decreases as the hardness <strong>in</strong>creases,i.e. the hardest material (coat<strong>in</strong>g 5006) showedthe highest abrasive wear resistance.125
A. Vencl at al., Tribology <strong>in</strong> Industry Vol. 35, No. 2 (2013) 123‐1273.23.50Wear rate, mm 3 /m2.82.42.01.6Coat<strong>in</strong>g 4541(v = 4 mm/s)1.88Wear rate, mm 3 /m3.002.502.001.502.881.241.8810 N50 N100 N1.671.20.80.751.000.500.210.750.680.10 0.090.40.00.1010 50 100Normal load, NFig. 3. Wear rates of coat<strong>in</strong>g 4541 for differentnormal loads.Wear rate, mm 3 /m3.22.82.42.01.6Coat<strong>in</strong>g 5006(v = 4 mm/s)1.670.00670 690 710 730 750 770 790Hardness HV5Fig. 6. Wear rate vs. hardness of tested materials fordifferent normal loads.For all applied loads, the relation betweenhardness and wear rate is non‐l<strong>in</strong>ear. It is morecurved for higher loads (Fig. 6). This is connectedwith the coat<strong>in</strong>gs structure and exhibited wearmechanism. Coat<strong>in</strong>gs 4541 and 5006 exhibitma<strong>in</strong>ly plough<strong>in</strong>g abrasive wear (Fig. 7a), whilecoat<strong>in</strong>g 7888 T dom<strong>in</strong>ant type of abrasive wear isfracture (crack<strong>in</strong>g) abrasive wear (Fig. 7b).1.20.80.680.40.00.0910 50 100Normal load, NFig. 4. Wear rates of coat<strong>in</strong>g 5006 for differentnormal loads.Wear rate, mm 3 /m3.22.82.42.01.61.2Coat<strong>in</strong>g 7888 T(v = 4 mm/s)1.242.880.80.40.210.010 50 100Normal load, NFig. 5. Wear rates of coat<strong>in</strong>g 7888 T for differentnormal loads.Fig. 7. The wear scar appearance (SEM) of: (a) 4541and (b) 7888 T hardfaced coat<strong>in</strong>g; 50 N normal load;back‐scattered electron images.126
A. Vencl at al., Tribology <strong>in</strong> Industry Vol. 35, No. 2 (2013) 123‐1274. CONCLUSIONScratch test offers relatively easy and quickcomparison of different materials on abrasive wear.Structure of tested coat<strong>in</strong>gs showed <strong>in</strong>fluence onthe dom<strong>in</strong>ant type of abrasive wear, whichtogether with coat<strong>in</strong>gs hardness determ<strong>in</strong>edcoat<strong>in</strong>gs abrasive wear resistance.Coat<strong>in</strong>gs with lower hardness showed lowerabrasive wear resistance, but the dependence(hardness vs. wear rate) was non‐l<strong>in</strong>ear.In the case of iron‐based coat<strong>in</strong>gs, dom<strong>in</strong>anttype of abrasive wear was plough<strong>in</strong>g and <strong>in</strong> thecase of WC‐based coat<strong>in</strong>gs, it was fracture(crack<strong>in</strong>g) abrasive wear.AcknowledgementThis work has been performed as a part ofactivities with<strong>in</strong> the projects TR 34028, TR35021 and TR 35034. These projects aresupported by the Republic of Serbia, M<strong>in</strong>istry ofEducation, Science and TechnologicalDevelopment, whose f<strong>in</strong>ancial help is gratefullyacknowledged.REFERENCES[1] A. Rac: Osnovi tribologije, Maš<strong>in</strong>ski fakultetUniverziteta u Beogradu, Beograd, 1991.[2] R.G. Bayer: Fundamentals of wear failures, <strong>in</strong>:ASM Handbook Volume 11, Failure Analysis andPrevention, ASM International, Metals Park, pp.901‐905, 2002.[3] V. Lazić, M. Jovanović, D. Milosavljević, M.Mutavdžić, R. Čukić: Choos<strong>in</strong>g of the mostsuitable technology of hard fac<strong>in</strong>g of mixer bladesused <strong>in</strong> asphalt bases, Tribology <strong>in</strong> Industry, Vol.30, No. 1‐2, pp. 3‐10, 2008.[4] V. Lazić, M. Mutavdžić, D. Milosavljević, S.Aleksandrović, B. Nedeljković, P. Mar<strong>in</strong>ković, R.Čukić: Selection of the most appropriate technologyof reparatory hard fac<strong>in</strong>g of work<strong>in</strong>g parts onuniversal construction mach<strong>in</strong>ery, Tribology <strong>in</strong>Industry, Vol. 33, No. 1, pp. 18‐27, 2011.[5] J.R. Davis, Hardfac<strong>in</strong>g, weld cladd<strong>in</strong>g, anddissimilar metal jo<strong>in</strong><strong>in</strong>g, <strong>in</strong>: ASM HandbookVolume 6, Weld<strong>in</strong>g, Braz<strong>in</strong>g, and Solder<strong>in</strong>g, ASMInternational, Metals Park, pp. 789‐829, 1993.[6] EN 14700: Weld<strong>in</strong>g consumables – Weld<strong>in</strong>gconsumables for hard‐fac<strong>in</strong>g, EuropeanCommittee for Standardization, Brussels, 2005.[7] M. Šolar, M. Bregant: Dodatni materijali i njihovaupotreba kod reparaturnog navarivanja,Zavarivanje i zavarene konstrukcije, Vol. 51, No.2, pp. 71‐76, 2006.[8] A. Vencl, N. Manić, V. Popovic, M. Mrdak:Possibility of the abrasive wear resistancedeterm<strong>in</strong>ation with scratch tester, TribologyLetters, Vol. 37, No. 3, pp. 591‐604, 2010.[9] B.R. Gligorijevic, A. Vencl, B.T. Katavic:Characterization and comparison of the carbidesmorphologies <strong>in</strong> the near surface region of thes<strong>in</strong>gle‐ and double layer iron‐based hardfacedcoat<strong>in</strong>gs, Scientific Bullet<strong>in</strong> of the "Politehnica"University of Timișoara, Transactions onMechanics, Vol. 57 (71), Special Issue S1, pp. 15‐20, 2012.[10] OECD, Research Group on Wear of Eng<strong>in</strong>eer<strong>in</strong>gMaterials, Glossary of Terms and Def<strong>in</strong>itions <strong>in</strong>the Field of Friction, Wear and Lubrication:T<strong>tribology</strong>, Organisation for Economic Cooperationand Development, Paris, 1969.[11] A. Vencl, A. Rac, B. Ivković: Investigation ofabrasive wear resistance of ferrous‐basedcoat<strong>in</strong>gs with scratch tester, Tribology <strong>in</strong>Industry, Vol. 29, No. 3‐4, pp. 13‐16, 2007.[12] A. Alil, B. Katavić, M. Ristić, D. Jovanović, M.Prokolab, S. Budimir, M. Kočić: Structural andmechanical properties of different hard weldedcoat<strong>in</strong>gs for impact plate for ventilation mill,Weld<strong>in</strong>g & Material Test<strong>in</strong>g, Vol. 20, No. 3, pp. 7‐11, 2011.127
Vol. 35, No. 2 (2013) 128‐133Tribology <strong>in</strong> Industrywww.<strong>tribology</strong>.f<strong>in</strong>k.rsRESEARCHTribological Study of Biocompatible Hybrid OrganicMolecules Film with Antibacterial EffectJ.H. Horng a , C.C. Wei a , S.Y. Chern a , W.H. Kao b , K.W. Chen a , Y.S. Chen aa Department of Power Mechanical Eng<strong>in</strong>eer<strong>in</strong>g, National Formosa University, Taiwan,b Institute of Mechatronoptic Systems, Chienkuo Technology University, Taiwan.Keywords:Self‐assembled monolayerAdhesion forceAntifoul<strong>in</strong>gContact angleAnti‐bacterialCorrespond<strong>in</strong>g author:J. H. HorngNational Formosa University,Department of Power MechanicalEng<strong>in</strong>eer<strong>in</strong>g,No.64, Wenhua Rd., Huwei Township,Yunl<strong>in</strong> County 632, Taiwan,E‐mail: jhhorng@gmail.comA B S T R A C TOptical glass is widely used <strong>in</strong> bioeng<strong>in</strong>eer<strong>in</strong>g and various utilities such aspublic touchscreen displays and mobile devices. This work evaluates thefeatures of anti‐bacterial and anti‐adhesion on Octadecyltrichlorosilane(OTS) material that was mixed with a biocompatible antibacterial agentcoated on the optical glass. Test samples were allocated to different bathand dry<strong>in</strong>g temperatures as well as reaction times. Results show that <strong>in</strong>angle contact experiments, pure OTS films and mixed antibacterial filmshave almost the same contact angle of about 105° under the conditions of a12 hour reaction time and 80 °C reaction temperature. The antibacterialtest <strong>in</strong>dicated the follow<strong>in</strong>g order: antibacterial agent> OTS+ antibacterialagent (50 %) > OTS+ antibacterial agent (10 %) > OTS. At the sameoperation condition, OTS mixed with 50 % antibacterial agent was able to<strong>in</strong>crease the adhesion force between the OTS film and lens. This suggeststhat surface treatment of optical lenses <strong>in</strong>volv<strong>in</strong>g OTS with 50 %antibacterial solution is the most effective for <strong>in</strong>creas<strong>in</strong>g antifoul<strong>in</strong>g andantibacterial functions while simultaneously‐ enhanc<strong>in</strong>g the adhesionfunction between films and lens surfaces.© 2013 Published by Faculty of Eng<strong>in</strong>eer<strong>in</strong>g1. INTRODUCTIONThe uses of self‐assembled monolayer (SAMs) <strong>in</strong>biomedic<strong>in</strong>e utilities have been <strong>in</strong>creas<strong>in</strong>grapidly, such as <strong>in</strong> biosensors, non‐foul<strong>in</strong>gsurfaces, bioactive surfaces, and drug delivery[1,2]. The OTS monolayer is one of the mostextensively studied self‐assembled monolayers[3‐5]. Therefore, how to improve the adhesionand anti‐bacterial performance of SAM films hasbecome an attractive topic <strong>in</strong> order to enhancedevice application and reliability. Bierbum [6,7]noted that the substrate surface water layers arean important factor <strong>in</strong> the formation of OTSfilms. Bierbum expla<strong>in</strong>ed that OTS molecules<strong>in</strong>itially spread vertically on substrate surfacesand then cluster after locat<strong>in</strong>g activationpositions. Subsequently, other OTS moleculesspread to cluster edges and form islands. Themolecules then spread outwards and causeadsorbed molecules to form connections, f<strong>in</strong>allyform<strong>in</strong>g tightly connected monolayers. In 1998,Vaillant et al. [8] used atomic force microscopy(AFM) and a Fourier‐transform <strong>in</strong>frared128
J.H. Horng et al., Tribology <strong>in</strong> Industry Vol. 35, No. 2 (2013) 128‐133spectrometer (FTIR) to observe the process bywhich OTS molecules form films on substratesurfaces. Results showed that a larger amountof water <strong>in</strong> the solutions cause the OTSmolecules to undergo a hydrolysis reaction andproduce polymerization with<strong>in</strong> the solution,lead<strong>in</strong>g to cloud‐shaped or island‐shapedmolecular films be<strong>in</strong>g formed throughout thesolution. In contrast, solutions withcomparatively low proportions of water exhibitpo<strong>in</strong>t distributions and chaotically grown OTSmolecules that organize <strong>in</strong>to a liquid‐like form.While surface diffusion renders OTS moleculesas absorb<strong>in</strong>g molecules with<strong>in</strong> a solution, thetightly knit, island‐shaped structures are formedby messy molecule films.Resch [9] also used AFM and found that OTSmolecules <strong>in</strong>itially grow chaotically andirregularly. With the passage of time, moleculescover<strong>in</strong>g the surface spread horizontally andultimately form tightly arranged molecular films.Carraro et al. [10] exam<strong>in</strong>ed the formation of OTSSAMs under different ambient temperatures.They discovered that when the ambienttemperature falls below 16 °C, OTS first formsislands or clouds and then films; by contrast,when the ambient temperature rises above 40 °C,the films grow evenly <strong>in</strong>stead of form<strong>in</strong>g islands.However, films form more quickly at lowertemperatures. The formation of an OTSmonolayer on a material surface is highlysensitive to several factors, <strong>in</strong>clud<strong>in</strong>g thedensity of surface hydroxyl groups, reactiontemperature, reaction environment, reactiontime, solvent used to deposit OTS, water contentof the solvent, concentration of OTS, solution age,roughness of the underly<strong>in</strong>g substrate, andclean<strong>in</strong>g procedures after SAM deposition [11].The ma<strong>in</strong> requirements that must be satisfied byall bioeng<strong>in</strong>eer<strong>in</strong>g surfaces are corrosionresistance, biocompatibility, bioadhesion, andbiofunctionality [12]. In particular, forlubrication motion devices, the biodegradable,bioadhesion and anti‐bacterial functions of thesurface and lubricant have become topics ofgreat research <strong>in</strong>terest for <strong>in</strong>dustrial application[13,14]. Therefore, how to improve thebiocompatibility, adhesion and anti‐bacterialperformance of SAM films has become anattractive task <strong>in</strong> order to enhance deviceapplication and reliability.2. EXPERIMENTALThe optical lenses were ultrasonicated <strong>in</strong>acetone and sequentially r<strong>in</strong>sed withtetrahydrofuran solvent and deionized water(DI) and then immediately dipped <strong>in</strong> the OTSsolution conta<strong>in</strong><strong>in</strong>g approximately 40 ml. Forthe preparation of SAM films, OTS wasdissolved <strong>in</strong> alcohol and prepared to a molarconcentration of 10 mM, and then mixed withdifferent proportions of antibacterial agent (10% and 50 %). The test pieces were placed <strong>in</strong> thesolutions at different bath temperatures andduration times, but both with a dry<strong>in</strong>g time of10 m<strong>in</strong>. The test pieces were then removed andset aside for 12 hrs before be<strong>in</strong>g ultrasonicated<strong>in</strong> acetone for 5 m<strong>in</strong> to remove any looselybound material; after which, they were r<strong>in</strong>sed <strong>in</strong>DI water and blown dry with nitrogen gas. Themolecular structure of OTS is shown <strong>in</strong> Table 1,which reveals that its hydrophobic propertiescome from the term<strong>in</strong>al group (CH 3 ). The ma<strong>in</strong>composition of the biocompatible antibacterialagent is bioflavonoids and citric acid, whichcome from plants.Table 1. The molecular structure of OTS.SAMsMolecular formulaHeadgroupTerm<strong>in</strong>al groupOTS CH3(CH2)17SiCl3 ‐SiCl3 ‐CH3Fig. 1. Contact angle equipment.For the experimental <strong>in</strong>vestigation ofhydrophobic properties for the different surfacefilms on the lens, FTA contact angle equipmentwas used to measure the contact angle, as shown<strong>in</strong> Fig. 1. A larger contact angle <strong>in</strong>dicates betterhydrophobic and anti‐foul<strong>in</strong>g properties of129
J.H. Horng et al., Tribology <strong>in</strong> Industry Vol. 35, No. 2 (2013) 128‐133surfaces, and contact angles were measured onboth sides of the water drop. Droplet profileswere captured us<strong>in</strong>g a video comprised of digitalframes over a period of 12 seconds andtransferred to a computer for anglemeasurement. The adhesion force betweensurface films and substrates were measuredus<strong>in</strong>g atomic force microscopy (AFM) <strong>in</strong> scratchmode. AFM was also used to exam<strong>in</strong>e samples’topography before and after SAM deposition bythe non‐contact mode.(b)3. RESULTS AND DISCUSSIONIn the contact angle analysis of variousoperation conditions, the measurement data ofeach test piece was obta<strong>in</strong>ed from the mean offive measurements. Figure 2(a) is a photo of thecontact angle for the orig<strong>in</strong>al lens, while Fig. 2(b)is a photo of the contact angle for the OTSmaterial. One can f<strong>in</strong>d that the OTS film caneffectively <strong>in</strong>crease the lens surface contactangle. Figure 2(c) shows that the contact anglechanges with various reaction times and bathetemperatures. More specifically, it shows thatthe higher the bath temperature, the higher thecontact angle; and further, the longer thereaction time, the higher the contact angle.However, the variation of contact angles for theOTS+50 % antibacterial agent films undervarious reaction time conditions are all quitelow. The difference <strong>in</strong> contact angle betweenreaction times of 12 hours and 24 hours is verysmall, so this is not shown <strong>in</strong> the figure. Bath<strong>in</strong>gOTS+50 % agent films at a bath temperature of80 °C gradually <strong>in</strong>creased the contact angle toapproximately 105 degrees. The variousreaction times and bath temperature have verylittle <strong>in</strong>fluence on the contact angle.Contact Angle (deg)120906030020 40 60 80Temperature ( o C)(c)Fig. 2. Contact angles (a) photo of orig<strong>in</strong>al lens; (b)photo of OTS film; and, (c) comparison chart fordifferent reaction times and temperatures.X‐ray photoelectron spectroscopy (XPS) detection,as shown <strong>in</strong> Fig. 3, confirmed that OTS materialbonds on the lens surface [11]. In summary, abath temperature of 80 °C and duration time of12 hours was chosen as the operation condition<strong>in</strong> order to <strong>in</strong>vestigate the antibacterialcharacteristics of the surface film on lenses.60000O1s C1s Si 2sSi 2p40000Counts / s20000(a)01200 1000 800 600 400 200 0B<strong>in</strong>d<strong>in</strong>g Energy(eV)Fig. 3. XPS spectrum diagram of the OTS film at the bathtemperature of 80 °C and duration time of 12 hours.130
J.H. Horng et al., Tribology <strong>in</strong> Industry Vol. 35, No. 2 (2013) 128‐133The various roughness values of differentsurface materials are shown <strong>in</strong> Fig. 4. Roughnesstests were conducted <strong>in</strong> air at a relativehumidity of about 50 % us<strong>in</strong>g AFM <strong>in</strong> the noncontactmode, where the scanned detectionrange was 40 µm × 40 µm. The various surfaceroughness values of different surface materialsare shown <strong>in</strong> Fig. 4(a). The comparison chartshows that the antibacterial agent can decreasethe surface roughness value of pure OTS films.The surface roughness value of the OTS film<strong>in</strong>corporat<strong>in</strong>g 10 % antibacterial agent isapproximately 175 nm, whereas the OTS filmroughness value with 50 % antibacterial agentdecreased to approximately 100 nm. The 3‐Dtopography image for the hybrid organicmolecular film (OTS + 50 % agent) is shown <strong>in</strong>Fig. 4(b). Island‐shaped structures formed onthe surface, as mentioned <strong>in</strong> Vaillant’s work [8],which shows that hybrid organic films exhibituniform surface coverage with regular patternsof island formations. This <strong>in</strong>dicates that theantibacterial agent was absorbed and stored <strong>in</strong>the topographic valleys of the OTS film.250200LensOTSOTS + 10% agentOTS + 50% agentThe reliability and beauty requirements of thedisplay elements for manufacture becomeimportant <strong>in</strong> their service life. The lighttransmittance and film adhesion properties areone of the key performance <strong>in</strong>dices of lenses. Inorder to explore the relation between surfacefilm and light transmittance of a lens, Fig. 5shows that transmittance of the OTS film andantibacterial agent on the lens. Results <strong>in</strong>dicatethat the OTS surface film slightly decreases thelight transmittance of the orig<strong>in</strong>al lens; however,the antibacterial agent has very little <strong>in</strong>fluenceon transmittance. The m<strong>in</strong>imum value oftransmittance is 93.6 % for the film of OTS + 50 %agent film. This verifies that all transmittances ofsurface films are acceptable for <strong>in</strong>dustrialapplications and life utilities <strong>in</strong> our work.Transmittance (%)120100806040LensOTSOTS + 10% agentOTS + 50% agentRa (nm)15010020Fig. 5. Light transmittance of different surface filmson lenses.500(a)120110100OTSOTS + 10% agentOTS + 50% agentR a =102 nmCritical Load ( N)9080706050Fig. 6. Critical loads between surface films and substrate.(b)Fig. 4. (a)Roughness values of the different surfacefilms; and, (b) 3‐D topography image of the OTS + 50% antibacterial agent film.Film adhesion is another key performance <strong>in</strong>dex oflenses for reliability. Figure 6 shows the effect ofthe antibacterial agent on the critical load ofsurface films on the lens. The scratch tests <strong>in</strong>dicatethat high critical loads of films have high resistanceaga<strong>in</strong>st film wear out. It shows that the131
J.H. Horng et al., Tribology <strong>in</strong> Industry Vol. 35, No. 2 (2013) 128‐133antibacterial agent <strong>in</strong>creases the critical loadbetween the OTS film and lens. Mix<strong>in</strong>g theantibacterial agent (50 %) <strong>in</strong> the OTS material<strong>in</strong>creases the critical load to approximately 104N.In summary, the surface treatment of opticallenses <strong>in</strong>volv<strong>in</strong>g OTS+ Agent (50 %) is the mostcapable of effectively <strong>in</strong>creas<strong>in</strong>g the anti‐adhesionfunction between films and lens surfaces.the OTS + 50 % agent film. The SA number onthe mixed film is less than that on the generallens. Figure 7(c) is the comparison chart of thebacteria count for the different surface films. Forthe general lens surface, the bacteria count isabout 135,000 after 24 hours. The pure OTS filmalso has little antibacterial function, and showsthat the bacteria count on OTS with 50 %antibacterial agent and the pure antibacterialagent surface is less than 10. This is far lower thanthe bacteria value of 5.3 × 10 4 on the OTS film.4. CONCLUSIONPlate Count No.16000012000080000400000(a)(b)LenseOTSOTS + 10% agentOTS + 50% agentagent(c)Fig. 7. (a)Bacterial growth situation on orig<strong>in</strong>al lens;(b) bacterial growth situation on the OTS film; (c)effect of surface film material with antibacterial.In the antibacterial tests, staphylococcus aureus(SA) were <strong>in</strong>oculated with different selfassembledfilms; and then after 24 hours,bacteria values were measured (Japan standard:JISZ 2801:2010). Figures 7(a) and (b) show thegrowth situation of SA on the general lens and
J.H. Horng et al., Tribology <strong>in</strong> Industry Vol. 35, No. 2 (2013) 128‐133[3] A.N. Parikh, D.L. Allara, I.B. Azouz, F. Rondelez: AnIntr<strong>in</strong>sic Relationship between Molecular Structure<strong>in</strong> Self‐Assembled n‐Alkylsiloxane Monolayers andDeposition Temperature, Journal of PhysicalChemistry, Vol. 98, pp. 7577‐7590, 1994.[4] C. Carraro, O.W. Yauw, M.M. Sung and R.Maboudian: Observation of Three GrowthMechanisms <strong>in</strong> Self‐Assembled Monolayers,Journal of Physical Chemistry B, Vol. 102, pp.4441‐4445, 1998.[5] R. Brambilla, F. Silveira, J. Santos: Investigat<strong>in</strong>gmorphological changes on octadecylmodifiedsilicas by SEM and AFM, ModernResearch and Educational Topics <strong>in</strong> Microscopy,pp. 626‐633, 2007.[6] P. Silberzan, L. leger, D. Auserre, J.J. Benatter:Silanation of Silica Surfaces. A New Method ofConstruct<strong>in</strong>g Pure or Mixed Monolayers,Langmuir, Vol. 7, pp. 1647‐1651, 1991.[7] K. Bierbaum, M. Grunze, A.A. Baski, L.F. Chi, W.Schrepp, H. Fuchs: Growth of self‐assembled n‐alkyltrichlorosilane films on Si (100) <strong>in</strong>vestigatedby atomic force microspcopy, Langmuir, Vol. 11,pp. 2143‐2150, 1995.[8] T. Vallant: Formation of Self‐AssembledOctadecylsiloxane Monolayers on Mica and SiliconSurfaces Studied by Atomic Force Microscopy andInfrared Spectroscopy, Journal of PhysicalChemistry B, Vol. 102, pp. 7190‐7197, 1998.[9] R. Resch, M. Grasserbauer, G. Friedbacher, T.h.Vallant, H. Brunner, U. Mayer, H. Hoffmann: Insitu and ex situ AFM <strong>in</strong>vestigation of the formationof octadecylsiloxane monolayer, Applied SurfaceScience, Vol. 140, pp. 168‐175, 1999.[10] C. Carraro, O.W. Yauw, M.M. Sung, R. Maboudian:Observation of Three Growth Mechanisms <strong>in</strong> Self‐Assemble Monolayers, Journal of PhysicalChemistry B, Vol. 102, pp. 4441‐4445, 1998.[11] G. Mani, D.M. Feldman, O. Sunho, C.M. Agrawal:Surface modification of cobalt‐chromiumtungsten‐nickelalloy us<strong>in</strong>goctadecyltrichlorosilanes, Applied SurfaceScience, Vol. 255, pp. 5961‐5970, 2009.[12] F. Zivic, M. Babic, N. Grujovic, S. Mitrovic:Tribometry of Materials for Bioeng<strong>in</strong>eer<strong>in</strong>gApplications, Tribology <strong>in</strong> Industry, Vol. 32, No. 1,pp. 25‐32, 2010.[13] N.J. Fox, G.W. Stachowiak: Vegetable oil‐basedlubricants ‐ a review of oxidation, TribologyInternational, Vol. 40, No. 7, pp. 1035–1046, 2007.[14] B. Chen, N. Zhang, K. Liang, J. Fang: EnhancedBiodegradability, Lubricity and Corrosiveness ofLubricat<strong>in</strong>g Oil by Oleic Acid DiethanolamidePhosphate, Tribology <strong>in</strong> Industry, Vol. 34, No. 3,pp. 152‐157, 2012.133
Vol. 35, No. 2 (2013) 134‐140Tribology <strong>in</strong> Industrywww.<strong>tribology</strong>.f<strong>in</strong>k.rsRESEARCHTribological Characterisation of PBT + Glass BeadComposites with the Help of Block‐on‐R<strong>in</strong>g TestC. Georgescu a , M. Botan a , L. Deleanu aa ”Dunarea de Jos” University of Galati, Romania.Keywords:PBT compositeTribological behaviourAntifoul<strong>in</strong>gBlock‐on‐r<strong>in</strong>g testDry slid<strong>in</strong>gCorrespond<strong>in</strong>g author:C. Georgescu”Dunarea de Jos” University of Galati,RomaniaE‐mail: constant<strong>in</strong>.georgescu@ugal.roA B S T R A C TThe materials <strong>in</strong>volved <strong>in</strong> this research study were produced by diemould<strong>in</strong>g <strong>in</strong> order to obta<strong>in</strong> bone samples type 1A (SR EN ISO 527‐2:2003). These composites have a matrix of polybutylene terephthalate(PBT) commercial grade Crast<strong>in</strong> 6130 NC010, DuPont. The values for theglass beads concentrations were established at 10 % and 20 %(wt).Block‐on‐r<strong>in</strong>g tests were run <strong>in</strong> order to characterize the tribologicalbehaviour of this friction couple (PBT and PBT composites with glassbeads on steel). The block was manufactured by cutt<strong>in</strong>g parts from thebone samples, hav<strong>in</strong>g the dimensions of 16.5 mm × 10 mm × 4 mm. Theother triboelement was the external r<strong>in</strong>g of the tapered roll<strong>in</strong>g bear<strong>in</strong>gKBS 30202, hav<strong>in</strong>g dimensions of Ø35 mm × 10 mm and was made ofsteel grade DIN 100Cr6. There were analysed the follow<strong>in</strong>gcharacteristics: friction coefficient (mean value over a test andscatter<strong>in</strong>g range), wear (wear rate). There are also presented particularaspects of the worn surfaces, as <strong>in</strong>vestigated from SEM images.© 2013 Published by Faculty of Eng<strong>in</strong>eer<strong>in</strong>g1. INTRODUCTIONMaterials based on PBT are obta<strong>in</strong>ed both byadd<strong>in</strong>g very different materials (nano and microfibre re<strong>in</strong>forcements [1], [22], metallic or/andceramic powders [21], m<strong>in</strong>erals [2‐3]), the resultcould be <strong>in</strong>cluded <strong>in</strong> the class of composites, andby blend<strong>in</strong>g with other polymers polytetrafluoroethylene(PTFE) [4], polycarbonate (PC) [5],polyethylene (PE), SAN, epoxy res<strong>in</strong>, with fireresistant additives [6], both solutions direction<strong>in</strong>gone or a set of the properties of PBT matrix.The add<strong>in</strong>g materials <strong>in</strong> PBT are very diverse,almost all types known for the polymericcomposites (long and short fibres, particles andtheir mixtures), both at micro scale and nano scale.For tribological applications, the fibre nature isalso diverse: glass, carbon, aramidic, titanates.Even if the specialized literature emphasis the<strong>in</strong>fluence of the add<strong>in</strong>g materials <strong>in</strong> PBT, uponsome mechanical characteristics (traction limitand elasticity modulus) [2‐3,7], these propertiesdo not also reflect the tribological behaviour ofthese materials. This is why the test<strong>in</strong>g of thepolymeric composites is of high importance and,even if the results could not be extrapolatedfrom the laboratory tests on tribotesters, to theactual friction couple, these studies are useful <strong>in</strong>134
C. Georgescu et al., Tribology <strong>in</strong> Industry Vol. 35, No. 2 (2013) 134‐140materials' rank<strong>in</strong>g, when the designer is <strong>in</strong>terest<strong>in</strong> a particular parameter or a set ofcharacteristics [8‐10].2. MATERIALS AND TESTING METHODOLOGYThe tested materials were produced by diemould<strong>in</strong>g <strong>in</strong> order to obta<strong>in</strong> bone samples type1A (as required by the tensile test ISO 527‐2) atthe Research Institute for Synthetic FibresSav<strong>in</strong>esti, Romania, tak<strong>in</strong>g <strong>in</strong>to account theproducer specification for mould<strong>in</strong>g and heattreatment [11].These composites have a matrix of polybutyleneterephthalate (PBT), commercial grade Crast<strong>in</strong>6130 NC010, DuPont.The recipes for the composite materials basedon PBT, <strong>in</strong>cluded <strong>in</strong> this study, were elaboratedby the authors based on up‐to‐datedocumentation [1,4,11] and were designed <strong>in</strong>order to po<strong>in</strong>t out the <strong>in</strong>fluence of matrix andadd<strong>in</strong>g materials on the tribological behaviour <strong>in</strong>dry regime. Table 1 presents their compositionsand the abbreviations used <strong>in</strong> this paper. Thepolyamide (PA) was added <strong>in</strong> low concentration<strong>in</strong> order to have a better dispersion of the microglass beads. The black carbon was added forboth technological and tribological reasons.Table 1. The tested materials.Concentration [%, wt]MaterialsymbolMicro glassBlackPBTPAbeadscarbonPBT 100 ‐ ‐ ‐GB10 88 10 1.5 0.5GB20 77.5 20 2 0.5The tests were done us<strong>in</strong>g a block‐on‐r<strong>in</strong>gtribotester, function<strong>in</strong>g on a CETR tribometerUMT‐2 Multi‐Specimen Test System.The r<strong>in</strong>g was the external r<strong>in</strong>g of the taperedroll<strong>in</strong>g bear<strong>in</strong>g KBS 30202 (DIN ISO 355/720),hav<strong>in</strong>g the dimensions of Ø35 mm × 10 mm andwas made of steel grade DIN 100Cr6, hav<strong>in</strong>g 60‐62 HRC and Ra = 0.8 μm on the exterior surface.The block was manufactured by cutt<strong>in</strong>g partsfrom the bone samples, hav<strong>in</strong>g the dimensions of16.5 mm × 10 mm × 4 mm.The tests were run <strong>in</strong> dry condition, forcomb<strong>in</strong>ation (F, v), F be<strong>in</strong>g the normally appliedload (F = 1.0 N, F = 2.5 N and F = 5.0 N) and vbe<strong>in</strong>g the slid<strong>in</strong>g speed (v = 0.25 m/s, v = 0.50m/s and v = 0.75 m/s). The slid<strong>in</strong>g distance wasthe same for all tests, L = 7500 m.For evaluat<strong>in</strong>g the mass loss of the blocks, ananalytical balance METTLER TOLEDO was used,hav<strong>in</strong>g the measur<strong>in</strong>g accuracy of 0.1 mg.The SEM images were done with the help of thescann<strong>in</strong>g electron microscope Quanta 200 3D,hav<strong>in</strong>g a resolution of 4 nm, a magnification×1.000.000.3. EXPERIMENTAL RESULTSa. Friction coefficientIn order to compare the three tested materials, theextreme values and the average value of thefriction coefficient were graphically presented <strong>in</strong>Fig. 1 as a function of the slid<strong>in</strong>g speed and thenormal load. These values (the lowest value, thehighest value and the average one) were calculatedbased on the recorded values dur<strong>in</strong>g each test(sampl<strong>in</strong>g rate be<strong>in</strong>g 10 values per second). Thus,it could be appreciated the stability of the frictioncoefficient by the size of the scatter<strong>in</strong>g <strong>in</strong>terval andan average energy consumption by the averagevalue of the friction coefficient.For actual applications work<strong>in</strong>g under similarconditions of speed and load, the author wouldrecommend the materials with a smallerscatter<strong>in</strong>g <strong>in</strong>terval and lower values of theaverage friction coefficient.The low loads and speeds produce a largerscatter<strong>in</strong>g <strong>in</strong>terval for the friction coefficient, butthe load and speed <strong>in</strong>crease makes the frictioncoefficient dim<strong>in</strong>ish the average value and tonarrow the scatter<strong>in</strong>g <strong>in</strong>terval. A research reportfrom NASA [12] had evidenced high averagevalues of the friction coefficient of over 0.6, forthree polymers slid<strong>in</strong>g aga<strong>in</strong>st steel (thetribotester: polymeric ball on steel disk).From these research reports and theexperimentally obta<strong>in</strong>ed data dur<strong>in</strong>g this study,the authors po<strong>in</strong>t out the importance of the135
C. Georgescu et al., Tribology <strong>in</strong> Industry Vol. 35, No. 2 (2013) 134‐140laboratory tests for evaluat<strong>in</strong>g the frictioncoefficient and other tribological characteristics.0.80.6µ 0.40.20.80.60.200µ 0.40.80.6µ 0.40.20TBP01BG02BGF = 1 NTBP01BG02BGTBP01BGv = 0.25 m/s v = 0.50 m/s v = 0.75 m/sMaterialTBP10BG20BGF = 2.5 NTBP10BG20BGTBP10BG02BGv = 0.25 m/s v = 0.50 m/s v = 0.75 m/sMaterialTBP10BG20BGF = 5 NTBP10BG20BGTBP10BGv = 0.25 m/s v = 0.50 m/s v = 0.75 m/sMaterialFig. 1. Variation of friction coefficient of PBT andcomposites with different micro glass beads content,for the slid<strong>in</strong>g distance L = 7500 m.PBT has the average values of the frictioncoefficient, , <strong>in</strong> the narrowest range, around thevalue 0.2. The <strong>in</strong>crease of this average could beexpla<strong>in</strong>ed by the elim<strong>in</strong>ation of the relatively bigwear particles that are characteristic for thispolymer (see Fig. 4). The values obta<strong>in</strong>ed for F =5 N are grouped under 0.2 for all the testedslid<strong>in</strong>g speeds.The composites GB10 (PBT + 10 % micro glassbeads) and GB20 (PBT + 20 % micro glass beads)have the average value of the friction coefficientscattered on larger <strong>in</strong>tervals, especially for thesmaller normal loads (F = 1 N and F = 2.5 N). For20BG20BGF = 1 N, it is hard to establish a dependencyrelation of the friction coefficient on the add<strong>in</strong>gmaterial concentration and the slid<strong>in</strong>g speed. Itcould be noticed that for blocks made of GB20,there are larger <strong>in</strong>tervals.At the slid<strong>in</strong>g speed of v = 0.25 m/s, the abrasivewear is predom<strong>in</strong>ant, the polymer be<strong>in</strong>g hung(torn) and drawn from the superficial layers asmicro‐volumes, their size be<strong>in</strong>g greater at higherspeeds (Fig. 2). At the slid<strong>in</strong>g speed of v = 0.75 m/s,the <strong>in</strong>fluence of the normal load on the averagevalue of the friction coefficient is similar: <strong>in</strong>creases from 0.12 for F = 1 N, to ~ 0.2 for F = 5 N.Fig. 2. SEM image of the block made of GB10, for v =0.25 m/s, F = 5 N, L = 7500 m.For the blocks made of GB20, under F = 2.5 N, thescatter<strong>in</strong>g of the values for the friction coefficientis the largest. The probable cause would be themicro‐cutt<strong>in</strong>g processes that will have a morereduced <strong>in</strong>tensity when the slid<strong>in</strong>g speed<strong>in</strong>creases. There were not noticed processes ofdragg<strong>in</strong>g the micro glass beads on the blocksurfaces, mean<strong>in</strong>g that the <strong>in</strong>terface between themicro glass beads and the polymeric matrix isharder to damage, as compared to, for <strong>in</strong>stance,the mobility of the micro glass beads <strong>in</strong> the slid<strong>in</strong>gdirection, but also <strong>in</strong> the depth of the superficiallayer, as noticed <strong>in</strong> test<strong>in</strong>g the composites withsame type of micro glass beads added <strong>in</strong> apolyamide matrix [13].The values of the friction coefficient have thetendency of be<strong>in</strong>g less dependent on the slid<strong>in</strong>gspeed for the normal load F = 5 N; thisrecommends these materials for an exploitation136
C. Georgescu et al., Tribology <strong>in</strong> Industry Vol. 35, No. 2 (2013) 134‐140regime with different work<strong>in</strong>g speeds(differentiated speeds imposed by thetechnological process), without hav<strong>in</strong>g verydifferent energy consumption levels when thespeed is chang<strong>in</strong>g.The extreme values of the friction coefficient arecaused by the generation and the detach<strong>in</strong>g of thewear debris, the r<strong>in</strong>g pass<strong>in</strong>g over a bigger microglass beads, an agglomeration of micro glassbeads or fragments of some broken ones on thesurface as rema<strong>in</strong>ed after a preferentialelim<strong>in</strong>ation of the polymer from the superficiallayer. In other studies on the polymericcomposites with micro glass beads, there were noreports on fractur<strong>in</strong>g the hard particles.For the composites with PBT matrix, the authorsnoticed break<strong>in</strong>gs of the micro glass beads,generally those of bigger diameters (20...40 m)be<strong>in</strong>g broken. Figure 3 presents four brokenmicro glass spheres (A, B, C and D) on an area of~ 600 m × 600 m <strong>in</strong> the central zone of thecontact; the resulted fragments are embedded<strong>in</strong>to the polymeric matrix. Such events takenplace <strong>in</strong> the contact create high oscillations of thefriction coefficient.big and rare (as compared to the wear debrisresulted from other polymer <strong>in</strong> dry slid<strong>in</strong>g aga<strong>in</strong>ststeel) and they are volumic (Fig. 4), not lam<strong>in</strong>atedand th<strong>in</strong>, as it is happen<strong>in</strong>g <strong>in</strong> the case of PTFE [14].Generally, small micro glass beads are evacuatedfrom the superficial layers and the polymer aroundthe bigger ones is detached. In this scenario, one ormore micro glass beads will support an <strong>in</strong>dividualload great enough to be broken.a) At the edge of the wear track from the r<strong>in</strong>g.Fig. 3. SEM image of a block made of GB10 – fourbroken micro glass beads (A, B, C and D). Testconditions: v = 0.25 m/s, F = 5 N, L = 7500 m.From SEM images (Fig. 4), the wear debris werecharacterized as size and shape, many are madeespecially of polymer with only small glass debris(from fragmented micro glass beads) or small microglass beads (but rare). Dur<strong>in</strong>g the test, the weardebris adhere one to each other and are generallyb) Wear particles made of polymer and very smallfragments from the broken glass beads.Fig. 4. Aspect of the wear particles generated dur<strong>in</strong>gthe test <strong>in</strong>volv<strong>in</strong>g the slid<strong>in</strong>g of the block made of GB20on the metallic r<strong>in</strong>g. Test conditions: F = 5 N, v = 0.75m/s, L = 7500 m.At F = 1 N and v = 0.25 m/s, a larger scatter<strong>in</strong>g<strong>in</strong>terval of the friction coefficient had resulted;there are prevail<strong>in</strong>g the micro‐cutt<strong>in</strong>g processand events imply<strong>in</strong>g the glass beads (overrunn<strong>in</strong>g137
C. Georgescu et al., Tribology <strong>in</strong> Industry Vol. 35, No. 2 (2013) 134‐140of the hard asperities of the metallic r<strong>in</strong>g, thebreakage of the micro glass beads and rare shearof the hard asperities, the micro glass beadsembedd<strong>in</strong>g <strong>in</strong>to the polymeric matrix). Adoubl<strong>in</strong>g of the slid<strong>in</strong>g speed (v = 0.5 m/s)determ<strong>in</strong>es dim<strong>in</strong>ish<strong>in</strong>g the average value of thefriction coefficient characteriz<strong>in</strong>g thesecomposites, from 0.15...0.28, to 0.12...0.22. At v =0.5 m/s, both composites behave well, the frictioncoefficient becom<strong>in</strong>g stable around the averagevalue of 0.2. The polymer is warm<strong>in</strong>g and, thus, itis reduc<strong>in</strong>g its mechanical properties and allowsfor generat<strong>in</strong>g a very th<strong>in</strong> viscous film that is notexpelled from the contact (as it happens withother polymer under high speed) and becomes afavourable factor <strong>in</strong> reduc<strong>in</strong>g friction also byembedd<strong>in</strong>g the glass beads <strong>in</strong> the soften matrix.the block and its mass after be<strong>in</strong>g tested, ρ[g/mm 3 ] is the density of the tested block material.The wear maps (see Fig. 5) were plotted us<strong>in</strong>gMATLAB R2009b, the wear parameter be<strong>in</strong>grepresented for each material as a function of theslid<strong>in</strong>g speed and the normal force, with the helpof a cubic <strong>in</strong>terpolation.At F = 2.5 N, the average value of the frictioncoefficient has a slightly tendency of <strong>in</strong>creas<strong>in</strong>gwhen the micro glass beads concentration are<strong>in</strong>creased.At F = 5 N, the values of the analysed parametersof the friction coefficient have been reduced(figure 1), confirm<strong>in</strong>g the results obta<strong>in</strong>ed <strong>in</strong>other research [12] that the small loads generatea more <strong>in</strong>tense friction for the friction coupleelement(s) made of polymer or polymericcomposites and hard counterpart (steel). Thenormal force, for which the friction coefficientbeg<strong>in</strong>s to decrease, is depend<strong>in</strong>g on the shape andsize of the triboelement and on the work<strong>in</strong>gconditions [15‐16].b. WearTak<strong>in</strong>g <strong>in</strong>to account the command<strong>in</strong>g parameters<strong>in</strong>volved <strong>in</strong> this study (the material, by theconcentration of the add<strong>in</strong>g materials, the slid<strong>in</strong>gspeed and the load) and the recentdocumentation on wear parameterization [15‐20], the authors selected the wear rate (k) foranalys<strong>in</strong>g the experimental wear results obta<strong>in</strong>eddur<strong>in</strong>g this research.V mk F L F L3[mm /(N m)] (1)where F [N] – the normal force and L [m] – theslid<strong>in</strong>g distance, V [mm 3 ] is the material volumelost by wear, Δm [g] is the mass loss of a block,calculated as the difference of the <strong>in</strong>itial mass ofFigure 5. The wear rate for PBT and the compositesPBT + micro glass beads.138
C. Georgescu et al., Tribology <strong>in</strong> Industry Vol. 35, No. 2 (2013) 134‐140For PBT (see Fig. 5), one may notice a significant<strong>in</strong>crease of the wear parameter when the normalforce is decreas<strong>in</strong>g ‐ the cause could be the<strong>in</strong>crease of the heighten<strong>in</strong>g factor for the abrasivewear under low loads and the absence of atransfer film on the hard surface due to theabsence of the mechanical pressure and thermalload<strong>in</strong>g great enough for <strong>in</strong>itiat<strong>in</strong>g andma<strong>in</strong>ta<strong>in</strong><strong>in</strong>g an adherence process.For all tested slid<strong>in</strong>g speeds, the tendencycharacteriz<strong>in</strong>g the wear variation as a function ofload has a m<strong>in</strong>imum zone around the value of 4 N.For the composites PBT + micro glass beads,analys<strong>in</strong>g Fig. 5, the follow<strong>in</strong>g conclusions couldbe drawn:‐ a zone with m<strong>in</strong>imum values, for F = 5 N;‐ an accentuated <strong>in</strong>crease of the wear rate forloads smaller than 2.5 N, with higher values forthe composite GB10;‐ for the composite GB10, the wear rate isdecreas<strong>in</strong>g almost l<strong>in</strong>early when the load is<strong>in</strong>creas<strong>in</strong>g and it is <strong>in</strong>significantly decreas<strong>in</strong>gwhen the slid<strong>in</strong>g speed is <strong>in</strong>creas<strong>in</strong>g; k is smallerfor the two composites with micro glass beads ascompared to the basic material (PBT), the lowestvalues be<strong>in</strong>g recorded for the composites, underthe load F = 5 N;‐ at F = 5 N, for all the tested materials, thewear rate has a very low sensitivity to thevariation of the slid<strong>in</strong>g speed, the smaller valuesbe<strong>in</strong>g obta<strong>in</strong>ed for the composites.Thus, the wear rate dim<strong>in</strong>ishes when<strong>in</strong>troduc<strong>in</strong>g glass beads <strong>in</strong> PBT. The wear isdim<strong>in</strong>ish<strong>in</strong>g due to the <strong>in</strong>crease of the materialresistance (see the results for the compositeGB10), but when the micro glass beadsconcentration becomes 20 %, the abrasivecomponent of the wear process <strong>in</strong>creases, too.4. CONCLUSIONSAdd<strong>in</strong>g micro glass beads <strong>in</strong> PBT makes thefriction coefficient <strong>in</strong>crease almost l<strong>in</strong>early withthe micro glass beads massic concentration, with~15 % for each 10 % of micro glass beads.An addition of 10% micro glass beads decreasesthe wear rate with ~20 %. When theconcentration of micro glass beads is <strong>in</strong>creased,the decrease of this wear parameter is smaller ascompared to PBT, with ~18 %.REFERENCES[1] C.P. Fung, P.C. Kang: Multi‐response optimization<strong>in</strong> friction properties of PBT composites us<strong>in</strong>gTaguchi method and pr<strong>in</strong>ciple componentanalysis, Journal of Materials Process<strong>in</strong>gTechnology, Vol. 170, pp. 602‐610, 2005.[2] G.S. Deshmukh, D.R. Peshwe, S.U. Pathak, J.D.Ekhe: A study on effect of m<strong>in</strong>eral additions on themechanical, thermal, and structural properties ofpoly (butylene terephthalate) (PBT) composites, JPolym Res, Vol. 18, pp.1081‐1090, 2011.[3] G.S. Deshmukh, D.R. Peshwe, S.U. Pathak, J.D.Ekhe: Evaluation of mechanical and thermalproperties of Poly (butylene terephthalate) (PBT)composites re<strong>in</strong>forced with wollastonite,Transactions of The Indian Institute of Metals,Vol. 64, No. 1 & 2, pp. 127‐132, 2011.[4] C. Georgescu, L. Deleanu: Influence of PTFEconcentration on the tribological characteristicsof PBT, <strong>in</strong>: Proceed<strong>in</strong>gs of the 7 th InternationalSymposium KOD 2012 Mach<strong>in</strong>e and IndustrialDesign <strong>in</strong> Mechanical Eng<strong>in</strong>eer<strong>in</strong>g, 24‐26.05.2012, Balatonfured, Hungary, pp. 405‐410.[5] J. Wu, K. Wang, D. Yu: Fracture toughness andfracture mechanisms of PBT/PC/IM blends. Part VEffect of PBT‐PC <strong>in</strong>terfacial strength on thefracture and tensile properties of the PBT/PCblends, Journal of Material Science, Vol. 38, pp.183‐191, 2003.[6] R.J. Crawford: Plastics Eng<strong>in</strong>eer<strong>in</strong>g, 3 rd Edition,Butterworth‐He<strong>in</strong>emann, Oxford, 2002.[7] J.A. Brydson, Plastics Materials, 7 th Edition,Butterworth‐He<strong>in</strong>emann, Oxford, 1999.[8] H. Czichos, T. Saito, L. Smith: Spr<strong>in</strong>ger Handbookof Materials Measurement Methods, Spr<strong>in</strong>gerScience‐Bus<strong>in</strong>ess Media, 2006.[9] A. Dasari, Z.Z. Yu, Y.W. Mai: Fundamental aspectsand recent progress on wear/scratch damage <strong>in</strong>polymer nanocomposites, Materials Science andEng<strong>in</strong>eer<strong>in</strong>g, Vol. 63, pp. 31‐80, 2009.[10] K. Friedrich: Advances <strong>in</strong> Composite Tribology,Vol. 8, Composites Materials Series, UniversitätKaiseslautern, Kaiserslautern, Germany, 1993.[11] ***: Crast<strong>in</strong> PBT. Mold<strong>in</strong>g Guide, available on‐l<strong>in</strong>e:http://www2.dupont.com/Plastics/en_US/assets/downloads/process<strong>in</strong>g/cramge.pdf[12] W.R. Jr. Jones, W.F. Hady, R.L. Johnson: Frictionand Wear of Poly (Amide‐Imide), Polyimide and139
C. Georgescu et al., Tribology <strong>in</strong> Industry Vol. 35, No. 2 (2013) 134‐140Pyrone Polymers at 260 °C (500 °F) <strong>in</strong> Dry Air,NASA TN D‐6353, Lewis Research Center, 1971.[13] L. Deleanu, G. Andrei, L. Maftei, C. Georgescu, A.Cantaragiu: Wear maps for a class of compositeswith polyamide matrix and micro glass spheres,Journal of the Balkan Tribological Association,Vol. 17, No. 3, pp. 371‐379, 2011.[14] P. Samyn, J. Qu<strong>in</strong>telier, W. Ost, P. De Baets, G.Schoukens: Slid<strong>in</strong>g behaviour of pure polyesterand polyester‐PTFE filled bulk composites <strong>in</strong>overload conditions, Polymer Test<strong>in</strong>g, Vol. 24, pp.588‐603, 2005.[15] G.M. Bartenev, V.V. Lavrentev: Friction and Wearof Polymers, Elsevier, 1981.[16] B.J. Briscoe, S.K. S<strong>in</strong>ha: Wear of polymers, Proc.Inst. Mech. Eng. Part J. Eng<strong>in</strong>eer<strong>in</strong>g Tribology,Vol. 216, pp. 401‐413, 2002.[17] H. Czikos: Tribology – A System Approach to theScience and Technology of Friction, Lubricationand Wear, Elsevier Scientific Publish<strong>in</strong>gCompany, New‐York, 1978.[18] K. Friedrich, A.K. Schlarb: Tribology of PolymericNanocomposites – Friction and Wear of BulkMaterials and Coat<strong>in</strong>gs, Tribology and InterfaceEng<strong>in</strong>eer<strong>in</strong>g Series, 55, Elsevier, 2008.[19] N.K. Myshk<strong>in</strong>, M.I. Petrokovets, A.V. Kovalev:Tribology of polymers: Adhesion, friction, wear,and mass‐transfer, Tribology International, Vol.38, pp. 910‐921, 2005.[20] K. Holmberg: Report<strong>in</strong>g Experimental Results <strong>in</strong>Tribology – Summary of the discussion on NewWear Rate Unit, <strong>in</strong>: OECD IRG 26th Meet<strong>in</strong>g,5‐6.10.2006, Lyon, France.[21] A. Todić, D. Čikara, V. Lazić, T. Todić, I. Čamagić,A. Skulić, D. Čikara: Exam<strong>in</strong>ation of WearResistance of Polymer – Basalt Composites,Tribology <strong>in</strong> Industry, Vol. 35, No. 1, pp. 36‐41,2013.[22] I.‐G. Bîrsan, A. Cîrciumaru, V. Bria, V. Ungureanu:Tribological and Electrical Properties of FilledEpoxy Re<strong>in</strong>forced Composites, Tribology <strong>in</strong>Industry, Vol. 31, No. 1&2, pp. 33‐36, 2009.140
Vol. 35, No. 2 (2013) 141‐147Tribology <strong>in</strong> Industrywww.<strong>tribology</strong>.f<strong>in</strong>k.rsRESEARCHAnalyz<strong>in</strong>g the Surface Roughness Effects on PistonSkirt EHL <strong>in</strong> Initial Eng<strong>in</strong>e Start‐Up Us<strong>in</strong>g DifferentViscosity Grade OilsM. Gulzar a , S.A. Qasim a , R.A. Mufti aa College of Electrical and Mechanical Eng<strong>in</strong>eer<strong>in</strong>g, National University of Sciences and Technology (NUST), Pakistan.Keywords:EHLPiston skirtFlow factorAsperityHydrodynamicVogelpohl parameterCorrespond<strong>in</strong>g author:M. GulzarCollege of Electrical and MechanicalEng<strong>in</strong>eer<strong>in</strong>g, National University ofSciences and Technology (NUST),PakistanE‐mail: mubashir_nustian@hotmail.comA B S T R A C TThe absence of fully developed fluid film lubrication between Pistonand L<strong>in</strong>er surfaces is responsible for high friction and wear at <strong>in</strong>itialeng<strong>in</strong>e start‐up. In this paper flow factor method is used <strong>in</strong> twodimensional Reynolds’ equation to model the effects of surfaceroughness characteristics on Piston Skirt elastohydrodynamiclubrication. The contact of surface asperities between the twosurfaces and its after effects on EHL of piston skirt is <strong>in</strong>vestigated. Forthis purpose, two different grade oils are used to show the chang<strong>in</strong>geffects of viscosity comb<strong>in</strong>ed with surface roughness on differentparameters <strong>in</strong>clud<strong>in</strong>g film thickness, eccentricities and hydrodynamicpressures. The results of the presented model shows considerableeffects on film thickness of rough piston skirt, hydrodynamic pressuresand eccentricities profiles for 720 degrees crank angle.© 2013 Published by Faculty of Eng<strong>in</strong>eer<strong>in</strong>g1. INTRODUCTIONIn <strong>in</strong>itial eng<strong>in</strong>e start‐up the piston and l<strong>in</strong>ersurfaces are not separated by an oil film whichcauses maximum wear and friction between thetwo slid<strong>in</strong>g surfaces. The effects of physicalcontacts between the asperities of surfaceswhich are <strong>in</strong> relative motion must be <strong>in</strong>cluded <strong>in</strong>lubrication model to get a better understand<strong>in</strong>gof rheology. In lubricated <strong>in</strong>teract<strong>in</strong>g surfaces,the surface topography characteristics becomemore significant because they have a majoreffect on generation of a cont<strong>in</strong>uous lubricantfilm and <strong>in</strong> case of high amplitude of asperities<strong>in</strong> comparison to lubrication film thickness,there is an <strong>in</strong>creased probability of directcontacts among asperities which can results <strong>in</strong>adhesive wear [1].Hamilton, Wallowit and Allen [2] were thepioneer for taken <strong>in</strong>to account the roughnesseffects on lubrication phenomenon and theirwork dates back to 1966. They developed atheory of hydrodynamic lubrication betweentwo parallel surfaces with surface roughness onone or both of the surfaces. The classical theoryof lubrication does not predict the existence ofany pressure <strong>in</strong> case of slid<strong>in</strong>g flat parallelsurfaces. Surface roughness helps <strong>in</strong> thepressure build‐up between the two <strong>in</strong>teract<strong>in</strong>g141
M. Gulzar et al., Tribology <strong>in</strong> Industry Vol. 35, No. 2 (2013) 141‐147surfaces, so provide a load support and avoidcollapse of two bodies. Early research <strong>in</strong>tegratedthe roughness amplitude with the film thicknessand developed the modified one dimensionalReynolds’s equation but the presented modelsdid not cover different regimes and asperitycontacts and limited to one dimensionalchanges. In this prospective an exception isgiven <strong>in</strong> 1978 and 1979 by Patir and Cheng [3‐4]. S<strong>in</strong>ce the contact<strong>in</strong>g surfaces have an<strong>in</strong>herent roughness, so Lambda Ratio or TallianParameter will be used as the def<strong>in</strong><strong>in</strong>gparameter between different lubricationregimes [5]. In recent research the film thicknessparameter (λ) range has been <strong>in</strong>vestigated andredef<strong>in</strong>ed for different lubrication regimes [6].The P.C. model was suitable for values of filmthickness ratio λ > 3 1.e; full film lubricationregime where asperity contacts were neglected[7‐8]. To m<strong>in</strong>imize the wear and friction lossesthe elastohydrodynamic lubrication (EHL)model is presented where λ is much lesser thana value of 3 [6]. Thus the flow factor modelprovided by J.H. Tripp [9] is numericallymodelled for hydrodynamic lubrication at <strong>in</strong>itialeng<strong>in</strong>e start‐up. Greenwood‐Tripp asperitycontact model is used to <strong>in</strong>corporate the asperitycontact forces and asperity contact friction force<strong>in</strong> EHL between the slid<strong>in</strong>g surfaces [10]. To<strong>in</strong>corporate the isotropic behaviour the Pekleniknumber [11] is def<strong>in</strong>ed for the rough surfaceswhich are generated by normal distributionus<strong>in</strong>g Fast Fourier Transform [12‐13]. Inrheology a number of parameters affect thelubrication film between <strong>in</strong>teract<strong>in</strong>g surfaces.These parameters <strong>in</strong>clude piston to bore radialclearance, lubricant viscosities and chemicalproperties, surface roughness, shear heat<strong>in</strong>g,cavitation effects, squeeze film effects, materialproperties and other operat<strong>in</strong>g conditions.The viscosities of lubricat<strong>in</strong>g oils along withcharacteristics of additives have a significanteffect on friction and wear performance of<strong>in</strong>teract<strong>in</strong>g materials [14]. Thus <strong>in</strong> this research,isotropic rough piston and skirt surfaces areselected and modelled with high and lowviscosity oils. The results are plotted, show<strong>in</strong>gthe hydrodynamic and EHL film thicknessprofiles, dimensionless eccentricities profilesand hydrodynamic pressures at 500 rpm withradial clearance of 10 micron. A comparison ofthe results for Oil A (0.016 Pa.s) and Oil B(0.1891 Pa.s) is provided. The results show an<strong>in</strong>terest<strong>in</strong>g f<strong>in</strong>d<strong>in</strong>g, that the considered lowviscosity oil (Oil A) is more suitable to avoid thecontact and wear between <strong>in</strong>teract<strong>in</strong>g roughsurfaces of piston and l<strong>in</strong>er at <strong>in</strong>itial eng<strong>in</strong>estart‐up.For develop<strong>in</strong>g the numerical model follow<strong>in</strong>gassumptions are taken:1. Lubricant is <strong>in</strong>compressible and thermaleffects are neglected.2. Non‐Newtonian lubricant behaviour isneglected.3. Pressure at the <strong>in</strong>let is zero and surfacesare oil‐flooded.4. Lubricant flow is lam<strong>in</strong>ar and turbulenceeffects are neglected.5. Leakage at the sides and edges isneglected.2. NOMENCLATUREC = Radial clearance between piston and l<strong>in</strong>er =10microns,C f = Specific heat of lubricant,C g = Distance from piston center of mass topiston p<strong>in</strong> = 0.2cm,C p = Distance of piston‐p<strong>in</strong> from axis of piston =1 cm,F = Normal force act<strong>in</strong>g on piston skirts,F f = Friction force act<strong>in</strong>g on skirts surface,F fh = Friction force due to hydrodynamiclubricant film,F G = Combustion Gas force act<strong>in</strong>g on the top of piston,F h =Normal force due to hydrodynamic pressure<strong>in</strong> film,F IC = Transverse Inertia force due to piston mass,F ~ = Reciprocat<strong>in</strong>g Inertia force due to pistonICmass,F IP = Transverse Inertia force due to piston p<strong>in</strong> mass,F ~ = Reciprocat<strong>in</strong>g Inertia force due to pistonIPp<strong>in</strong> mass,F c = Asperity Contact Force,F fc = Friction force due to asperity contact,G = Shear modulus of elastic lubricant,I pis = Piston <strong>in</strong>ertia about its centre of mass,M = Moment act<strong>in</strong>g on piston skirts,142
M. Gulzar et al., Tribology <strong>in</strong> Industry Vol. 35, No. 2 (2013) 141‐147M f = Friction moment act<strong>in</strong>g on skirt surface,M fh = Moment about piston p<strong>in</strong> due tohydrodynamic friction,M h = Moment about piston p<strong>in</strong> due tohydrodynamic pressure,M c = Asperity Contact Moment,M fc = Moment due o friction force of asperitycontact,R = Radius of piston,U = Piston Velocity,a = Vertical distance from skirt top to piston‐p<strong>in</strong>= 0.0125m,b = Vertical distance from skirt top to pistoncenter of gravity = 0.0015m,e t = Piston eccentricities at skirts top surface,e b = Piston eccentricities at skirts bottom surface,ё b = Acceleration of piston skirts bottomeccentricities,ё t = Acceleration of piston skirts topeccentricities,h = Film Thickness,l = Connect<strong>in</strong>g rod length,m pis = Mass of piston = 0.295 kg,m p<strong>in</strong> = Mass of piston‐p<strong>in</strong> = 0.09 kg,p = Hydrodynamic pressure,r = Crank radius = 0.0418 m,ω = Constant crankshaft speed (eng<strong>in</strong>e speed),τ = Shear stress,η A = Oil A viscosity = 0.016 Pa.s.,η B = Oil B viscosity = 0.1891 Pa.s., = Connect<strong>in</strong>g rod angle, = Crank angle, X ,y = Pressure flow factor along x and y‐axisrespectively,s = Shear flow factor, = comb<strong>in</strong>ed root mean square (rms)roughness,1 = rms roughness of piston skirt= 1.4µm,2 = rms roughness of cyl<strong>in</strong>der l<strong>in</strong>er = 1.5µm,3. MATHEMATICAL MODEL3.1 Equations of Piston MotionThe forces and moments are <strong>in</strong> the form of theforce and moment balance equations similar tothat def<strong>in</strong>ed by Zhu et al [15]: a a1121aa2222 e Fh Fc Fs ( Ffh Ft eb Mh Mc Ms Mffc) tan (1) a b a11 mp<strong>in</strong> 1 mp<strong>in</strong> 1 (2a) L L a a b a12 mp<strong>in</strong> mp<strong>in</strong> (2b) L L 21aF I Lp<strong>in</strong> mp<strong>in</strong>bLa b (1 )b I(2c)p<strong>in</strong> 22 mp<strong>in</strong>a b ( ) (2d)L L s~ ~ tan F F F(3)MsGGpIP~ F C F C(4)Us<strong>in</strong>g the Greenwood‐Tripp’s Asperity ContactModel, the values of F c , F fc , M c and M fc can befound for EHL regime [10].3.2 Film Thickness EquationThe film thickness between the skirts and thel<strong>in</strong>er given by Zhu [15]:h C etICy ( t ) cos x eb( t ) et( t )] cos x (6)L 3.3 Reynolds’ Equation Modell<strong>in</strong>gModified 2‐D Reynolds equation is given as [3]:2 3 p R 3 p hTS h x h y 6U( ) (7)x x L y y xxwhere x and y are Poiseulle or pressure flowfactors and s is Cuotte or shear flow factor [3,9].gIC143
M. Gulzar et al., Tribology <strong>in</strong> Industry Vol. 35, No. 2 (2013) 141‐147The boundary conditions are def<strong>in</strong>ed as [5]:pxp 0x p =0 when x 1 ≤ x ≤ x 2p( ,0) p( , L) 0In dimensionless form the 2‐D Reynoldsequation is given by [5,9]:20(8) 3 p* R 3 p* hT* Sh*x h*y * (9)x* x* L y* y* x*x*Where by J. H Tripp [9]:X 1 3( 2) /( 1)][ / h]y = X ( 1/ )2212 (h, 1) (hs, 2)2 s 2 s 3 (hs , 2) ( / h)( 1)and is the Peklenik number [11].In order to read the pressure profilesconveniently, the Vogelpohl parameter M v is<strong>in</strong>troduced [5]:1.5M v p*h*2The Reynolds equation <strong>in</strong> terms of the Vogelpohlparameter is given as:Mvi ,, jRC. M M C.M ML 2. C 2.C F v i j v il j v i jlv i ji1 , 1, , , 2 , , , ,. * C. (1/ *)M M . x * 2. C 2.C F21 2 i,j3 vi , 1, j vi , l,j1 2 i,j. * C. (1/ *)M M G. y *2. C 2.C F4 vi , 1, j vi , l, j i.j1 2 i,j3.4. Film Thickness <strong>in</strong> EHL RegimeIn EHL regime the film thickness <strong>in</strong>cludes filmthickness <strong>in</strong> the rigid hydrodynamic regime andthe elastic surface displacements etc. Byconsider<strong>in</strong>g the bulk elastic deformation, thelubricant film thickness equation takes thefollow<strong>in</strong>g form [16]h eh ; h f ( , y) vwhere f(θ ,y ) is neglected. The differentialsurface displacement is [16]:1dv E rp ( x , y ) dydyr( xxy220) ( y0)221 1 (1 v 1) (1 v2) E 2 E1E2 At a specific po<strong>in</strong>t (x o , y o ) the elastic deformationis [5]:1 p(x,y)dxdyv( x0,y0)Era2 2 2Mv R Mv . x Mv2 2 (1 / ) ( ) . x* L . y* . x* . x*2 . y R.Mv (1 / ) ( ) FMvG. y* L . y*where:(10)2 2 2 2 2 2h* R h* h* R h* 2 20.75 1.5x* Ly* x* Ly*F 2h* h*2h* Rh*1.5 x* x* L y* y* h * h* S * x* x*G 1.5( h * )4. RESULTS AND DISCUSSIONThe hydrodynamic lubrication and EHL models ofthe piston skirts at 500 rpm are developed after<strong>in</strong>corporat<strong>in</strong>g the pressure flow and the shear flowfactors. Two different oils hav<strong>in</strong>g viscosity 0.016Pa.s and 0.1891 Pa.s are used for a comparison and<strong>in</strong>vestigat<strong>in</strong>g the viscosity effects on differentparameters which <strong>in</strong>clude film thickness,eccentricities and hydrodynamic pressure profilesat 720 degree crank rotation cycle.4.1 Piston EccentricitiesThe dimensionless eccentricities of the top andthe bottom surface of the piston skirts (Et and144
M. Gulzar et al., Tribology <strong>in</strong> Industry Vol. 35, No. 2 (2013) 141‐147Eb) are plotted aga<strong>in</strong>st the 720 degree crankrotation cycle. Figure 1(a) and 1(b) showeccentricity profiles for Oil A at 500 rpm. Theresults are plotted between a range of 1 and ‐1where the physical contact between the slid<strong>in</strong>gsurfaces can occur. At central value ‘0’ themotion is concentric. Figure 1(a) shows thedimensionless eccentricity profiles <strong>in</strong> thehydrodynamic lubrication regime whereas Fig. 1(b) shows the similar profiles <strong>in</strong> the EHL regime.(a)(b)Fig. 1. For Oil A, Dimensionless Eccentricities at 500rpm <strong>in</strong> (a) Hydrodynamic regime (b) EHL Regime.The behaviour is shown for all the four strokeswhere it can be seen that at the start of cycle thepiston and l<strong>in</strong>er axis are concentric then due tothe secondary motion the profiles are highlydisplaced from the centre towards thrust sideand non‐thrust side, but for Oil A the physicalcontact is avoided as shown <strong>in</strong> Fig. 1. For Oil B,the dimensionless eccentricities profiles forhydrodynamic and EHL regime are shown <strong>in</strong> Fig.4. Figure 4 (a) shows that the contact isestablished at lower surface as l<strong>in</strong>e is meet<strong>in</strong>gwith ‐1 <strong>in</strong> rigid hydrodynamic regime. However<strong>in</strong> Fig. 4 (b) the EHL regime shows the physicalcontact is clearly avoided. This shows that theelastic deformation of asperities help <strong>in</strong> avoid<strong>in</strong>gthe contact between <strong>in</strong>teract<strong>in</strong>g surfaces, thushelp <strong>in</strong> avoid<strong>in</strong>g friction related wear.Comparison of eccentricities for both oilsprovides an <strong>in</strong>terest<strong>in</strong>g f<strong>in</strong>d<strong>in</strong>g that the lowviscosity oil can be more helpful at <strong>in</strong>itial eng<strong>in</strong>estart‐up speed of 500 rpm for rigidhydrodynamic regime as well as equally good forEHL regime.4.2 Hydrodynamic PressuresThree dimensional pressure fields and relatedpressure distribution are plotted for 720 degreecrank angle. Figures 2 (a), 2(b), 2(c), 2(d) show3‐D hydrodynamic pressure profiles at 900,4500, 6300 and 7200 crank angles at 500 rpm.The positive pressures are developed over thepiston skirt and vary as shown <strong>in</strong> Fig. 2. In Fig. 2(a), for Oil A, at 90 degrees crank angle thepressures are biased towards bottom of pistonskirt and extended to the middle of piston skirt.The peak pressure occurs at the bottom ofpiston skirt. In Fig. 2 (b), for Oil A, at 450degrees crank angle, the pressure field showsthat the hydrodynamic pressures are developedat top of piston skirt though a small ridge can beseen at bottom of piston Skirt. The peakpressures are larger than the 90 degrees angle.In Fig. 2 (c), at 630 degrees crank angle, thepressures are shifted towards top of piston skirt.In Fig. 2(d), at 720 degrees the pressure profileis more steep and developed at bottom of pistonskirt show<strong>in</strong>g the end of cycle. For Oil B, <strong>in</strong> Fig.5(a), 5(b), 5(c), 5(d) show 3‐ D hydrodynamicpressure profiles at 900, 4500, 6300 and 7200crank angles at 500 rpm speed.(a)(b)(c)(d)Fig. 2. For Oil A, 3‐D Hydrodynamic pressure fieldsat 500 rpm at crank angle (a) 90 degree (b) 450degree (c) 630 degree (d) 720 degree.For the pressure fields it can be clearly<strong>in</strong>vestigated that the hydrodynamic pressuresare totally shifted towards top of piston skirt at450 degrees crank angle while the case was notsame <strong>in</strong> case of Oil A for similar conditions. Themajor change <strong>in</strong> shape of pressure filed can beobserved for 630 degrees crank angle where thedimensionless pressure is biased towardsbottom of piston skirt <strong>in</strong>stead of top as discussedfor Oil A. Thus chang<strong>in</strong>g the viscosity of oil isaffect<strong>in</strong>g the distribution of hydrodynamicpressures over piston skirt.145
M. Gulzar et al., Tribology <strong>in</strong> Industry Vol. 35, No. 2 (2013) 141‐1474.3 Hydrodynamic and EHL Film ThicknessFigure 3(a) shows the maximum and them<strong>in</strong>imum hydrodynamic film thickness for Oil Aat 500 rpm and 10 micron radial clearance. Themaximum film thickness is calculated before theapplication of load and on the other side them<strong>in</strong>imum film thickness is found after theapplication of load. The magnitude of m<strong>in</strong>imumfilm thickness shows whether the film thicknessis capable of avoid<strong>in</strong>g the contact betweenslid<strong>in</strong>g surfaces or not. In Fig. 3(a), the m<strong>in</strong>imumhydrodynamic film start gett<strong>in</strong>g establishedfrom start of cycle and reaches at a peak atpower stroke and decrease to m<strong>in</strong>imum at endof exhaust stroke and cycle cont<strong>in</strong>ues. Similarcase can be seen for Oil B <strong>in</strong> Fig. 6(a), but thedifference is evident at end of exhaust strokewhere a second peak of film thickness can beseen. In Fig. 3(b) and 6(b) EHL film thicknessprofiles are shown. By compar<strong>in</strong>g both profiles,it can be seen that <strong>in</strong> case of Oil A the EHL filmthickness is greater <strong>in</strong> magnitude for differentcrank angles as compare to Oil B. Thus Oil A,which is low viscosity oil, will be more helpful <strong>in</strong>avoid<strong>in</strong>g the contact and wear between roughpiston and l<strong>in</strong>er surfaces.(a)(b)(c)(d)Fig. 5. For Oil B, 3‐D Hydrodynamic pressure fields at500 rpm at crank angle (a) 90 degree (b) 450 degree(c) 630 degree (d) 720 degree.(a)(b)Fig. 3. For Oil A, At 500 rpm (a) Film thicknessprofiles (b) EHL film.(a)(b)Fig. 4. For Oil B, Dimensionless Eccentricities at 500rpm <strong>in</strong> (a) Hydrodynamic regime (b) EHL Regime.(a)(b)Fig. 6. For Oil B, At 500 rpm (a) Film thicknessprofiles (b) EHL film.5. CONCLUSIONTwo dimensional numerical models forhydrodynamic and EHL regimes were developedat <strong>in</strong>itial eng<strong>in</strong>e start‐up speed for isotropicrough piston skirt and cyl<strong>in</strong>der. Two differentgrade oils were used to <strong>in</strong>vestigate the differentparameters affect<strong>in</strong>g the rough piston skirt wearphenomenon. The different rough surfaces of the<strong>in</strong>teract<strong>in</strong>g skirts and the l<strong>in</strong>er were consideredby <strong>in</strong>troduc<strong>in</strong>g the pressure and the shear flowfactors <strong>in</strong> the lubrication model. For Oil ‘B’hav<strong>in</strong>g a viscosity of 0.1891 Pa.s, the simulationresults verify that a physical contact between146
M. Gulzar et al., Tribology <strong>in</strong> Industry Vol. 35, No. 2 (2013) 141‐147the rough skirts and the l<strong>in</strong>er surfaces cannot beavoided <strong>in</strong> the rigid hydrodynamic regime.However, for both oils, the rough <strong>in</strong>teract<strong>in</strong>gsurfaces deform elastically to generate asufficiently thick film <strong>in</strong> the EHL regime. Thehydrodynamic pressures shift<strong>in</strong>g occur from topof piston skirt to bottom at 630 degrees crankangle by chang<strong>in</strong>g Oil A to Oil B at 500 rpm and10 micron radial clearance. Compar<strong>in</strong>g both oilsfor given conditions, Oil A is more suitable toavoid the contact and wear between <strong>in</strong>teract<strong>in</strong>grough surfaces.REFERENCES[1] N. Diaconu, L. Deleanu, F. Potecasu, S. Ciortan:The Influence of the Relative Slid<strong>in</strong>g on theSurface Quality, Tribology In Industry, Vol. 33,No. 3, pp. 110‐115, 2011.[2] D.B. Hamilton, J.A. Walowit, C.M. Allen: Theory ofLubrication by Microirregularities, Journal ofBasic Eng<strong>in</strong>eer<strong>in</strong>g, Trans ASME, Vol. 88, No. 1,pp. 177‐185, 1966.[3] N. Patir, H.S. Cheng: An Average Flow Model forDeterm<strong>in</strong><strong>in</strong>g Effects of Three‐DimensionalRoughness on Partial Hydrodynamic Lubrication,ASME Journal of Lubrication Technology, Vol.100, No. 1, pp 12‐17, 1978.[4] N. Patir, H.S. Cheng: Application of Average FlowModel to Lubrication Between Rough Slid<strong>in</strong>gSurfaces, ASME Journal of LubricationTechnology, Vol. 101, No. 2, pp. 220‐230, 1979.[5] G.W. Stachowiak, A.W. Batchelor: Eng<strong>in</strong>eer<strong>in</strong>g<strong>tribology</strong>, 3rd ed., Elsevier, pp. 328, 2005.[6] Dong Zhu, Q Jane Wang: On the λ ratio range ofmixed lubrication, Proc IMechE Part J: Journal ofEng<strong>in</strong>eer<strong>in</strong>g Tribology, Vol. 226, No. 12, pp.1010–1022, 2012.[7] J.H. Tripp, B.J. Hamrock: Surface roughnesseffects <strong>in</strong> elastohydrodynamic contacts, <strong>in</strong>: Proc1984 Leeds Lyon Symposium on Tribology1985, pp. 30–9.[8] H.G. Elrod, A. General: Theory for Lam<strong>in</strong>arLubrication with Reynolds Roughness, ASMEJournal of Lubrication Technology, Vol. 101, No.1, pp. 8‐14, 1979.[9] J.H. Tripp: Surface Roughness Effects <strong>in</strong> HydrodynamicLubrication: The Flow Factor Method,ASME Journal of Lubrication Technology, Vol.105, pp 458‐463, 1983.[10] J.A. Greenwood, J.H. Tripp: The Contact of TwoNom<strong>in</strong>ally Flat Rough Surface, Proc. Institution ofMechanical Eng<strong>in</strong>eers (IMechE), UK, (185), pp625‐633, 1971.[11] J. Peklenik: New Developments <strong>in</strong> SurfaceCharacterization and Measurement by Means ofRandom Process Analysis, Proc. Instn. Mech.Engrs., Vol. 182, pp. 108‐125, 1967‐68.[12] N. Garcia, E. Stoll: Monte Carlo Calculation ofElectromagnetic‐Wave Scatter<strong>in</strong>g from RandomRough Surfaces, Physical Review Letters, Vol. 52,No. 20, pp. 1798‐1801, 1984.[13] FFTW library ‐ free collection of fast C rout<strong>in</strong>esfor comput<strong>in</strong>g discrete Fast Fourier Transforms.Developed at MIT by Matteo Frigo and Steven G.Johnson.[14] A. Vadiraj, G. Manivasagam, K. Kamani, V.S.Sreenivasan: Effect of Nano Oil AdditiveProportions on Friction and Wear Performance ofAutomotive Materials, Tribology In Industry, Vol.34, No. 1, pp. 3‐10, 2012.[15] D. Zhu, Y. Hu, H.S. Cheng, T. Arai, K. Hamai: Anumerical Analysis for Piston Skirts <strong>in</strong> MixedLubrication, Part 2: Deformation Consideration,ASME Journal of Tribology, Vol. 115, No. 1, pp.125‐133, 1993.[16] S.A. Qasim, M.A. Malik, M.A. Khan, R.A. Mufti:Low Viscosity Shear Heat<strong>in</strong>g <strong>in</strong> Piston SkirtsEHL <strong>in</strong> the Low Initial Eng<strong>in</strong>e Start Up Speeds,Tribology International, Vol. 44, No. 10, pp.1134‐1143, 2011.147
Vol. 35, No. 2 (2013) 148‐154Tribology <strong>in</strong> Industrywww.<strong>tribology</strong>.f<strong>in</strong>k.rsRESEARCHWear Properties of A356/10SiC/1Gr HybridComposites <strong>in</strong> Lubricated Slid<strong>in</strong>g ConditionsM. Babić a , B. Stojanović a , S. Mitrović a , I. Bobić b , N. Miloradović a , M. Pantić a , D. Džunić aa Faculty of Eng<strong>in</strong>eer<strong>in</strong>g, University of Kragujevac, Kragujevac, Serbia,b Institution Institute of Nuclear Sciences “V<strong>in</strong>ca”, University of Belgrade, Belgrade, Serbia.Keywords:Hybrid compositesAlum<strong>in</strong>iumSiCGraphiteWearLubricationMMLCorrespond<strong>in</strong>g author:Blaža StojanovićFaculty of Eng<strong>in</strong>eer<strong>in</strong>g,University of Kragujevac,Kragujevac, SerbiaE‐mail: blaza@kg.ac.rsA B S T R A C TThis paper presents basic tribological properties of A356/10SiC/1Gr hybridcomposites <strong>in</strong> conditions with lubrication. Hybrid composite specimen isobta<strong>in</strong>ed by compocast<strong>in</strong>g procedure. A356 alum<strong>in</strong>ium alloy is used as a basematrix alloy, re<strong>in</strong>forced with 10wt% of SiC and 1wt% of graphite. Tribologicaltests are done on advanced and computer supported tribometer with block‐ondisccontact pair. By the experimental plan, test is conducted under threedifferent values of slid<strong>in</strong>g speed, three different values of normal load, differentslid<strong>in</strong>g distances, and also different lubricants. SEM and EDS are used for wearanalysis. The analysis has shown the presence of MML, which means that therewas transfer of material from steel disc to composite block.© 2013 Published by Faculty of Eng<strong>in</strong>eer<strong>in</strong>g1. INTRODUCTIONAlum<strong>in</strong>ium is the most attractive material <strong>in</strong>automotive, airplane, space and precise devices<strong>in</strong>dustry. Improvement of mechanical andtribological properties of alum<strong>in</strong>ium can beachieved through alum<strong>in</strong>ium re<strong>in</strong>forcement withthe proper material and through creat<strong>in</strong>gcomposite material. The most effectiveimprovement of these properties is achievedthrough creat<strong>in</strong>g hybrid composites with two ormore types of re<strong>in</strong>forcements. By add<strong>in</strong>g theceramic re<strong>in</strong>forcement, mechanical properties ofthe matrix are changed, but <strong>in</strong> that case problem ofmach<strong>in</strong>ability occurs. To improve mach<strong>in</strong>ability,the graphite is added to composite materials thatare already re<strong>in</strong>forced with ceramic material.Presence of graphite reduces mechanicalproperties (hardness decreases), but tribologicalproperties are improved [1‐5].Basavarajappa et al [6‐8] have studied thetribological behaviour of hybrid composites withalum<strong>in</strong>um base Al2219 re<strong>in</strong>forced by SiC andgraphite. They studied the tribologicalproperties of hybrid composites with 5, 10 and15 % SiC and 3 % Gr obta<strong>in</strong>ed with process ofliquid metallurgy. The tribological tests showthat wear decreases with <strong>in</strong>creas<strong>in</strong>g SiC content<strong>in</strong> the hybrid composite. With <strong>in</strong>creas<strong>in</strong>g slid<strong>in</strong>gspeed and normal load, wear rate of compositesis grow<strong>in</strong>g. Mahdavi and Akhlaghi [9,10] have148
M. Babić et al., Tribology <strong>in</strong> Industry Vol. 35, No. 2 (2013) 148‐154studied the tribological properties of Al / SiC /Gr hybrid composites obta<strong>in</strong>ed by In situPowder Metallurgy process. Alum<strong>in</strong>um alloy Al6061 is used as a base re<strong>in</strong>forced with graphite 9% and 0 ÷ 40 % SiC. The tribological tests aredone on tribometer with p<strong>in</strong> on disc contact, andthe composite with 20 % SiC has the bestproperties. Further <strong>in</strong>crease of SiC leads to<strong>in</strong>creased wear of hybrid composites.Suresha and Sridhara [11‐14] have studied theeffect of SiC content and graphite on thetribological behaviour of hybrid Al/SiC/Grcomposites with alum<strong>in</strong>um base LM25 (Al‐Si7Mg0.5) obta<strong>in</strong>ed by stircast<strong>in</strong>g process.a)Ames and Alpas have [15] studied the tribologicaltest<strong>in</strong>g of hybrid composites with a base ofalum<strong>in</strong>um alloy A356 re<strong>in</strong>forced with 20 % SiCand 3 ÷ 10 % Gr. The tribological tests are done ontribometer with block on r<strong>in</strong>g contact. The wearrate of hybrid composites is significantly lowerthan the wear rate of the base material withoutre<strong>in</strong>forcements, especially at low normal loads.Vencl et al [16,17] have studied the tribologicalbehaviour of hybrid composites with the A356matrix re<strong>in</strong>forced with SiC, Al 2 O 3 and graphite. Thetribological tests are done on tribometer with p<strong>in</strong>on disc contact and show that the wear and frictioncoefficient decreases with addition of graphite.This paper presents tribological behaviour ofhybrid composites with alum<strong>in</strong>um base of A356alloy re<strong>in</strong>forced with SiC and Gr obta<strong>in</strong>ed withcompocast<strong>in</strong>g procedure. The tests are done oncomputer aided block‐on‐disc tribometer underlubricated slid<strong>in</strong>g conditions by vary<strong>in</strong>g thecontact pairs (slid<strong>in</strong>g speed and normal load).2. EXPERIMENT2.1 The procedure for obta<strong>in</strong><strong>in</strong>g compositesHybrid A356/SiC/Gr composites are obta<strong>in</strong>ed by themodified compo‐cast<strong>in</strong>g procedure (<strong>in</strong>filtration ofparticles <strong>in</strong> the semi‐solidified melt A356 alloy). subeutecticAl‐Si alloys En AlSiMg0,3 (A356 alloy) is usedas a basis. Us<strong>in</strong>g compocast<strong>in</strong>g procedure, particlere<strong>in</strong>forcements are easily <strong>in</strong>filtrated / trapped. Thissolves the problem of wettability on the border baseand re<strong>in</strong>forcements. The cost of composite produc<strong>in</strong>gwith that process is much lower.b)Fig. 1. The structure of: a) base material A356, andb) hybrid composite A356/10SiC/1Gr.Figure 1 shows the structure of the basematerial A356 and the hybrid composite with10wt%SiC and 1wt%Gr. When mix<strong>in</strong>gcomposites, particles of graphite have becomefragmented with regard to orig<strong>in</strong>al size of 35 µm.The picture shows the distribution of SiCparticulate re<strong>in</strong>forcements, the size of 39 um.2.2 Plan of experiment and description ofequipmentTribological tests are done on advanced andcomputer supported tribometer with block‐ondisccontact pair <strong>in</strong> accordance with ASTM G77standard. Contact pair consists of rotat<strong>in</strong>g disc ofdiameter D d = 35 mm and broadness b d = 6.35 mm,and a stationary block of size 6.35 x 15.75 x 10.16mm 3 . The discs are made of steel 90MnCrV8hardness of 62‐64 HRC with gr<strong>in</strong>ded surfaces.The tests were performed <strong>in</strong> lubricated slid<strong>in</strong>gconditions on the samples with the best structural,mechanical and anti‐corrosive properties.149
M. Babić et al., Tribology <strong>in</strong> Industry Vol. 35, No. 2 (2013) 148‐154Wear, mm 3 x 10 -29876543A356, F 1=40NA356, F 2=80NA356, F 3=120NA356/10SiC/1Gr, F 1=40NA356/10SiC/1Gr, F 2=80NA35610SiC/1Gr, F 3=120NV=0.25 m/s, lubrication21Fig. 2. Tribometer.00 500 1000 1500 2000 2500Slid<strong>in</strong>g distance, mThe values of slid<strong>in</strong>g speed (0.25 m / s, 0.5 m / sand 1 m / s) and the normal loads (40 N, 80 Nand 120 N) are <strong>in</strong> accordance with the plan ofexperiment. The tests are performed for slid<strong>in</strong>gdistance of 2400 m.Wear, mm 3 x 10 -2876543A356, F 1=40NA356, F 2=80NA356, F 3=120NA356/10SiC/1Gr, F 1=40NA356/10SiC/1Gr, F 2=80NA356/10SiC/1Gr, F 3=120NV=0.5 m/s, lubrication2100 500 1000 1500 2000 2500Slid<strong>in</strong>g distance, m8V=1 m/s, lubricationFig. 3. Lubrication of the contact pair.All tests used the same hydraulic lubricant withimproved anti‐wear properties, viscosity VG46(ISO 3848). Lubricant is housed <strong>in</strong> a small tank,and lubrication is done so that the bottom of thedisc is immersed to up to depth of 3 mm <strong>in</strong>to thesmall tank with lubricant, whose volume is 30ml. Dur<strong>in</strong>g rotation of the disc, oil iscont<strong>in</strong>uously <strong>in</strong>troduced <strong>in</strong>to the zone of thecontact and makes boundary lubrication ofcontact pair (Fig. 3).All experiments were repeated 5 times, and themean values of obta<strong>in</strong>ed values are taken asauthoritative.3. RESULTS OF TRIBOLOGICAL TESTSResults of tribological tests of hybrid compositeA356/10SiC/1Gr and basic material A356 areshown <strong>in</strong> the follow<strong>in</strong>g diagrams.Wear, mm 3 x 10 -27654321A356, F 1=40NA356, F 2=80NA356, F 3=120NA356/10SiC/1Gr, F 1=40NA356/10SiC/1Gr, F 2=80NA356/10SiC/1Gr, F 3=120N00 500 1000 1500 2000 2500Slid<strong>in</strong>g distance, mFig. 4. Wear volume for all three values of slid<strong>in</strong>g speed.Diagrams of wear volume are formed on the basisof wear scar which is obta<strong>in</strong>ed by measur<strong>in</strong>g after150 m, 300 m, 1200 m, 2400 m, and they are givenfor all three values of slid<strong>in</strong>g speed (Fig. 4).It is obvious that the wear rate of the hybridcomposites A356/10SiC/1Gr is several timesless than the wear rate of the base materialA356. With <strong>in</strong>crease of slid<strong>in</strong>g speed, wear rateof the hybrid composite A356/10SiC/1Gr andthe base material are decreases. Wear ratedependence has almost l<strong>in</strong>ear dependence for allvalues of the normal loads (Fig. 5).150
M. Babić et al., Tribology <strong>in</strong> Industry Vol. 35, No. 2 (2013) 148‐154Wear rate, mm 3 x10 -5 /m4.03.53.02.52.01.5s=2400 m, lubricationA356, F 1=40 NA356, F 2 =80 NA356, F 3=120 NA356/10SiC/1Gr, F 1 =40 NA356/10SiC/1Gr, F 2=80 NA356/10SiC/1Gr, F 3 =120 NAfter the tribological tests, SEM analysis isperformed for wear scar of base material A356and hybrid A356/10SiC/1Gr composite, whosemicro‐photos are shown <strong>in</strong> Fig. 8.1.00.50.00.00 0.25 0.50 0.75 1.00 1.25Slid<strong>in</strong>g speed, m/sFig. 5. Wear rate dependence on slid<strong>in</strong>g speed.With <strong>in</strong>crease of normal load, wear rate<strong>in</strong>creases. This <strong>in</strong>crease is particularlypronounced at the base material A356 (Fig. 6).a)4.0s=2400 m, lubricationWear rate, mm 3 x10 -5 /m3.53.02.52.01.51.0A356, V 1 =0.25 m/sA356, V 2 =0.5 m/sA356, V 3 =1.0 m/sA356/10SiC/1Gr, V 1 =0.25 m/sA356/10SiC/1Gr, V 2=0.5 m/sA356/10SiC/1Gr, V 3 =1.0 m/s0.50.00 40 80 120 160Load, NFig. 6. Wear rate dependence on normal load.b)Fig. 8. SEM micro‐photos of wear scar: a) basematerial A356, b) hybrid composite A356/10SiC/1Gr.Wear rate dependence on normal load andslid<strong>in</strong>g speed for slid<strong>in</strong>g distance of 2400 m, isshown <strong>in</strong> Fig. 7.4. ANALYSES OF OBTAINED RESULTSThe analyses of the obta<strong>in</strong>ed tribological resultsshow that the wear rate or wear volume is muchlower <strong>in</strong> the hybrid composites A356/10SiC/1Grcompared to the base material. Decrease of wearrate occurs due to the effects of SiC from hybridcomposite <strong>in</strong> contact with a steel disc.Wear rate dependence on normal load and slid<strong>in</strong>gspeed are shown <strong>in</strong> Figs. 9 and 10 as the 3D plots.Wear rate is approximated by exponential functionwith a high correlation coefficient.Fig. 7. Wear rate dependence on normal load andslid<strong>in</strong>g speed.Both tested materials show that at least wearoccurs at the maximum slid<strong>in</strong>g speed of 1 m / sand the m<strong>in</strong>imum normal load of 40 N.151
M. Babić et al., Tribology <strong>in</strong> Industry Vol. 35, No. 2 (2013) 148‐154lead to the creation of mechanically mixed layer(MML). The formation of MML layer ischaracteristic of alum<strong>in</strong>um alloys re<strong>in</strong>forcedwith SiC [18‐23]. Iron accumulates around theSiC particles tak<strong>in</strong>g a position of small particle ofgraphite. At some parts white l<strong>in</strong>es appearenriched with iron oxides, which are consistentwith the slid<strong>in</strong>g direction (Fig. 11).Fig. 9. Wear rate dependence on the base material.Figure 12 shows the SEM photograph of part of thehybrid composite A356/10SiC/1Gr. Wear scar isobta<strong>in</strong>ed by slid<strong>in</strong>g speed of 0.25 m/s and normalload of 120 N <strong>in</strong> conditions of lubrication. At higherloads, the dom<strong>in</strong>ant wear mechanism is abrasivewear. SiC particles (darker) and iron particles(bright colours) are clearly visible on the scar.Confirmation of these assumptions is obta<strong>in</strong>ed byEDS analysis, as shown <strong>in</strong> the two spectrums. Thefirst spectrum shows the presence of SiC particles,and the particles of iron and its oxides can be seenon second spectrum.Fig. 10. Wear rate dependence on the hybridcomposites А356/10SiC/1Gr.Fig. 11. The accumulation of iron <strong>in</strong> the compositeA356/10SiC/1Gr, 120 N, 0.25 m/s.SEM microscopy shows that due to the contact ofthe SiC composites and Si phases from the basicA356, wear of steel disc occurs. Fe particlesenter the surface layer of the composites andFig. 12. EDS analysis A356/10SiC/1Gr, 120 N, 0.25m/s, SEM.152
M. Babić et al., Tribology <strong>in</strong> Industry Vol. 35, No. 2 (2013) 148‐1545. CONCLUSIONWear tests of hybrid composites A356/10SiC/1Grshow their superior performance <strong>in</strong> relation tothe base material A356. Applied compocast<strong>in</strong>gmodified procedure, <strong>in</strong> addition to low prices,confirms the good distribution of re<strong>in</strong>forcements<strong>in</strong> the composite.Wear rate on A356/10SiC/1Gr hybridcomposites is 3 ÷ 8 times lesser than the wearrate on the base material A356. It is especiallybig difference of wear rate at the lowest slid<strong>in</strong>gspeed of 0.25 m / s and maximum normal load of120 N. Wear rate decreases with decrease ofnormal load and <strong>in</strong>crease of slid<strong>in</strong>g speed.SEM microscopy and EDS analysis confirm agood distribution of SiC re<strong>in</strong>forcements <strong>in</strong> thehybrid composite. Also, advent mechanicallymixed layer (MML) is obvious, respectively, theappearance of iron and its oxides <strong>in</strong> the hybridcomposite.ACKNOWLEDGMENTSThis paper presents the research results obta<strong>in</strong>edwith<strong>in</strong> the framework of the project TR–35021,f<strong>in</strong>ancially supported by the M<strong>in</strong>istry ofEducation and Science of the Republic of Serbia.REFERENCES[1] A. Vencl: Tribology of the Al‐Si alloy based MMCsand their application <strong>in</strong> automotive <strong>in</strong>dustry, u:Magagn<strong>in</strong> L. (ed.), Eng<strong>in</strong>eered Metal MatrixComposites: Form<strong>in</strong>g Methods, MaterialProperties and Industrial Applications, NovaScience Publishers, Inc., New York (SAD), pp. 127‐166, 2012.[2] B. Stojanovic, M. Babic, S. Mitrovic, A. Vencl, N.Miloradovic, M. Pantic: Tribologicalcharacteristics of alum<strong>in</strong>ium hybrid compositesre<strong>in</strong>forced with silicon carbide and graphite. Areview, Journal of the Balkan TribologicalAssociation, Vol. 19, No. 1, pp. 83‐96, 2013.[3] N. Miloradovic, B. Stojanovic: Tribologicalbehaviour of ZA27/10SiC/1Gr hybrid composite,Journal of the Balkan Tribological Association,Vol. 19, No. 1, pp. 97‐105, 2013.[4] S. Mitrovic, M. Babic, B. Stojanovic, N.Miloradovic, M. Pantic, D. Dzunic: TribologicalPotential of Hybrid Composites Based on Z<strong>in</strong>c andAlum<strong>in</strong>ium Alloys Re<strong>in</strong>forced with SiC andGraphite Particles, Tribology <strong>in</strong> <strong>in</strong>dustry, Vol. 34,No. 4, pp.177‐185, 2012.[5] P. Rav<strong>in</strong>dran, K. Manisekar, R. Narayanasamy, P.Narayanasamy: Tribological behaviour of powdermetallurgy‐processed alum<strong>in</strong>ium hybridcomposites with the addition of graphite solidlubricant, Ceramics International, Vol. 39, No. 2,pp. 1169‐1182, 2013.[6] S. Basavarajappa, G. Chandramohan, K. Mukund,M. Ashw<strong>in</strong>, M. Prabu: Dry slid<strong>in</strong>g wear behaviorof Al 2219/SiCp‐Gr hybrid metal matrixcomposites, Journal of Materials Eng<strong>in</strong>eer<strong>in</strong>g andPerformance, Vol. 15, No. 6, pp.668‐674, 2006.[7] S. Basavarajappa, G. Chandramohan: Dry slid<strong>in</strong>gwear behavior of hybrid metal matrix composites,Materials Science, Vol. 11, No. 3, pp. 253‐257, 2005.[8] S. Basavarajappa, G. Chandramohan, A.Mahadevan: Influence of slid<strong>in</strong>g speed on the dryslid<strong>in</strong>g wear behaviour and the subsurfacedeformation on hybrid metal matrix composite,Wear, Vol. 262, pp. 1007–1012, 2007.[9] S. Mahdavi, F. Akhlaghi: Effect of SiC content onthe process<strong>in</strong>g, compaction behavior, andproperties of Al6061/SiC/Gr hybrid composites,Journal of Materials Science, Vol. 46, No. 5, pp. 1502‐1511, 2011.[10] F. Akhlaghi, S. Mahdavi: Effect of the SiC Contenton the Tribological Properties of Hybrid Al/Gr/SiCComposites Processed by In Situ PowderMetallurgy (IPM) Method, Advanced MaterialsResearch, pp. 1878‐1886, 2011.[11] S. Suresha, B.K. Sridhara: Wear characteristics ofhybrid alum<strong>in</strong>ium matrix composites re<strong>in</strong>forcedwith graphite and silicon carbide particulates,Orig<strong>in</strong>al Research Article, Composites Scienceand Technology, Vol. 70, No. 11, pp. 1652‐1659,2010.[12] S. Suresha, B.K. Sridhara: Effect of addition ofgraphite particulates on the wear behavior <strong>in</strong>alum<strong>in</strong>ium–silicon carbide–graphite composites,Materials & Design, Vol. 31, pp. 1804–1812, 2010.[13] S. Suresha, B.K. Sridhara: Effect of silicon carbideparticulates on wear resistance of graphiticalum<strong>in</strong>ium matrix composites, Materials &Design, Vol. 31, No. 9, pp. 4470‐4477, 2010.[14] S. Suresha, B.K. Sridhara: Friction characteristicsof alum<strong>in</strong>ium silicon carbide graphite hybridcomposites, Materials & Design, Vol. 34, pp. 576‐583, 2012.[15] W. Ames, A.T. Alpas: Wear mechanisms <strong>in</strong> hybridcomposites of graphite‐20% SiC <strong>in</strong> A356alum<strong>in</strong>um alloy, Metall. Mater. Trans. A, Vol. 26, pp.85‐98, 1995.153
M. Babić et al., Tribology <strong>in</strong> Industry Vol. 35, No. 2 (2013) 148‐154[16] A. Vencl, I. Bobic, S. Arostegui, B. Bobic, A.Mar<strong>in</strong>kovic, M. Babic: Structural, mechanical andtribological properties of A356 alum<strong>in</strong>ium alloyre<strong>in</strong>forced with Al 2 O 3 , SiC and SiC + graphiteparticles, Journal of Alloys and Compounds, Vol.506, pp. 631‐639, 2010.[17] A. Vencl, I. Bobic, B. Stojanovic: Tribologicalproperties of A356 Al‐Si alloy composites underdry slid<strong>in</strong>g conditions, Industrial Lubrication andTribology, Vol. 66, No. 3, 2014 (<strong>in</strong> pr<strong>in</strong>t).[18] J. Rodriguez, P. Poza, M.A. Garrido, A. Rico: Dryslid<strong>in</strong>g wear behaviour of alum<strong>in</strong>ium–lithiumalloys re<strong>in</strong>forced with SiC particles, Wear, Vol.262, pp. 292–300, 2007.[19] L. Jung‐moo, K. Suk‐bong, H. Jianm<strong>in</strong>: Dry slid<strong>in</strong>gwear of MAO‐coated A356/ 20 vol.% SiCpcomposites <strong>in</strong> the temperature range 25–180 °C,Wear, Vol. 264, pp. 75–85, 2008.[20] R.N. Rao, S. Das, D.P. Mondal, G. Dixit: Effect ofheat treatment on the slid<strong>in</strong>g wear behaviour ofalum<strong>in</strong>ium alloy (Al– Zn–Mg) hard particlecomposite, Tribology International, Vol. 43, pp.330–339, 2010.[21] M. Gui, S.B. Kang: Dry slid<strong>in</strong>g wear behavior ofplasma‐sprayed alum<strong>in</strong>um hybrid compositecoat<strong>in</strong>g, Metall. Mater. Trans., A Vol. 32A, pp.2383–2392, 2001.[22] A.K. Mondal, S. Kumar: Dry slid<strong>in</strong>g wearbehaviour of magnesium alloy based hybridcomposites <strong>in</strong> the longitud<strong>in</strong>al direction, Wear,Vol. 267, pp. 458–466, 2009.[23] R.N. Rao, S. Das, D.P. Mondal, G. Dixit: Dry slid<strong>in</strong>gwear behaviour of cast high strength alum<strong>in</strong>iumalloy (Al–Zn–Mg) and hard particle composites,Wear, Vol. 267, pp. 1688–1695, 2009.154
Vol. 35, No. 2 (2013) 155‐162Tribology <strong>in</strong> Industrywww.<strong>tribology</strong>.f<strong>in</strong>k.rsRESEARCHStresses and Deformations Analysis of a Dry FrictionClutch SystemO.I. Abdullah a , J. Schlattmann a , A.M. Al‐Shabibi ba Department of System Technology and Mechanical Design Methodology, Hamburg University of Technology, Germany,b Department of Mechanical and Industrial Eng. College of Eng. / Sultan Qaboos Univeristy, Sultanate of Oman.Keywords:Dry friction clutchStresses and deformationsPressure distributionFull engagement2D axisymmetric FEMCorrespond<strong>in</strong>g author:O.I. AbdullahDepartment of System Technologyand Mechanical Design Methodology,Hamburg University of Technology,GermanyE‐mail: oday.abdullah@tu‐harburg.deA B S T R A C TThe friction clutch is considered the essential element <strong>in</strong> the torquetransmission process. In this paper, the f<strong>in</strong>ite element method is used tostudy the stresses and deformations for clutch system (pressure plate,clutch disc and flywheel) due to the contact pressure of diaphragm spr<strong>in</strong>gand the centrifugal force dur<strong>in</strong>g the full engagement of clutch disc(assum<strong>in</strong>g no slipp<strong>in</strong>g between contact surfaces). The <strong>in</strong>vestigationcovers the effect of the contact stiffness factor FKN on the pressuredistribution between contact surfaces, stresses and deformations. Thepenalty and Augmented Lagrangian algorithms have been used to obta<strong>in</strong>the pressure distribution between contact surfaces. ANSYS13 softwarehas been used to perform the numerical calculation <strong>in</strong> this paper.© 2013 Published by Faculty of Eng<strong>in</strong>eer<strong>in</strong>g1. INTRODUCTIONA clutch is a very important mach<strong>in</strong>e elementwhich plays a ma<strong>in</strong> role <strong>in</strong> the transmission ofpower (and eventually motion) from onecomponent (the driv<strong>in</strong>g part of the mach<strong>in</strong>e) toanother (the driven part). A common and wellknown application for the clutch is <strong>in</strong>automotive vehicles where it is used to connectthe eng<strong>in</strong>e and the gearbox. Furthermore, theclutch is used also extensively <strong>in</strong> productionmach<strong>in</strong>ery of all types. When the friction clutchbeg<strong>in</strong>s to engage, slipp<strong>in</strong>g occurs between thecontact surfaces (pressure plate, clutch disc andflywheel) and due to this slipp<strong>in</strong>g, heat energywill be generated <strong>in</strong> the <strong>in</strong>terfaces frictionsurfaces. At high relative slid<strong>in</strong>g velocity, highquantity of frictional heat is generated whichlead to high temperature rise on the clutch discsurfaces and hence thermo‐mechanicalproblems such as thermal deformations andthermo‐elastic <strong>in</strong>stability can occur. This <strong>in</strong> turn,can lead to thermal crack<strong>in</strong>g and high rate ofwear. The pressure distribution is essentialfactor effect on the performance of the frictionclutch because of the heat generated betweencontact surfaces dur<strong>in</strong>g the slipp<strong>in</strong>g perioddependent on the pressure distribution.Al‐Shabibi and Barber [1] used the f<strong>in</strong>iteelement method to f<strong>in</strong>d the transient solution ofthe temperature field and contact pressuredistribution between two slid<strong>in</strong>g disks. Twodimensional axisymmetric FE model used to155
O.I. Abdullah et al., Tribology <strong>in</strong> Industry Vol. 35, No. 2 (2013) 155‐162explore an alternative method based on aneigenfunction expansion and a particularsolution that can be used to solve thethermoelastic contact problem with frictionalheat<strong>in</strong>g. Both constant and vary<strong>in</strong>g slid<strong>in</strong>g speedis considered <strong>in</strong> this analysis. Results of thedirect f<strong>in</strong>ite element simulation have beenobta<strong>in</strong>ed us<strong>in</strong>g the commercial packageABAQUS. The results from the approximatesolution show a good agreement with the resultsfrom the direct f<strong>in</strong>ite element simulation.Lee et al. [2] used f<strong>in</strong>ite element method to studythe effect of thermo‐mechanical loads on thepressure plate and the hub plate of the frictionclutch system. Three types of loads are tak<strong>in</strong>g<strong>in</strong>to consideration the thermal load due to theslipp<strong>in</strong>g occurs at the beg<strong>in</strong>n<strong>in</strong>g of engagement,the contact pressure of diaphragm spr<strong>in</strong>g andthe centrifugal force due to the rotation. Twoand three dimensional f<strong>in</strong>ite element modelswere performed to obta<strong>in</strong> the temperaturedistributions and the stresses. The results showthe significant effect of the thermal load on thetemperatures and stresses; therefore it isdesirable to <strong>in</strong>crease the thickness of thepressure plate as much as possible to <strong>in</strong>creasethe thermal capacity of the pressure plate toreduce the thermal stresses. High stress<strong>in</strong>tensity value occurs around the fillet region ofthe w<strong>in</strong>dow <strong>in</strong> the hub plate.Shahzamanian et al. [3] used numerical simulationto study the transient and contact analysis offunctionally graded (FG) brake disk. The materialproperties vary <strong>in</strong> the radial direction from fullmetalat the <strong>in</strong>ner radius to that of full‐ceramic atthe outer radius. The coulomb contact friction isconsidered between the pad and the brake disk.Two‐dimensional f<strong>in</strong>ite element model used <strong>in</strong>the work to obta<strong>in</strong>s the pressure distribution,total stresses, pad penetration, friction stresses,heat flux and temperature dur<strong>in</strong>g the contact fordifferent values of the contact stiffness factor. Itwas found, that the contact pressure and contacttotal stress <strong>in</strong>crease when the contact stiffnessfactor <strong>in</strong>creases and the gradation of the metal–ceramic has significant effect on the thermomechanicalresponse of FG brake disks. Also, itcan be concluded when the thickness of the pad<strong>in</strong>creases the contact status between pad anddisc changes from stick<strong>in</strong>g to contact and then tonear contact.Abdullah and Schlattmann [4‐8] <strong>in</strong>vestigated thetemperature field and the energy dissipated ofdry friction clutch dur<strong>in</strong>g a s<strong>in</strong>gle and repeatedengagement under uniform pressure anduniform wear conditions. They also studied theeffect of pressure between contact surface whenvary<strong>in</strong>g with time on the temperature field andthe <strong>in</strong>ternal energy of clutch disc us<strong>in</strong>g twoapproaches heat partition ratio approach tocompute the heat generated for each part<strong>in</strong>dividually whereas the second applies the totalheat generated for the whole model us<strong>in</strong>gcontact model. Furthermore, they studied theeffect of engagement time and slid<strong>in</strong>g velocityfunction, thermal load and dimensionless discradius (<strong>in</strong>ner disc radius/outer disc radius) onthe thermal behavior of the friction clutch <strong>in</strong> thebeg<strong>in</strong>n<strong>in</strong>g of engagement.In this paper the f<strong>in</strong>ite element method used tostudy the contact pressure and stresses dur<strong>in</strong>gthe full engagement period of the clutches us<strong>in</strong>gdifferent contact algorithms. Moreover,sensitivity study for the contact pressure ispresented to <strong>in</strong>dicate the importance of thecontact stiffness between contact surfaces.2. FUNDAMENTAL PRINCIPLESThe ma<strong>in</strong> system of the friction clutch consists ofpressure plate, clutch disc and flywheel asshown <strong>in</strong> Fig. 1.When the clutch starts to engage the slipp<strong>in</strong>gwill occur between contact surfaces due to thedifference <strong>in</strong> the velocities between them(slipp<strong>in</strong>g period), after this period all contactsparts are rotat<strong>in</strong>g at the same velocity withoutslipp<strong>in</strong>g (full engagement period). A highamount of the k<strong>in</strong>etic energy converted <strong>in</strong>to heatenergy at <strong>in</strong>terfaces accord<strong>in</strong>g to the first law ofthermodynamics dur<strong>in</strong>g the slipp<strong>in</strong>g period andthe heat generated between contact surfaces willbe dissipated by conduction between frictionclutch components and by convection toenvironment, <strong>in</strong> addition to the thermal effectdue to the slipp<strong>in</strong>g there is other load conditionwhich is the pressure contact between contactsurfaces. In the second period, there are threetypes of load conditions the temperaturedistribution from the last period (slipp<strong>in</strong>gperiod), the pressure between contact surfacesdue to the axial force of diaphragm spr<strong>in</strong>g and156
O.I. Abdullah et al., Tribology <strong>in</strong> Industry Vol. 35, No. 2 (2013) 155‐162the centrifugal force due to the rotation of thecontacts parts. Figure 2 shows the loadconditions dur<strong>in</strong>g the engagement cycle of theclutch, where t s is the slipp<strong>in</strong>g time and T is thetransmitted torque by clutch.thermodynamics dur<strong>in</strong>g the slipp<strong>in</strong>g period andthe heat generated between contact surfaces willbe dissipated by conduction between frictionclutch components and by convection toenvironment, <strong>in</strong> addition to the thermal effectdue to the slipp<strong>in</strong>g there is other load conditionwhich is the pressure contact between contactsurfaces. In the second period, there are threetypes of load conditions the temperaturedistribution from the last period (slipp<strong>in</strong>gperiod), the pressure between contact surfacesdue to the axial force of diaphragm spr<strong>in</strong>g andthe centrifugal force due to the rotation of thecontacts parts. Figure 2 shows the loadconditions dur<strong>in</strong>g the engagement cycle of theclutch, where t s is the slipp<strong>in</strong>g time and T is thetransmitted torque by clutch.FlywheelClutch discPressure plate3. FINITE ELEMENT FORMULATIONThis section presented the steps to simulate thecontact elements of friction clutch us<strong>in</strong>g ANSYSsoftware. Moreover it gives more details aboutthe types of contacts and algorithms which areused <strong>in</strong> this software.TTorqueFig. 1. The ma<strong>in</strong> parts of clutch system.Thermal +Contact pressureSlipp<strong>in</strong>g period(Transient case)Thermal +Contact pressure+Centrifugal effectFull engagementperiod(Steady-statecase)The first step <strong>in</strong> this analysis is the modell<strong>in</strong>g;due to the symmetry <strong>in</strong> the geometry (frictionall<strong>in</strong><strong>in</strong>g without grooves) and boundaryconditions of the friction clutch (take <strong>in</strong>to theconsideration the effect of the pressure andcentrifugal force loads, and neglected the effectof thermal load due to the slipp<strong>in</strong>g), twodimensionalaxisymmetric FEM can be used torepresent the contact between the clutchelements dur<strong>in</strong>g the steady‐state period asshown <strong>in</strong> Fig. 3.FlywheelTimeFig. 2. The load conditions dur<strong>in</strong>g theengagement cycle of the clutchWhen the clutch starts to engage the slipp<strong>in</strong>gwill occur between contact surfaces due to thedifference <strong>in</strong> the velocities between them(slipp<strong>in</strong>g period), after this period all contactsparts are rotat<strong>in</strong>g at the same velocity withoutslipp<strong>in</strong>g (full engagement period). A highamount of the k<strong>in</strong>etic energy converted <strong>in</strong>to heatenergy at <strong>in</strong>terfaces accord<strong>in</strong>g to the first law oft szrThe frictional l<strong>in</strong><strong>in</strong>gPressure plateFig. 3. The Contact model for clutch system.AxialThere are three basic types of contact used <strong>in</strong>Ansys software s<strong>in</strong>gle contact, node‐to‐surfacecontact and surface‐to‐surface contact. Surfaceto‐surfacecontact is the most commonly type ofcontact used for bodies that have arbitraryshapes with relative large contact areas. This157
O.I. Abdullah et al., Tribology <strong>in</strong> Industry Vol. 35, No. 2 (2013) 155‐162type of contact is most efficient for bodies thatexperience large values of relative slid<strong>in</strong>g suchas block slid<strong>in</strong>g on plane or sphere slid<strong>in</strong>g with<strong>in</strong>groove [9]. Surface‐to‐surface contact is the typeof contact assumed <strong>in</strong> this analysis because ofthe large areas of clutch elements <strong>in</strong> contact.In this work, it has been assumed two types of loadconditions effects on the clutch system dur<strong>in</strong>g thesteady‐state period (full engagement period) thecontact pressure between clutch elements due tothe axial force by diaphragm spr<strong>in</strong>g and thecentrifugal force due to the rotation.The elements used for contact model are: “Plan13” used for all elements of the clutch(flywheel, clutch disc and pressure plate). “Conta172” used for contact surfaces thatare the upper and lower surfaces of clutchdisc. “Targe169” used for the target surfaces thatare the lower surface of the flywheel and theupper surface of the pressure plate.Figure 4 shows the details about schematic forall elements that has been used <strong>in</strong> this analysis.Flywheelamount of penetration and low enough tofacilitate convergence of the solution. Thecontact stiffness for an element of area A iscalculated us<strong>in</strong>g the follow<strong>in</strong>g formula [10]:fefTFkn i idA (1)The default value of the contact stiffness factorFKN is 1, and it is appropriate for bulkdeformation. If bend<strong>in</strong>g deformation dom<strong>in</strong>atesthe solution, a smaller value of KKN = 0.1 isrecommended.There are five algorithms used for surface‐tosurfacecontact type are: Penalty method: this algorithm used constant“spr<strong>in</strong>g” to establish the relationship betweenthe two contact surfaces (Fig. 5). The contactforce (pressure) between two contact bodiescan be written as follows:F k x(2)nWhere F n is the contact force, k n is the contactstiffness and x p is the distance between twoexist<strong>in</strong>g nodes or separate contact bodies(penetration or gap).npF nClutch disck nx pTarge169Plane13Conta172Fig. 5. The contact stiffness between two contact bodies.Pressure plateFig. 4. Schematic elements used for the friction clutchelements.The stiffness relationship between contact andtarget surfaces will decide the amount of thepenetration. Higher values of contact stiffnesswill decrease the amount of penetration, but canlead to ill‐condition<strong>in</strong>g of the global stiffnessmatrix and convergence difficulties. Lowervalues of contact stiffness can lead to certa<strong>in</strong> Augmented Lagrange (default): this algorithmis an iterative penalty method. The constanttraction (pressure and frictional stresses) areaugmented dur<strong>in</strong>g equilibrium iterations sothat the f<strong>in</strong>al penetration is small than theallowable tolerance. This method usuallyleads to better condition<strong>in</strong>g and is lesssensitive to the magnitude of the constantstiffness. The contact force (pressure)between two contact bodies is:F k x (3)nwhere λ is the Lagrange multiplier component.np158
O.I. Abdullah et al., Tribology <strong>in</strong> Industry Vol. 35, No. 2 (2013) 155‐162 Lagrange multiplier on contact normal andpenalty on tangent: this method applied onthe constant normal and penalty method(tangential contact stiffness) on the frictionalplane. This method enforces zero penetrationand allows small amount of slip for thestick<strong>in</strong>g contact condition. It requireschatter<strong>in</strong>g control parameters, as well as themaximum allowable elastic slip parameter. Pure Lagrange multiplier on contact normaland tangent: This method enforces zeropenetration when contact is closed and “zeroslip” when stick<strong>in</strong>g contact occurs. Thisalgorithm does not require contact stiffness.Instead it requires chatter<strong>in</strong>g controlparameters. This method adds contacttraction to the model as additional degrees offreedom and requires additional iterations tothe stabilize contact conditions. It often<strong>in</strong>crease the computational cost compared tothe augmented lagrangian method. Internal multipo<strong>in</strong>t constra<strong>in</strong>t: this methodused <strong>in</strong> conjunction with bonded contact andno separation contact to model several typesof contact assemblies and k<strong>in</strong>ematicconstra<strong>in</strong>ts.The axisymmetric f<strong>in</strong>ite element model of thefriction clutch system with boundary conditionsis shown <strong>in</strong> Fig. 6. A mesh sensitivity study wasdone to choose the optimum mesh fromcomputational accuracy po<strong>in</strong>t of view.zrωFlywheelClutch discPressure plateU x =0PressureContactsurfacesFig. 6. FE models with the boundary conditions.The full Newton‐Raphson with unsymmetricmatrices of elements is used <strong>in</strong> this analysisassum<strong>in</strong>g a large‐deflection effect. In allcomputations for the friction clutch model, it hasbeen assumed a homogeneous and isotropicmaterial and all parameters and materialsproperties are listed <strong>in</strong> Table. 1.In this analysis also assum<strong>in</strong>g there are nocracks <strong>in</strong> the contact surfaces and the actualcontact area is equal to the nom<strong>in</strong>al contact area.Table 1. The properties of materials and operations.ParametersValuesInner radius of friction material & axial cushion, ri [m] 0.06298Outer radius of friction material & axial cushion, ro [m] 0.08721Thickness of friction material [m], tl 0.003Thickness of the axial cushion [m], taxi. 0.0015Inner radius of pressure plate [m], rip 0.05814Outer radius of pressure plate [m], rop 0.09205Thickness of the pressure plate [m], tp 0.00969Inner radius of flywheel [m], rif 0.04845Outer radius of flywheel [m], rof 0.0969Thickness of the flywheel [m], tf 0.01938pressure, p [MPa] 1Coefficient of friction, μ 0.2Number of friction surfaces, n 2Torque [Nm], T 432Maximum angular slipp<strong>in</strong>g speed, ωo [rad/sec] 200Young’s modulus for friction material, El [GPa] 0.30Young’s modulus for pressure plate, flywheel &axial cushion, (Ep, Ef, and Eaxi), [Gpa]125Poisson’s ratio for friction material, 0.25Poisson’s ratio for pressure plate, flywheel &axial cushion0.25Density for friction material, (kg/m 3 ), ρl 2000Density for pressure plate, flywheel & axialcushion, (kg/m 3 ), (ρp, ρf, and ρaxi)78004. RESULTS AND DISCUSSIONSSeries of computations have been carried out us<strong>in</strong>gANSYS13 software to study the contact pressureand stresses between contact surfaces of clutch(pressure plate, clutch disc and flywheel) dur<strong>in</strong>g afull engagement period us<strong>in</strong>g different algorithmsand contact stiffness factor values.The variation of the contact pressure with discradius for both sides of clutch disc (flywheel sideand pressure plate side) us<strong>in</strong>g penalty andaugmented algorithms (FKN = 1) is shown <strong>in</strong>Figs. 7 and 8. From these figures, it can be seenthat the identical results when us<strong>in</strong>g penalty andaugmented (default) methods andapproximately the same behaviour of contact159
O.I. Abdullah et al., Tribology <strong>in</strong> Industry Vol. 35, No. 2 (2013) 155‐162pressure for both sides of clutch disc. Themaximum contact pressure values <strong>in</strong> theflywheel side and pressure plate side are foundto be 1.491 MPa and 1.524 MPa, respectively.The maximum and m<strong>in</strong>imum contact pressurevalues occur at outer disc radius r o and near <strong>in</strong>nerradius (1.01 r i ) for both cases, respectively.The contact pressure [MPa]1.61.551.51.451.41.351.31.251.21.151.11.051Penalty methodAugmented method0.065 0.07 0.075 0.08 0.085r [m]Fig. 7. The variation of contact pressure with discradius (flywheel / clutch disc).The contact pressure [MPa]1.61.551.51.451.41.351.31.251.21.151.11.051Penalty methodAugmented method0.065 0.07 0.075 0.08 0.085r[m]Fig. 8. The variation of contact pressure with discradius (pressure plate / clutch disc).Figures 9 and 10 show the variation of total contactstresses with disc radius for both sides of clutchdisc. It can be seen, that the total contact stresseshave the same behaviour of the contact pressure.Figures 11 and 12 demonstrate the variation oftotal displacement of clutch surfaces with discradius. It’s clear the values of total deformations ofclutch disc (pressure plate side) are higher thanthe displacements values at the flywheel side. Themaximum values of total deformation <strong>in</strong> the clutchdisc at flywheel and pressure plate sides are foundto be 4.6529 E ‐6 m and 2.84 E ‐5 m, respectively.The contact total stress [MPa]1.61.551.51.451.41.351.31.251.21.151.11.051Penalty methodAugmented method0.065 0.07 0.075 0.08 0.085r [m]Fig. 9. The variation of total contact stress with discradius (flywheel / clutch disc).The contact total stress [MPa]1.61.551.51.451.41.351.31.251.21.151.11.051Penalty methodAugmented method0.065 0.07 0.075 0.08 0.085r [m]Fig. 10. The variation of total contact stress with discradius (pressure plate / clutch disc).The variation of the contact pressure for us<strong>in</strong>gdifferent algorithms and different values of FKNalong the radial direction at contact area ofclutch disc with flywheel is shown <strong>in</strong> Figs. 13and 14. It can be noted for both cases (whenus<strong>in</strong>g penalty and augmented method), that thevalues of contact pressure <strong>in</strong>creases when FKN<strong>in</strong>creases. The percentage <strong>in</strong>creas<strong>in</strong>g <strong>in</strong> contactpressure when FKN change from 0.01 to 10 isfound to be 19.5 % and 17.9 % correspond<strong>in</strong>g topenalty and augmented methods, respectively.160
O.I. Abdullah et al., Tribology <strong>in</strong> Industry Vol. 35, No. 2 (2013) 155‐1625E-06The total displacement [m]4.5E-064E-063.5E-063E-062.5E-062E-06Penalty methodAugmented methodThe contact pressure [MPa]1.7 FKN = 0.01FKN = 0.1FKN = 1FKN = 001.61.51.41.31.5E-060.065 0.07 0.075 0.08 0.085r [m]Fig. 11. The variation of total displacement with discradius (flywheel/clutch disc).3E-051.20.065 0.07 0.075 0.08 0.085r [m]Fig. 14. The variation of contact pressure with discradius us<strong>in</strong>g augmented Lagrange algorithm(flywheel/clutch disc).The total displacement [m]2.8E-052.6E-052.4E-052.2E-052E-05Penalty methodAugmented method0.065 0.07 0.075 0.08 0.085r[m]Fig. 12. The variation of total displacement with discradius (pressure plate/clutch disc).The contact pressure [MPa]1.7 FKN = 0.01FKN = 0.1FKN = 1FKN = 101.61.51.41.31.20.065 0.07 0.075 0.08 0.085r [m]Fig. 13. The variation of contact pressure with discradius us<strong>in</strong>g Penalty method (flywheel/clutch disc).5. CONCLUSIONS AND REMARKSThe variations of the contact pressure, totalcontact stress and total displacements of thefriction clutch us<strong>in</strong>g different contact algorithmsand different values of FKN are <strong>in</strong>vestigated.Two‐dimensional axisymmetric f<strong>in</strong>ite elementmodel for the contact elements of clutch wereconducted to obta<strong>in</strong> the numerical results.The present work presents a simplified model ofclutch to determ<strong>in</strong>e the contact pressurebetween contact surfaces dur<strong>in</strong>g a fullengagement period.The conclusions obta<strong>in</strong>ed from the presentanalysis are summarized as follows:1. The value of FKN is very important andeffective on the values of contact pressure,the contact pressure is directly proportionalto FKN for both contact methods (penaltyand augmented).2. The penalty method has sensitivity for FKNmore than the augmented method.3. The maximum and m<strong>in</strong>imum values ofcontact pressure and total contact stressoccur at outer disc radius and <strong>in</strong>ner discradius, respectively.The permanent deformations and thermalcracks on the contact surfaces of clutch if taken<strong>in</strong>to consideration will affect the contact161
O.I. Abdullah et al., Tribology <strong>in</strong> Industry Vol. 35, No. 2 (2013) 155‐162pressure distribution and the actual contact areawill change. These disadvantages will focus thecontact pressure on small region compared withthe nom<strong>in</strong>al contact area.REFERENCES[1] Abdullah M. Al‐Shabibi and James R. Barber:Transient Solution of The UnperturbedThermoelastic Contact Problem, J. thermalstresses, Vol. 32, pp. 226‐243, 2009.[2] Choon Yeol Lee, Il Sup Chung, Young Suck Chai:F<strong>in</strong>ite Element Analysis of an Automobile ClutchSystem, J. Key Eng. Materials, Vol. 353‐358, pp.2707‐2711, 2007.[3] M.M. Shahzamanian, B.B. Sahari , M. Bayat, Z.N.Ismarrubie and F. Mustapha: Transient andthermal contact analysis for the elastic behavior offunctionally graded brake disks due to mechanicaland thermal loads, J. Materials & Design, Vol. 31,Issue 10, pp. 4655–4665, 2010.[4] Oday I. Abdullah and Josef Schlattmann: The Effectof Disc Radius on Heat Flux and TemperatureDistribution <strong>in</strong> Friction Clutches, J. AdvancedMaterials Research, Vol. 505, pp. 154‐164, 2012.[5] Oday I. Abdullah and Josef Schlattmann: F<strong>in</strong>iteElement Analysis of Dry Friction Clutch with Radialand Circumferential Grooves, Proceed<strong>in</strong>g of WorldAcademy of Science, Eng<strong>in</strong>eer<strong>in</strong>g and TechnologyConference, Paris, pp. 1279‐1291, 2012.[6] Oday I. Abdullah and Josef Schlattmann: Effect ofBand Contact on the Temperature Distribution forDry Friction Clutch, Proceed<strong>in</strong>g of WorldAcademy of Science, Eng<strong>in</strong>eer<strong>in</strong>g and TechnologyConference, Berl<strong>in</strong>, pp. 167‐177, 2012.[7] Oday I. Abdullah and Josef Schlattmann: TheCorrection Factor for Rate of Energy Generated <strong>in</strong>the Friction Clutches under Uniform PressureCondition, J. Adv. Theor. Appl. Mech., Vol. 5, No. 6,pp. 277 – 290, 2012.[8] Oday I. Abdullah and Josef Schlattmann: F<strong>in</strong>iteElement Analysis of Temperature Field <strong>in</strong>Automotive Dry Friction Clutch, J. Tribology <strong>in</strong>Industry, Vol. 34, No. 4, pp. 206‐216, 2012.[9] ANSYS Contact Technology Guide, ANSYS Release11.0 Documentation, ANSYS, Inc.[10] Mohr GA: A contact stiffness matrix for f<strong>in</strong>iteelement problems <strong>in</strong>volv<strong>in</strong>g external elasticrestra<strong>in</strong>t, Compos Struct., Vol. 12, pp. 189–91, 1979.162
Vol. 35, No. 2 (2013) 163‐172Tribology <strong>in</strong> Industrywww.<strong>tribology</strong>.f<strong>in</strong>k.rsRESEARCHInfluence of Rice Husk Ash – Silicon Carbide WeightRatios on the Mechanical behaviour of Al‐Mg‐SiAlloy Matrix Hybrid CompositesK.K. Alaneme a , T.M. Adewale a,ba Department of Metallurgical and Materials Eng<strong>in</strong>eer<strong>in</strong>g Federal University of Technology, Akure, P.M.B 704, Nigeria,b Faculty of Eng<strong>in</strong>eer<strong>in</strong>g and Physical Sciences, School of Materials, University of Manchester, Manchester, United K<strong>in</strong>gdom.Keywords:Alum<strong>in</strong>ium matrix compositesRice husk ashMechanical propertiesScan electron microscopyStir cast<strong>in</strong>gSilicon carbideCorrespond<strong>in</strong>g author:Kenneth K. Alanemea Department of Metallurgical andMaterials Eng<strong>in</strong>eer<strong>in</strong>g FederalUniversity of Technology, Akure,P.M.B 704, NigeriaE‐mail: kkalaneme@gmail.comA B S T R A C TThe <strong>in</strong>fluence of rice husk ash (RHA) and silicon carbide (SiC) weight ratioon the mechanical behaviour of Al‐Mg‐Si alloy matrix hybrid composites was<strong>in</strong>vestigated. RHA and SiC mixed <strong>in</strong> weight ratios 0:1, 1:3, 1:1, 3:1, and 1:0were utilized to prepare 5, 7.5 and 10 wt% of the re<strong>in</strong>forc<strong>in</strong>g phase with Al‐Mg‐Si alloy as matrix us<strong>in</strong>g two‐step stir cast<strong>in</strong>g method. Densitymeasurement, estimated percent porosity, tensile properties, fracturetoughness, and SEM exam<strong>in</strong>ation were used to characterize the compositesproduced. The results show that the composites were of good cast<strong>in</strong>g qualityas the estimated porosity values were less than 2.5 % <strong>in</strong> all grades produced.For the three weight percent worked on, the tensile‐, yield‐, and specificstrength decreases with <strong>in</strong>crease <strong>in</strong> the weight proportion of RHA <strong>in</strong> theRHA‐SiC re<strong>in</strong>forcement. However, the results show that the composites withcomposition of 1:3 weight ratio RHA:SiC (25% RHA: 75% SiC) offerscomparable specific strength values with the s<strong>in</strong>gle SiC re<strong>in</strong>forced Alcomposite grades. The stra<strong>in</strong> to fractures was <strong>in</strong>variant to the weight ratioof RHA/SiC for all weight percent but the composite compositionsconta<strong>in</strong><strong>in</strong>g RHA had improved fracture toughness compared with the s<strong>in</strong>gleSiC re<strong>in</strong>forced Al composite grades.© 2013 Published by Faculty of Eng<strong>in</strong>eer<strong>in</strong>g1. INTRODUCTIONAlternative sources of re<strong>in</strong>forcements that offerthe potential of produc<strong>in</strong>g Alum<strong>in</strong>ium matrixcomposites (AMCs) at reduced cost whilema<strong>in</strong>ta<strong>in</strong><strong>in</strong>g high performance levels isattract<strong>in</strong>g <strong>in</strong>terests from researchers [1‐2].Compared to other eng<strong>in</strong>eer<strong>in</strong>g materials, AMCsare noted for the rare comb<strong>in</strong>ation of propertiesthey offer such as high specific strength andstiffness, good wear and corrosion resistance,low thermal coefficient of expansion, good hightemperature mechanical properties, andexcellent thermal management potentials amongothers [3‐5]. Alum<strong>in</strong>ium based matrices alsohave the advantage that they are the cheapestamong other compet<strong>in</strong>g matrix materials(Copper, Titanium, Magnesium) for metal matrixcomposites (MMCs) development; and also areamenable to process<strong>in</strong>g us<strong>in</strong>g techniques163
K.K. Alaneme and T.M. Adewale, Tribology <strong>in</strong> Industry Vol. 35, No. 2 (2013) 163‐172conventionally suited for the production ofmetals and alloys [6‐7].The unique properties of AMCs are derived fromthe material characteristics of both the matrixand the re<strong>in</strong>forc<strong>in</strong>g phases [8]. There<strong>in</strong>forcements are responsible for the improvedmechanical, wear, and high temperatureproperties of the AMCs [9‐10]. Thus the type ofre<strong>in</strong>forcement and re<strong>in</strong>forcement parameterssuch as size, volume fraction, distribution, shape,and orientation often affect significantly theproperties of AMCs [11]. The use of cheapersource of re<strong>in</strong>forcements such as <strong>in</strong>dustrialwastes (fly ash, red mud) [12‐13] and agrowastes (rice husk ash, bamboo leaf ash, coconutshell ash) [14‐15] for AMCs development isga<strong>in</strong><strong>in</strong>g popularity consider<strong>in</strong>g its advantage <strong>in</strong>solid waste recycl<strong>in</strong>g which has been a cause formajor concern over the years. Additional to theadvantages of low cost, availability <strong>in</strong> largequantities, and contributions to creation of amore eco‐friendly environment; is lowerdensities which most of the agro and <strong>in</strong>dustrialwastes possess <strong>in</strong> comparison with the syntheticre<strong>in</strong>forcements such as silicon carbide (SiC) andalum<strong>in</strong>a (Al 2 O 3 ) [16]. The properties achievedwith the sole utilization of these cheaper sourcere<strong>in</strong>forcements have been reported to be lowerthan that of the synthetic re<strong>in</strong>forced but withpromise for use <strong>in</strong> semi‐structural and thermalmanagement applications [17]. The use ofhybrid re<strong>in</strong>forcements utiliz<strong>in</strong>g SiC/Al 2 O 3 andagro waste ashes as a means of improv<strong>in</strong>g theproperties of AMCs has attracted <strong>in</strong>terestrecently with very encourag<strong>in</strong>g results obta<strong>in</strong>ed[18‐19].The present work is aimed at <strong>in</strong>vestigat<strong>in</strong>g the<strong>in</strong>fluence of the weight ratios of rice husk ash andsilicon carbide on the mechanical behaviourAlum<strong>in</strong>ium matrix hybrid composites hav<strong>in</strong>g variedweight percent of both re<strong>in</strong>forcements. Themotivation for this work is to establish optimumRHA/SiC weight ratios required to achieveoptimized performance of low cost AMCs developedwith the use of rice husk. Literatures on the use ofsynthetic/agrowaste hybrid re<strong>in</strong>forcements forAMCs development are still very limited and thereis currently none that the authors are aware of thatdiscusses the use of RHA and SiC as hybridcomposites <strong>in</strong> Al‐Mg‐Si alloy matrix.2. MATERIALS AND METHOD2.1 MaterialsAl‐Mg‐Si alloy billets with chemical compositiondeterm<strong>in</strong>ed us<strong>in</strong>g spark spectrometric analysis(Table 1) was selected as Alum<strong>in</strong>ium matrix forthis <strong>in</strong>vestigation. For the hybrid re<strong>in</strong>forc<strong>in</strong>gphases, silicon carbide (SiC) and rice husk ash(RHA) were selected. The silicon carbideprocured was of high chemical purity withaverage particle size of 28 µm while rice husksutilized for the process<strong>in</strong>g of rice husk ash wasobta<strong>in</strong>ed from Igbemo‐Ekiti, Ekiti State (a riceproduc<strong>in</strong>g community <strong>in</strong> south western Nigeria).Magnesium for improv<strong>in</strong>g wettability betweenthe Al‐Mg‐Si alloy and the re<strong>in</strong>forcements wasalso procured.Table 1. Elemental composition of Al‐Mg‐Si alloy.Elementwt%Si 0.4002Fe 0.2201Cu 0.008Mn 0.0109Mg 0.3961Cr 0.0302Zn 0.0202Ti 0.0125Ni 0.0101Sn 0.0021Pb 0.0011Ca 0.0015Cd 0.0003Na 0.0009V 0.0027Al 98.882.2 Preparation of Rice Husk AshThe procedure adopted is <strong>in</strong> accordance withAlaneme et al [16]. It <strong>in</strong>volves the use of a simplemetallic drum with perforations as burner forthe rice husk. Dry rice husks placed <strong>in</strong>side thedrum was ignited with the use of charcoal. Thehusk was allowed to burn completely and theashes removed 24 hours later. The ash was thenheat‐treated at a temperature of 650 o C for 180m<strong>in</strong>utes to reduce its carbonaceous and volatileconstituents. Siev<strong>in</strong>g of the bamboo leaf ash wasthen performed us<strong>in</strong>g a sieve shaker to obta<strong>in</strong>ashes with mesh size under 50 µm. The chemicalcomposition of the rice husk ash from thisprocess is presented <strong>in</strong> Table 2.164
K.K. Alaneme and T.M. Adewale, Tribology <strong>in</strong> Industry Vol. 35, No. 2 (2013) 163‐172Table 2. Chemical Composition of the Rice Husk Ash.Compound/Element (constituent) wt%Silica (SiO2) 91.59Carbon, C 4.8Calcium oxide CaO 1.58Magnesium oxide, MgO 0.53Potassium oxide, K2O 0.39Haematite, Fe2O3 0.21Sodium, NatraceTitanium oxide, TiO2 0.202.3 Composites ProductionTwo step stir cast<strong>in</strong>g process was utilized toproduce the composites [20]. The process startedwith the determ<strong>in</strong>ation of the quantities of ricehusk ash (RHA) and silicon carbide (SiC) requiredto produce 5, 7.5, and 10 wt% re<strong>in</strong>forcementconsist<strong>in</strong>g of RHA and SiC <strong>in</strong> weight ratios 0:1, 1:3,1:1, 3:1, and 1:0 respectively (which amounts to 0,25, 50, 75, and 100 % RHA <strong>in</strong> the re<strong>in</strong>forcementphase). The rice husk ash and silicon carbideparticles were <strong>in</strong>itially preheated separately at atemperature of 250 o C to elim<strong>in</strong>ate dampness andimprove wettability with the molten Al‐Mg‐Sialloy. The Al‐Mg‐Si alloy billets were charged <strong>in</strong>to agas‐fired crucible furnace (fitted with atemperature probe), and heated to a temperatureof 750 o C ± 30 o C (above the liquidus temperatureof the alloy) to ensure the alloy melts completely.The liquid alloy was then cooled <strong>in</strong> the furnace to asemi solid state at a temperature of about 600 o C.Table 3. Composite Density and Estimated Percent Porosity.SampleDesignationCompositionRHA: SiCTheoreticaldensity(g/cm 3 )Experimentaldensity (g/cm 3 )%PorosityA0 0 wt% 2.700 2.655 1.675wt%B1 A (0:1) 2.721 2.700 0.77B2 B (1:3) 2.691 2.650 1.52B3 C (1:1) 2.660 2.640 0.75B4 D (3:1) 2.630 2.590 1.52B5 E (1:0) 2.599 2.579 0.777.5 wt%C1 A (0:1) 2.733 2.670 2.31C2 B (1:3) 2.689 2.640 1.82C3 C (1:1) 2.640 2.590 1.89C4 D (3:1) 2.595 2.570 0.96C5 E (1:0) 2.550 2.510 1.5710 wt%D1 A (0:1) 2.743 2.690 1.9D2 B (1:3) 2.680 2.650 1.11D3 C (1:1) 2.620 2.610 0.3D4 D (3:1) 2.560 2.50 2.34D5 E (1:0) 2.500 2.497 0.12The preheated rice husk ash and SiC particlesalong with 0.1 wt% magnesium were then charged<strong>in</strong>to the semi‐solid melt at this temperature (600oC) and stirr<strong>in</strong>g of the slurry was performedmanually for 5‐10 m<strong>in</strong>utes. The composite slurrywas then superheated to 800 o C± 50 o C and asecond stirr<strong>in</strong>g performed us<strong>in</strong>g a mechanicalstirrer. The stirr<strong>in</strong>g operation was performed at aspeed of 400 rpm for 10 m<strong>in</strong>utes before cast<strong>in</strong>g<strong>in</strong>to prepared sand moulds <strong>in</strong>serted with chills.The designations used to represent each grade ofthe composites produced are presented <strong>in</strong> Table 3.2.4 Density MeasurementThe experimental density of each grade ofcomposite produced was determ<strong>in</strong>ed by divid<strong>in</strong>gthe measured weight of a test sample by itsmeasured volume; while the theoretical densitywas evaluated by us<strong>in</strong>g the formula:ρ Al‐Mg‐Si / RHA‐SiCp = wt. Al‐Mg‐Si × ρ Al‐Mg‐Si + wt. RHA × ρ RHA +wt. SiC × ρ SiC (2.1)where, ρ Al‐Mg‐Si / RHA‐SiCp = Density of Composite,wt. Al‐Mg‐Si = Weight fraction of Al‐Mg‐Si alloy, ρ Al‐Mg‐Si = Density of Al‐Mg‐Si alloy, wt. RHA = Weightfraction RHA, ρ RHA = Density of RHA, wt. SiC =Weight fraction SiC, and ρ SiC = Density of SiC.The experimental densities were compared withthe theoretical densities for each composition ofthe RHA‐SiC re<strong>in</strong>forced composites produced; andit served as basis for evaluation of the percentporosity of the composites us<strong>in</strong>g the relations [20]:% porosity = {(ρ T – ρ EX ) ÷ ρ T } × 100 % (2.2)where, ρ T = Theoretical Density (g/cm 3 ), ρ EX =Experimental Density (g/cm 3 ).2.5 Tensile PropertiesThe tensile properties of the composites wasevaluated with the aid of tensile tests performedfollow<strong>in</strong>g the specifications of ASTM 8M‐91standards [21]. The samples for the test weremach<strong>in</strong>ed to round specimen configuration with6 mm diameter and 30 mm gauge length. Thetest was carried out at room temperature us<strong>in</strong>gan Instron universal test<strong>in</strong>g mach<strong>in</strong>e operated ata stra<strong>in</strong> rate of 10 ‐3 /s. Three repeat tests wereperformed for each grade of compositeproduced to guarantee repeatability andreliability of the data generated. The tensileproperties evaluated from the stress‐stra<strong>in</strong>curves developed from the tension test are ‐ theultimate tensile strength (σ u ), the 0.2 % offsetyield strength (σ y ), and the stra<strong>in</strong> to fracture (ε f ).165
K.K. Alaneme and T.M. Adewale, Tribology <strong>in</strong> Industry Vol. 35, No. 2 (2013) 163‐1722.6 Fracture Toughness EvaluationThe fracture toughness of the composites wasevaluated us<strong>in</strong>g circumferential notch tensile(CNT) specimens [22]. Samples for the CNTtest<strong>in</strong>g were mach<strong>in</strong>ed hav<strong>in</strong>g gauge length,specimen diameter (D), notch diameter (d),and notch angle of 30, 6, 4.5 mm, and 60 o Crespectively. The specimens were thensubjected to tensile load<strong>in</strong>g to fracture us<strong>in</strong>gan Instron universal test<strong>in</strong>g mach<strong>in</strong>e. Thefracture load (P f ) obta<strong>in</strong>ed from the load –extension plots generated from the CNTtest<strong>in</strong>g were used to evaluate the fracturetoughness us<strong>in</strong>g the empirical relations byDieter [23]:K 1C =P f /(D) 3/2 [1.72(D/d)–1.27] (2.3)where, D and d are respectively the specimendiameter and the diameter of the notchedsection. The validity of the fracture toughnessvalues obta<strong>in</strong>ed was determ<strong>in</strong>ed us<strong>in</strong>g therelations <strong>in</strong> accordance with Nath and Das[24]:D ≥ (K 1C /σ y ) 2 (2.4)Three repeat tests were performed for eachcomposite composition and the resultsobta<strong>in</strong>ed were taken to be highly consistent ifthe difference between measured values for agiven composite composition is not more than2 %.which often occurs dur<strong>in</strong>g solidification ofMMCs hav<strong>in</strong>g components with differentdensities and wettability characteristics [25].This shows that the two step stir cast<strong>in</strong>gprocess adopted for the production of thecomposites is reliable judg<strong>in</strong>g from themicrostructures exam<strong>in</strong>ed <strong>in</strong> Fig. 1.(a)2.7 Microstructural Exam<strong>in</strong>ationA JSM 7600F Jeol ultra‐high resolution fieldemission gun scann<strong>in</strong>g electron microscope(FEG‐SEM) equipped with an EDS was used fordetailed microstructural study and fordeterm<strong>in</strong>ation of the elemental compositions ofthe composites.(b)3. RESULTS AND DISCUSSION3.1 MicrostructureFigure 1 shows some representative SEMmicrographs of the RHA ‐ SiC re<strong>in</strong>forced AMCsproduced. It is observed that there is a gooddispersion of the RHA and SiC particulates <strong>in</strong>the Al alloy matrix and little particle clustersare observed. Thus there is no significantproblem of segregation or sedimentation(c)166
K.K. Alaneme and T.M. Adewale, Tribology <strong>in</strong> Industry Vol. 35, No. 2 (2013) 163‐172(d)(b)Fig. 2. (a) Representative SE Photomicrographshow<strong>in</strong>g the re<strong>in</strong>forc<strong>in</strong>g particles dispersed <strong>in</strong> the Al‐Mg‐Si matrix; (b) EDS profile of the particle <strong>in</strong> 2(a)confirm<strong>in</strong>g the presence of Al 2 O 3 , SiO 2 , Fe 2 O 3 , K 2 O,CaO, SiC and Na.(e)Fig. 1. (a) SE image of the Al‐Mg‐Si/5 wt% SiCcomposite show<strong>in</strong>g the SiC particles dispersed <strong>in</strong> theAl‐Mg‐Si matrix; (b) SE image of the 5 wt% hybridre<strong>in</strong>forced Al‐Mg‐Si/RHA‐SiC composite hav<strong>in</strong>g RHA:SiC weight ratio of 1:3; (c) SE image of the 7.5 wt%hybrid re<strong>in</strong>forced Al‐Mg‐Si/RHA‐SiC composite hav<strong>in</strong>gRHA: SiC weight ratio of 1:3; (d) SE image of the 10wt% hybrid re<strong>in</strong>forced Al‐Mg‐Si/RHA‐SiC compositehav<strong>in</strong>g RHA: SiC weight ratio of 1:3; (e) SE image of theAl‐Mg‐Si/10 wt% RHA composite show<strong>in</strong>g the RHAparticles dispersed <strong>in</strong> the Al‐Mg‐Si matrix.(a)(a)(b)Fig. 3. (a) Representative SE Photomicrograph ofsome clustered particles dispersed <strong>in</strong> the Al‐Mg‐Simatrix; (b) EDS profile the particles identified <strong>in</strong> 3(a)confirm<strong>in</strong>g the presence of Al 2 O 3 , SiO 2 , Fe 2 O 3 , SiC, Cao,and Na which are constituents from the RHA‐SiChybrid re<strong>in</strong>forcement.The EDS profiles of the particulates <strong>in</strong> thecomposites produced, some of which arepresented <strong>in</strong> Figs. 2 and 3, show peaks ofalum<strong>in</strong>ium (Al), oxygen (O), carbon (C), iron(Fe), silicon (Si), calcium (Ca), sodium (Na) andmagnesium (Mg). The presence of theseelements confirm the presence of SiC; as well as167
K.K. Alaneme and T.M. Adewale, Tribology <strong>in</strong> Industry Vol. 35, No. 2 (2013) 163‐172silica (SiO 2 ), alum<strong>in</strong>a (Al 2 O 3 ), Potassium oxide(K 2 O), ferric oxide (Fe 2 O 3 ), and Magnesium oxide(MgO) which are constituents derived from therice husk ash (Table 2).18.3 % was observed <strong>in</strong> comparison to the 10 wt% SiC s<strong>in</strong>gle re<strong>in</strong>forced Al matrix composite.3.2 Composite Density and Estimated PercentPorosityThe results of the composite densities andestimated percent porosity are presented <strong>in</strong>Table 3. It is observed from the results that theestimated porosity values are not dependent onthe weight percent of the re<strong>in</strong>forcement phaseor the weight ratio of RHA to SiC. It is howevernoted that the estimated porosity levels are lessthan 4 % which has been reported to be themaximum permissible <strong>in</strong> cast AMCs [26]. Thelow porosity levels of the composites supportsour submission that the two step stir cast<strong>in</strong>gmethod adopted for produc<strong>in</strong>g the composites isreliable. As a result of the lower density of RHA(0.31 g/cm 3 ) <strong>in</strong> comparison to SiC (3.6 g/cm 3 ), itis expected that the density of the compositeswill reduce with <strong>in</strong>crease <strong>in</strong> the RHA content <strong>in</strong>the composite as observed from Table 3.(a)3.3 Mechanical BehaviourThe variation of tensile strength and yieldstrength of the composites produced ispresented <strong>in</strong> Figure 4. It is observed that there isa general <strong>in</strong>crease <strong>in</strong> tensile strength (Fig. 4a)and yield strength (Fig. 4b) with <strong>in</strong>crease <strong>in</strong>weight percent of the RHA‐SiC hybridre<strong>in</strong>forcement. However, for specific weightpercents of the hybrid composites (that is B, C,and D series), it is noted that the tensile andyield strength decreases with <strong>in</strong>crease <strong>in</strong> theweight proportion of RHA <strong>in</strong> the RHA‐SiCre<strong>in</strong>forcement. For the composites conta<strong>in</strong><strong>in</strong>g 5wt% of the re<strong>in</strong>forc<strong>in</strong>g phase, it is observed that4.9, 8.9, 12.5, and 15.8 % reduction <strong>in</strong> tensilestrength was obta<strong>in</strong>ed from the composites withweight ratio RHA: SiC of 1:3, 1:1, 3:1, and 1:0(that is conta<strong>in</strong><strong>in</strong>g 25, 50, 75, and 100 % RHA) <strong>in</strong>comparison to the 5 wt% SiC s<strong>in</strong>gle re<strong>in</strong>forced Almatrix composite. For the composites conta<strong>in</strong><strong>in</strong>g7.5 wt% of the re<strong>in</strong>forc<strong>in</strong>g phase, reductions of5, 9, 13.4, and 19 % were observed for thecompositions of 1:3, 1:1, 3:1, 1:0 RHA: SiCweight ratios respectively (<strong>in</strong> comparison withthe 7.5 wt% SiC s<strong>in</strong>gle re<strong>in</strong>forced composite). Inthe case of the composites conta<strong>in</strong><strong>in</strong>g 10 wt%re<strong>in</strong>forcements, reductions of 4, 8.1, 13.2, and(b)Fig. 4. (a) Variation of tensile strength for themonolithic Al‐Mg‐Si alloy, s<strong>in</strong>gle re<strong>in</strong>forced andhybrid re<strong>in</strong>forced Al‐Mg‐Si/RHA‐SiC composites; (b)variation of yield strength for the monolithic Al‐Mg‐Sialloy, s<strong>in</strong>gle re<strong>in</strong>forced and hybrid re<strong>in</strong>forced Al‐Mg‐Si/RHA‐SiC composites.It has been well reported that particlere<strong>in</strong>forced AMCs achieve improved strength dueto load transfer from the matrix to the particles(direct strengthen<strong>in</strong>g) and creation of moredislocations which serve as constra<strong>in</strong>ts to plasticdeformation by thermal mismatch between theparticles and the Alum<strong>in</strong>ium matrix aris<strong>in</strong>g fromtheir differences <strong>in</strong> coefficient of thermalexpansion (<strong>in</strong>direct strengthen<strong>in</strong>g) [27‐28].Thus even <strong>in</strong> a scenario where the particles arenot sufficiently strong to <strong>in</strong>duce strengthen<strong>in</strong>gvia the ‘direct route’ of load transfer from matrixto particles, the <strong>in</strong>direct strengthen<strong>in</strong>g it couldoffer is adequate to <strong>in</strong>duce some strengthimprovements well and above that of themonolithic alloy. In the present case under<strong>in</strong>vestigation, the reduction <strong>in</strong> strength observedwith <strong>in</strong>crease <strong>in</strong> the RHA content of the168
K.K. Alaneme and T.M. Adewale, Tribology <strong>in</strong> Industry Vol. 35, No. 2 (2013) 163‐172composites is as a result of the decrease of thedirect strengthen<strong>in</strong>g capacity of RHA whichconta<strong>in</strong>s predom<strong>in</strong>antly silica. Silica is noted tobe a softer ceramic with elastic modulus of 60‐70 GPa, which is with<strong>in</strong> the range of Alum<strong>in</strong>iumunlike SiC which has an elastic modulus of400GPa. Thus the efficiency of load transfer fromthe Al matrix to the particles (load carry<strong>in</strong>gcapacity) of the hybrid particulates will bedependent on the amount of SiC than RHA.However, it should be noted that samples B5, C5,and D5 which conta<strong>in</strong> only RHA, show aprogressive <strong>in</strong>crease <strong>in</strong> tensile strength andyield strength with the <strong>in</strong>creased weight percentof RHA support<strong>in</strong>g our hypothesis that the<strong>in</strong>direct strengthen<strong>in</strong>g mechanism (whichentails dislocation generation results <strong>in</strong> higherdislocation densities with <strong>in</strong>creased weightpercent of the particles) can result <strong>in</strong> modestimprovement <strong>in</strong> strength with <strong>in</strong>crease <strong>in</strong> theweight percent of the re<strong>in</strong>forc<strong>in</strong>g particles.The variation of the specific strength of thecomposites produced with weight ratio ofRHA/SiC is presented <strong>in</strong> Fig. 5. It is observedthat the specific strengths of the compositesgenerally <strong>in</strong>creased with <strong>in</strong>crease <strong>in</strong> the weightpercent of the re<strong>in</strong>forc<strong>in</strong>g phase (that is RHA‐SiCweight percent). Also the specific strengthvalues decreases with <strong>in</strong>crease <strong>in</strong> the RHAcontent <strong>in</strong> the hybrid re<strong>in</strong>forcement.the 7.5 wt % compositions (grades) 3.93, 6.2, 10and 13.9 % reductions were obta<strong>in</strong>ed. In thecase of the 10 wt% grade, 2.6, 5.3, 6.54, and 11.9% reductions were obta<strong>in</strong>ed. The results showthat the composites with composition of 1:3weight ratio RHA: SiC (25 % RHA: 75 % SiC) canoffer comparable specific strength values atreduced cost of production of the composites<strong>in</strong>ce its difference is less than 4 % for the threeweight percents of re<strong>in</strong>forcement worked on.The results of the variation of stra<strong>in</strong> to fractureof the composites with weight percentre<strong>in</strong>forcement and weight ratio RHA/SiC ispresented <strong>in</strong> Fig. 6. It is observed that there is ageneral decrease <strong>in</strong> ductility of the compositeswith <strong>in</strong>crease <strong>in</strong> the weight percent ofre<strong>in</strong>forc<strong>in</strong>g phase <strong>in</strong> the composites. Closerobservation show that for each weight percentof hybrid composites produced, the stra<strong>in</strong> tofracture was <strong>in</strong>variant to the weight ratio ofRHA/SiC. It can be <strong>in</strong>ferred from the results thatthe ductility levels of the hybrid composites isnot compromised by the addition of RHA <strong>in</strong> thehybrid compositions. Thus its capacity to susta<strong>in</strong>plastic stra<strong>in</strong> without fracture is not impelled bythe addition of RHA.Fig. 6. Variation of stra<strong>in</strong> to fracture for themonolithic Al‐Mg‐Si alloy, s<strong>in</strong>gle re<strong>in</strong>forced andhybrid re<strong>in</strong>forced Al‐Mg‐Si/RHA‐SiC composites.Fig. 5. Variation of specific strength for themonolithic Al‐Mg‐Si alloy, s<strong>in</strong>gle re<strong>in</strong>forced andhybrid re<strong>in</strong>forced Al‐Mg‐Si/RHA‐SiC composites.However, the % decrease <strong>in</strong> specific strength ofthe composites is generally lower <strong>in</strong> comparisonwith that of the ultimate tensile strengthanalyzed earlier. For the 5 wt% compositions, itis observed that 3.1, 6.8, 8.75, and 11.9 %reduction <strong>in</strong> specific strength is obta<strong>in</strong>ed. ForThe fracture toughness values determ<strong>in</strong>ed bythe use of circumferential notched tensile (CNT)specimens are presented <strong>in</strong> Fig. 7. The valuesobta<strong>in</strong>ed were reported as pla<strong>in</strong> stra<strong>in</strong> fracturetoughness because the conditions for valid K 1C(pla<strong>in</strong> stra<strong>in</strong> condition) was met with thespecimen diameter of 6mm when the relation D≥ (K 1C /σ y ) 2 [24] was utilised to validate theresults obta<strong>in</strong>ed from the CNT test<strong>in</strong>g. It isobserved that the fracture toughness decreases169
K.K. Alaneme and T.M. Adewale, Tribology <strong>in</strong> Industry Vol. 35, No. 2 (2013) 163‐172with <strong>in</strong>crease <strong>in</strong> the weight percent of thecomposites. But for specific weight percents ofthe composites (that is B, C, and D series) it isobserved that the composite compositionsconta<strong>in</strong><strong>in</strong>g RHA had improved fracturetoughness results compared with the s<strong>in</strong>gle SiCre<strong>in</strong>forced grades of the composites. Thus theaddition of RHA appears to be beneficial <strong>in</strong>terms of improv<strong>in</strong>g the resistance to crackpropagation of the composites mak<strong>in</strong>g themslightly less susceptible to sudden crack failure<strong>in</strong> comparison with the s<strong>in</strong>gle re<strong>in</strong>forced SiCcomposite grades. The mechanism of fracture <strong>in</strong>particle re<strong>in</strong>forced Al matrix composites havebeen reported by several authors [29‐30]. Theprimary mechanisms of fracture have beenreported to be facilitated by one or acomb<strong>in</strong>ation of particle crack<strong>in</strong>g, <strong>in</strong>terfacialcrack<strong>in</strong>g or particle debond<strong>in</strong>g [31]. In thepresent case, the improved fracture toughness ofthe composites conta<strong>in</strong><strong>in</strong>g RHA, is most likelydue to the reduced amount of relatively harderand brittle SiC particles <strong>in</strong> the composites [19].The SiC particles like most hard and brittleceramic particles have a higher tendency toundergo rapid crack propagation [32].RHA to SiC. They were however less than2.5 % <strong>in</strong> all grades produced.2. There is a general <strong>in</strong>crease <strong>in</strong> tensilestrength, and yield strength with <strong>in</strong>crease <strong>in</strong>weight percent of the RHA‐SiC hybridre<strong>in</strong>forcement. However, the tensile andyield strength decreases with <strong>in</strong>crease <strong>in</strong>the weight proportion of RHA <strong>in</strong> the RHA‐SiC re<strong>in</strong>forcement.3. The specific strength followed the sametrend as the tensile and yield strengths;however, the % decrease <strong>in</strong> specificstrength of the composites is generallylower <strong>in</strong> comparison with that of theultimate tensile strength. The compositeswith composition of 1:3 weight ratio RHA toSiC (25% RHA: 75% SiC) offers comparablespecific strength values with the SiC s<strong>in</strong>glere<strong>in</strong>forced grades of the composite.4. There is a general decrease <strong>in</strong> ductility of thecomposites with <strong>in</strong>crease <strong>in</strong> the weightpercent of re<strong>in</strong>forc<strong>in</strong>g phase <strong>in</strong> thecomposites. However, the stra<strong>in</strong> to fracturewas <strong>in</strong>variant to the weight ratio of RHA/SiC.5. The fracture toughness decreases with<strong>in</strong>crease <strong>in</strong> the weight percent of thecomposites. But the compositecompositions conta<strong>in</strong><strong>in</strong>g RHA had improvedfracture toughness compared with thes<strong>in</strong>gle SiC re<strong>in</strong>forced grades.AcknowledgementFig. 7. Variation of Fracture Toughness for themonolithic Al‐Mg‐Si alloy, s<strong>in</strong>gle re<strong>in</strong>forced andhybrid re<strong>in</strong>forced Al‐Mg‐Si/RHA‐SiC composites.4. CONCLUSIONSThe mechanical behaviour of Al‐Mg‐Si alloy matrixcomposites conta<strong>in</strong><strong>in</strong>g 5, 7.5, and 10 weight percentof RHA and SiC re<strong>in</strong>forcements prepared <strong>in</strong> weightratios 0:1, 1:3, 1:1, 3:1, and 1:0 respectively was<strong>in</strong>vestigated. The results show that:1. The estimated porosity values are notdependent on the weight percent of there<strong>in</strong>forcement phase or the weight ratio ofThe electron microscopy assistance rendered byDr. P. A. Olubambi of the Department ofChemical and Metallurgical Eng<strong>in</strong>eer<strong>in</strong>g,Tshwane University of Technology, South Africais appreciated.REFERENCES[1] S.D. Prasad, R.A. Krishna: Production andMechanical Properties of A356.2 /RHA Composites,International Journal of Advanced Science andTechnology, Vol. 33, pp. 51‐58, 2011.[2] H. Zuhailawati, P. Samayamutthirian, C.H. MohdHaizu: Fabrication of Low Cost Alum<strong>in</strong>ium MatrixComposite Re<strong>in</strong>forced with Silica Sand, Journal ofPhysical Science, Vol. 18, No. 1, pp. 47‐55, 2007.[3] T.V. Christy, N. Murugan, S. Kumar: Acomparative study on the microstructures andmechanical properties of Al 6061 alloy and the170
K.K. Alaneme and T.M. Adewale, Tribology <strong>in</strong> Industry Vol. 35, No. 2 (2013) 163‐172MMC Al 6061/TiB2/12p, Journal of M<strong>in</strong>erals andMaterials Characterization and Eng<strong>in</strong>eer<strong>in</strong>g, Vol.9, No. 1, pp. 57‐65, 2010.[4] P.K. Rohatgi, B.F. Schultz, A. Daoud, W.W.Zhang: Tribological performance of A206alum<strong>in</strong>um alloy conta<strong>in</strong><strong>in</strong>g silica sand particles,Tribol. Int, Vol. 43, No. 1‐2, pp. 455–466, 2010.[5] K.K. Alaneme, M. O. Bodunr<strong>in</strong>: Corrosionbehaviour of alum<strong>in</strong>a re<strong>in</strong>forced Al (6063) metalmatrix composites, Journal of M<strong>in</strong>erals andMaterials Characterisation and Eng<strong>in</strong>eer<strong>in</strong>g, Vol.10, No. 2, pp. 1153‐1165, 2011.[6] P. Rohatgi, B. Schultz: Light weight metal matrixcomposites – stretch<strong>in</strong>g the boundaries of metals,Materials Matters, Vol. 2, pp. 16‐19, 2007.[7] D.B. Miracle: Metal matrix composites ‐ fromscience to technological significance, CompositesScience and Technology, Vol. 65, No. 15/16, pp.2526‐2540, 2005.[8] K.K. Alaneme: Influence of Thermo‐mechanicalTreatment on the Tensile Behaviour and CNTevaluated Fracture Toughness of Borax premixedSiCp re<strong>in</strong>forced Alum<strong>in</strong>ium (6063) Composites,International Journal of Mechanical and MaterialsEng<strong>in</strong>eer<strong>in</strong>g, Vol. 7, No. 1, pp. 96‐100, 2012.[9] T. Senthilvelan, S. Gopalakannan, S.Vishnuvarthan, K. Keerthivaran: Fabrication andCharacterization of SiC, Al 2 O 3 and B 4 C Re<strong>in</strong>forcedAl‐Zn‐Mg‐Cu Alloy (AA 7075) Metal MatrixComposites: A Study, Advanced MaterialsResearch, Vol. 622‐623, pp. 1295‐1299, 2012.[10] S.A. Sajjadi, H.R. Ezatpour, H. Beygi:Microstructure and mechanical properties of Al–Al 2 O 3 micro and nano composites fabricated bystir cast<strong>in</strong>g, Materials Science and Eng<strong>in</strong>eer<strong>in</strong>g A,Vol. 528, pp. 8765‐8771, 2011.[11] S. Tahamtan, A. Halvaee, M. Emamy, M.S Zabihi:Fabrication of Al/A206‐Al 2 O 3 nano/microcomposite by comb<strong>in</strong><strong>in</strong>g ball mill<strong>in</strong>g and stircast<strong>in</strong>g technology, Materials and Design, Vol. 49,pp. 347‐359, 2013.[12] P. Naresh: Development and characterization ofmetal matrix composite us<strong>in</strong>g red Mud an<strong>in</strong>dustrial waste for wear resistant applications,PhD Thesis, Department of MechanicalEng<strong>in</strong>eer<strong>in</strong>g, National Institute of TechnologyRourkela, India, 23 – 34, 2006.[13] J. Bienia, M. Walczak, B. Surowska B, J. Sobczaka:Microstructure and corrosion behaviour ofalum<strong>in</strong>ium fly ash composites, Journal ofOptoelectronics and Advanced Materials, Vol. 5,No. 2, pp. 493‐502, 2003.[14] P.B. Madakson, D.S. Yawas, A. Apasi:Characterization of Coconut Shell Ash forPotential Utilization <strong>in</strong> Metal Matrix Compositesfor Automotive Applications, InternationalJournal of Eng<strong>in</strong>eer<strong>in</strong>g Science and Technology(IJEST), Vol. 4, No. 3, pp. 1190‐1198, 2012.[15] S.D. Prasad, R.A. Krishna: Tribological Propertiesof A356.2/RHA Composites, Journal of MaterialsScience and Technology, Vol. 28, No. 4, pp. 367‐372, 2012.[16] K.K. Alaneme, I.B. Ak<strong>in</strong>tunde, P.A. Olubambi, T.M.Adewale: Mechanical Behaviour of Rice Husk Ash– Alum<strong>in</strong>a Hybrid Re<strong>in</strong>forced Alum<strong>in</strong>ium BasedMatrix Composites, Journal of Materials Researchand Technology, Vol. 2, No. 1, pp. 60‐67, 2013.[17] R. Escalera‐Lozano, C. Gutierrez, M.A. Pech‐Canul, M.I. Pech‐Canul: Degradation of Al/SiCpComposites produced with Rice‐Hull Ash andAlum<strong>in</strong>ium Cans, Waste Management, Vol. 28, pp.389‐395, 2008.[18] K.K. Alaneme, P.A. Olubambi: Corrosion and WearBehaviour of Rice Husk Ash – Alum<strong>in</strong>a Re<strong>in</strong>forcedAlum<strong>in</strong>ium Matrix Hybrid Composites, Journal ofMaterials Research and Technology, (2013) (InPress).[19] K.K. Alaneme, E.O. Adewuyi: MechanicalBehaviour of Bamboo Leaf Ash – Alum<strong>in</strong>a HybridRe<strong>in</strong>forced Alum<strong>in</strong>ium Based Matrix Composites,Metallurgical and Materials Eng<strong>in</strong>eer<strong>in</strong>g, Serbia(2013) (In Press).[20] K.K. Alaneme, A.O. Aluko: Production and ageharden<strong>in</strong>gbehaviour of borax pre‐mixed SiCre<strong>in</strong>forced Al‐Mg‐Si alloy composites developed bydouble stir cast<strong>in</strong>g technique, The West IndianJournal of Eng<strong>in</strong>eer<strong>in</strong>g, Vol. 34, No. 1/2, pp. 80‐85, 2012.[21] ASTM E 8M: Standard Test Method for TensionTest<strong>in</strong>g of Metallic Materials (Metric), AnnualBook of ASTM Standards, Philadelphia, 1991.[22] K.K. Alaneme: Fracture toughness (K 1C )evaluation for dual phase low alloy steels us<strong>in</strong>gcircumferential notched tensile (CNT) specimens,Materials Research, Vol. 14, No. 2, pp. 155‐160,2011.[23] G.E. Dieter: Mechanical Metallurgy, McGraw‐ Hill,S<strong>in</strong>gapore, 1988.[24] S.K. Nath, U.K. Das: Effect of microstructure andnotches on the fracture toughness of mediumcarbon steel, Journal of Naval Architecture andMar<strong>in</strong>e Eng<strong>in</strong>eer<strong>in</strong>g, Vol. 3, pp. 15‐22, 2006.[25] B.F. Schultz, J.B. Ferguson, P.K. Rohatgi:Microstructure and hardness of Al 2 O 3 nanoparticlere<strong>in</strong>forced Al–Mg composites fabricated byreactive wett<strong>in</strong>g and stir mix<strong>in</strong>g, MaterialsScience and Eng<strong>in</strong>eer<strong>in</strong>g A, Vol. 530, pp. 87‐97,2011.171
K.K. Alaneme and T.M. Adewale, Tribology <strong>in</strong> Industry Vol. 35, No. 2 (2013) 163‐172[26] M. Kok: Production and mechanical properties ofAl 2 O 3 particle re<strong>in</strong>forced 2024 alum<strong>in</strong>iumcomposites, Journal of Materials Process<strong>in</strong>gTechnology, Vol. 16, pp. 381‐387, 2005.[27] K.K. Alaneme KK, A.O. Aluko: Fracture Toughness(K1C) and Tensile Properties of As‐Cast and Age‐Hardened Alum<strong>in</strong>ium (6063) – Silicon CarbideParticulate Composites, Scientia Iranica,Transactions A: Civil Eng<strong>in</strong>eer<strong>in</strong>g (Elsevier), Vol.19, No. 4, pp. 992‐996, 2012.[28] N. Chawla, Y. Shen: Mechanical behaviour ofparticle re<strong>in</strong>forced metal matrix composites,Advanced Eng<strong>in</strong>eer<strong>in</strong>g Materials, Vol. 3, No. 6,pp. 357‐370, 2001.[29] M.T. Milan, P. Bowen: Tensile and fracturetoughness properties of SiCp re<strong>in</strong>forced Al alloys:Effects of particle size, particle volume fractionand matrix strength, Journal of MaterialsEng<strong>in</strong>eer<strong>in</strong>g and Performance, Vol. 13, No. 6, pp.775‐783, 2004.[30] M.M. Ranjbaran: Low fracture toughness <strong>in</strong> Al7191‐20% SiCp alum<strong>in</strong>ium matrix composite,European Journal of Scientific Research, Vol. 41,No. 2, pp. 261‐272, 2010.[31] K.K. Alaneme: Mechanical Behaviour of ColdDeformed and Solution Heat‐treated Alum<strong>in</strong>aRe<strong>in</strong>forced AA 6063 Composites, The West IndianJournal of Eng<strong>in</strong>eer<strong>in</strong>g, Vol. 35, No. 2, pp. 31‐35,2013.[32] Fracture Mechanics of Ceramics, Vol. 13 – Crack‐Microstructure Interaction, R – Curve Behaviour,Editors (Bradt RC, Munz D, Sakai M, SchevchenkoV Ya, White KW, Spr<strong>in</strong>ger, First Edition, 2002;538 pp.172
<strong>tribology</strong> <strong>in</strong> <strong>in</strong>dustryISSN 0354-8996VOLUME 332011.3
<strong>tribology</strong> <strong>in</strong> <strong>in</strong>dustryISSN 0354-8996VOLUME 332011.3
Tribology <strong>in</strong> IndustryJournal of the Serbian Tribology Society
www.<strong>tribology</strong>.f<strong>in</strong>k.rs