Moisture Content Measurement of Bark and Sphagnum Moss Using ...
Moisture Content Measurement of Bark and Sphagnum Moss Using ... Moisture Content Measurement of Bark and Sphagnum Moss Using ...
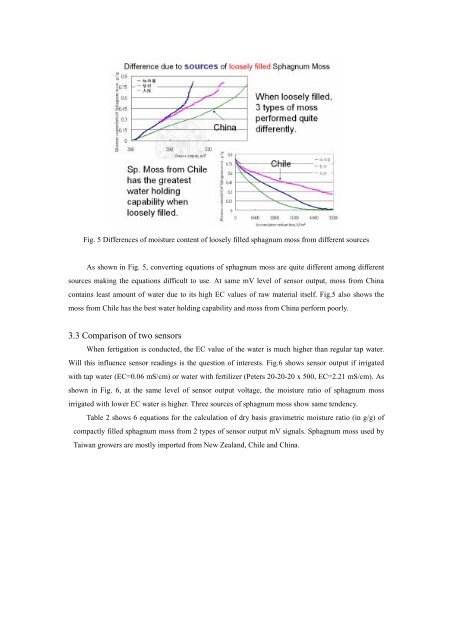
Fig. 5 Differences of moisture content of loosely filled sphagnum moss from different sourcesAs shown in Fig. 5, converting equations of sphagnum moss are quite different among differentsources making the equations difficult to use. At same mV level of sensor output, moss from Chinacontains least amount of water due to its high EC values of raw material itself. Fig.5 also shows themoss from Chile has the best water holding capability and moss from China perform poorly.3.3 Comparison of two sensorsWhen fertigation is conducted, the EC value of the water is much higher than regular tap water.Will this influence sensor readings is the question of interests. Fig.6 shows sensor output if irrigatedwith tap water (EC=0.06 mS/cm) or water with fertilizer (Peters 20-20-20 x 500, EC=2.21 mS/cm). Asshown in Fig. 6, at the same level of sensor output voltage, the moisture ratio of sphagnum mossirrigated with lower EC water is higher. Three sources of sphagnum moss show same tendency.Table 2 shows 6 equations for the calculation of dry basis gravimetric moisture ratio (in g/g) ofcompactly filled sphagnum moss from 2 types of sensor output mV signals. Sphagnum moss used byTaiwan growers are mostly imported from New Zealand, Chile and China.
Fig. 6 Effects of EC values of irrigating water on the ECH 2 O-10 moisture sensor outputTable 2 Equations derived for dry basis moisture ratio of compactly filled sphagnum mossSource of Sphagnum moss Type of sensor Equations R 2New Zealand ECH2O-10 Y = 0.024 X – 6.4422 0.9292Chile ECH2O-10 Y = 0.0248 X – 6.4717 0.9618China ECH2O-10 Y = 0.018 X – 4.2573 0.8037New Zealand ECH2O-5 Y = 0.0299 X – 6.2301 0.9331Chile ECH2O-5 Y = 0.0257 X – 5.7949 0.9083China ECH2O-5 Y = 0.024 X – 4.6515 0.9312Note: Y in g/g and X in mVFig. 7 ECH 2 O-5 moisture sensor is suitable for measuring water content with wide range of EC values3.4 Converting from volumetric moisture ratio to gravimetric moisture ratioEquations derived mentioned above are good for converting sensor output voltage (in mV) to
- Page 1 and 2: Moisture Content Measurement of Bar
- Page 3 and 4: 2.3 MaterialsFig. 2 Experimental se
- Page 5: sphagnum moss need to be defined be
- Page 9: Fig. 8.User interface of the softwa
Fig. 5 Differences <strong>of</strong> moisture content <strong>of</strong> loosely filled sphagnum moss from different sourcesAs shown in Fig. 5, converting equations <strong>of</strong> sphagnum moss are quite different among differentsources making the equations difficult to use. At same mV level <strong>of</strong> sensor output, moss from Chinacontains least amount <strong>of</strong> water due to its high EC values <strong>of</strong> raw material itself. Fig.5 also shows themoss from Chile has the best water holding capability <strong>and</strong> moss from China perform poorly.3.3 Comparison <strong>of</strong> two sensorsWhen fertigation is conducted, the EC value <strong>of</strong> the water is much higher than regular tap water.Will this influence sensor readings is the question <strong>of</strong> interests. Fig.6 shows sensor output if irrigatedwith tap water (EC=0.06 mS/cm) or water with fertilizer (Peters 20-20-20 x 500, EC=2.21 mS/cm). Asshown in Fig. 6, at the same level <strong>of</strong> sensor output voltage, the moisture ratio <strong>of</strong> sphagnum mossirrigated with lower EC water is higher. Three sources <strong>of</strong> sphagnum moss show same tendency.Table 2 shows 6 equations for the calculation <strong>of</strong> dry basis gravimetric moisture ratio (in g/g) <strong>of</strong>compactly filled sphagnum moss from 2 types <strong>of</strong> sensor output mV signals. <strong>Sphagnum</strong> moss used byTaiwan growers are mostly imported from New Zeal<strong>and</strong>, Chile <strong>and</strong> China.


