Smart Grids Roadmap - Smart Grid Sherpa
Smart Grids Roadmap - Smart Grid Sherpa
Smart Grids Roadmap - Smart Grid Sherpa
- No tags were found...

You also want an ePaper? Increase the reach of your titles
YUMPU automatically turns print PDFs into web optimized ePapers that Google loves.
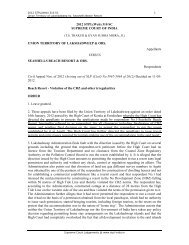
Figure 13. Regional CO 2emissions reduction from smart grid deploymentEconomies in transition0.400.300.400.20Gt CO per year20.10OECD North Amercia0.400.002015 2030 20500.30China0.300.200.20Middle East2015 2030 2050OECD Europe0.400.300.20Gt CO per year2Gt CO per year0.1020.000.40OECD Pacific0.100.302015 2030 20500.200.10Gt CO per year20.002015 2030 20500.000.10Gt CO per year2India0.400.400.300.000.302015 2030 2050Gt CO per yearDirect reductions: energy savings from peak load management,continuous commissioning of service sector loads, accelerateddeployment of energy efficiency programmes, reduced line lossesand direct feedback on energy usage28 Technology <strong>Roadmap</strong>s <strong>Smart</strong> grids0.200.20Gt CO per year220.10Central and South America0.100.000.400.002015 2030 20502015 2030 20500.30AfricaOther developing Asia0.200.400.40Gt CO per year20.100.300.300.000.20Gt CO per year0.20Gt CO per year2015 2030 2050220.100.100.000.002015 2030 20502015 2030 2050Enabled reductions: greater integration of renewablesand facilitation of EV and PHEV deploymentKEY POINT: <strong>Smart</strong> grid deployment enables significant CO 2emissions reductions.© OECD/IEA, 2010