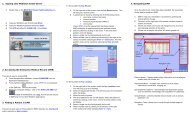
5) Tables - a table shows a group of related items and their measurements. On a table,to view a history, click on the grey box that contains the data item. To view asnapshot, click on the grey box that contains the date and time.6) Viewing Reports, History, and Snapshots - from a panel, reports, text (on EMRViewer screens), history, and snapshot screens can be viewed.a) To view reports, click on the notepad icon or the comment symbol. TheMEDITECH Text Viewer appears.b) A report is the data item's detailed information of a text file sent from a sourceapplication (Microbiology, Pathology, or Imaging Therapeutic Services), whichcontains text descriptions, codes, results, impressions, and findings.i) To view a report from a panel, click on the grey box that contains the date andtime or the notepad icon.ii) EMR starts the MEDITECH Text Viewerc) To view text on an EMR Viewer screen, click on the comment symbol or bluetext. A Viewer screen appears displaying the text (for example, Notes).d) To view a history screen of one data item for an item interval, click on the dataitem. The History screen appears.On a History screen, a data item's values over a time period is viewed. The mostrecent data appears at the top of the table.i) To view a graph of the values in the table, click on the Graph menu option.ii) To view a history screen from a panel, click on the grey box that contains thedata item.iii) If accessing a History screen (that is, click on the comment symbol in the Hxcolumn) from the Imaging or Other Reports panel, an informational messageappears at the top of the History screen. This message indicates that theHistory screen displays a list of the previous versions of the selected report.To view an older version of the report, click on the box that contains the dateand time. To view the current report, click on the comment symbol in theReport column on the Imaging or Other Reports panel.<strong>Health</strong> Informatics<strong>Health</strong> Information Systems and Services© <strong>Fraser</strong> <strong>Health</strong> <strong>Authority</strong>, 2006. All rights reserved.56
e) To view a snapshot screen of a group of data items for a specific time, click onthe date and time. On a Snapshot screen, you view related data items for aspecific date and time. Snapshot data usually appears in table format.i) To view a snapshot screen from a panel, click on the grey box that contains adate and time.ii) On a Laboratory snapshot screen, to view a report associated with thespecimen, click on the table title. MEDITECH Text Viewer displays the report.Also, to view a specimen comment on Laboratory snapshot screens, click onthe comment symbol in the row labelled Specimen Comment. To view theresult comments associated with a data item, click on the comment symbolnext to the data item's value.7) Graphs - a graph shows changes in numeric data over a period of time. A maximumof three data items can be displayed on a graph.a) Viewing Specific Values on Graphsi) To view specific values on a graph, click on the chosen value.<strong>Health</strong> Informatics<strong>Health</strong> Information Systems and Services© <strong>Fraser</strong> <strong>Health</strong> <strong>Authority</strong>, 2006. All rights reserved.57