Forecasting for the Love Boat: Royal Caribbean Cruises in 1998(
Forecasting for the Love Boat: Royal Caribbean Cruises in 1998(
Forecasting for the Love Boat: Royal Caribbean Cruises in 1998(

You also want an ePaper? Increase the reach of your titles
YUMPU automatically turns print PDFs into web optimized ePapers that Google loves.
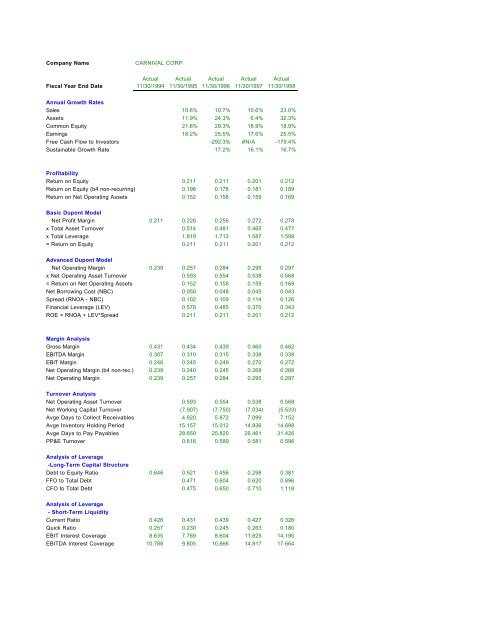
Company NameCARNIVAL CORPActual Actual Actual Actual ActualFiscal Year End Date 11/30/1994 11/30/1995 11/30/1996 11/30/1997 11/30/<strong>1998</strong>Annual Growth RatesSales 10.6% 10.7% 10.6% 23.0%Assets 11.9% 24.3% 6.4% 32.3%Common Equity 21.6% 29.3% 18.9% 18.9%Earn<strong>in</strong>gs 18.2% 25.5% 17.6% 25.5%Free Cash Flow to Investors -292.3% #N/A -179.4%Susta<strong>in</strong>able Growth Rate 17.2% 16.1% 16.7%ProfitabilityReturn on Equity 0.211 0.211 0.201 0.212Return on Equity (b4 non-recurr<strong>in</strong>g) 0.196 0.178 0.181 0.189Return on Net Operat<strong>in</strong>g Assets 0.152 0.158 0.159 0.169Basic Dupont ModelNet Profit Marg<strong>in</strong> 0.211 0.226 0.256 0.272 0.278x Total Asset Turnover 0.514 0.481 0.465 0.477x Total Leverage 1.819 1.713 1.587 1.598= Return on Equity 0.211 0.211 0.201 0.212Advanced Dupont ModelNet Operat<strong>in</strong>g Marg<strong>in</strong> 0.239 0.257 0.284 0.295 0.297x Net Operat<strong>in</strong>g Asset Turnover 0.593 0.554 0.538 0.568= Return on Net Operat<strong>in</strong>g Assets 0.152 0.158 0.159 0.169Net Borrow<strong>in</strong>g Cost (NBC) 0.050 0.048 0.045 0.043Spread (RNOA - NBC) 0.102 0.109 0.114 0.126F<strong>in</strong>ancial Leverage (LEV) 0.578 0.485 0.370 0.343ROE = RNOA + LEV*Spread 0.211 0.211 0.201 0.212Marg<strong>in</strong> AnalysisGross Marg<strong>in</strong> 0.431 0.434 0.439 0.460 0.462EBITDA Marg<strong>in</strong> 0.307 0.310 0.315 0.338 0.339EBIT Marg<strong>in</strong> 0.246 0.245 0.249 0.270 0.272Net Operat<strong>in</strong>g Marg<strong>in</strong> (b4 non-rec.) 0.239 0.240 0.245 0.268 0.268Net Operat<strong>in</strong>g Marg<strong>in</strong> 0.239 0.257 0.284 0.295 0.297Turnover AnalysisNet Operat<strong>in</strong>g Asset Turnover 0.593 0.554 0.538 0.568Net Work<strong>in</strong>g Capital Turnover (7.907) (7.750) (7.034) (5.533)Avge Days to Collect Receivables 4.920 5.872 7.099 7.152Avge Inventory Hold<strong>in</strong>g Period 15.157 15.012 14.936 14.698Avge Days to Pay Payables 28.650 25.820 26.461 31.426PP&E Turnover 0.616 0.589 0.581 0.596Analysis of Leverage-Long-Term Capital StructureDebt to Equity Ratio 0.646 0.521 0.456 0.298 0.381FFO to Total Debt 0.471 0.604 0.620 0.896CFO to Total Debt 0.475 0.650 0.710 1.118Analysis of Leverage- Short-Term LiquidityCurrent Ratio 0.426 0.431 0.439 0.427 0.326Quick Ratio 0.257 0.230 0.245 0.263 0.180EBIT Interest Coverage 8.635 7.769 8.604 11.825 14.190EBITDA Interest Coverage 10.788 9.805 10.866 14.817 17.664