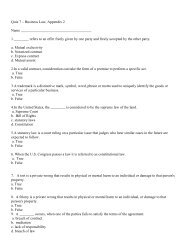
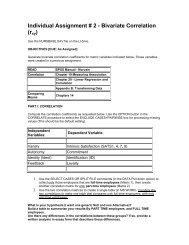
North America, but may fly to any part of <strong>the</strong> world to embark on a “North American”cruise. While all major cruise l<strong>in</strong>es offer “Air and Sea” options, this is really just aconvenience <strong>for</strong> <strong>the</strong>ir customers. The air portion is priced at cost, and this portion of <strong>the</strong>trip is handled completely by <strong>the</strong> airl<strong>in</strong>e. Virtually all cruise purchases take placethrough a local travel agent.Demand <strong>for</strong> cruise vacations has growth rapidly over <strong>the</strong> past two decades as <strong>the</strong>figure below illustrates, with <strong>the</strong> only decrease <strong>in</strong> demand occurr<strong>in</strong>g <strong>in</strong> 1994-1995.Fur<strong>the</strong>r, <strong>the</strong> average length of a cruise trip has grown to approximately 6.6 days, reach<strong>in</strong>glevels not experienced s<strong>in</strong>ce <strong>the</strong> early 1980s. Because of <strong>the</strong> fixed/variable cost structure<strong>in</strong> <strong>the</strong> cruise <strong>in</strong>dustry, longer trips are typically more profitable than short trips, so <strong>the</strong><strong>in</strong>dustry has welcomed this trend.60007annual cruise passengers (thousands)500040003000200010006.86.66.46.265.801980198119821983198419851986198719881989199019911992average cruise length (days)19931994199519961997<strong>1998</strong>5.6The North American cruise <strong>in</strong>dustry is composed of two very large companiesand many small ones. Carnival Cruise L<strong>in</strong>es is <strong>the</strong> largest firm with 33 ships carry<strong>in</strong>g2,045,000 passengers <strong>in</strong> <strong>1998</strong>, 38% of <strong>the</strong> North American cruise market. <strong>Royal</strong><strong>Caribbean</strong> <strong>Cruises</strong> is <strong>the</strong> second largest company with 16 ships carry<strong>in</strong>g 1,841,000passengers <strong>in</strong> <strong>1998</strong>, a total of 34% of <strong>the</strong> North American market. A host of smallercruise l<strong>in</strong>es make up <strong>the</strong> rest of <strong>the</strong> <strong>in</strong>dustry, divid<strong>in</strong>g 1,542,000 passengers between 96vessels. The relative market shares are illustrated <strong>in</strong> <strong>the</strong> figure below.
<strong>1998</strong> Market Share100%154200080%691079660%40%298001841000All O<strong>the</strong>r<strong>Royal</strong> <strong>Caribbean</strong> <strong>Cruises</strong>Carnival <strong>Cruises</strong>1620%333946620450000%ships berths passengersThe Cruise ExperienceThe cruise <strong>in</strong>dustry offers a wide variety of ship sizes, luxury levels andit<strong>in</strong>eraries. From small, quasi-research vessels that probe Artic passages to massive“mega-ships” that resemble float<strong>in</strong>g Malls of America, <strong>the</strong> cruise <strong>in</strong>dustry offerssometh<strong>in</strong>g <strong>for</strong> everyone. The <strong>Caribbean</strong> is <strong>the</strong> most common dest<strong>in</strong>ation <strong>for</strong> cruises sold<strong>in</strong> North America, as seen <strong>in</strong> <strong>the</strong> table below, with approximately 39% of all passengerdaysdevoted to this dest<strong>in</strong>ation. However, <strong>the</strong> table also shows that <strong>the</strong>re has been asignificant <strong>in</strong>crease <strong>in</strong> demand <strong>for</strong> trips to locations such as <strong>the</strong> Mediterranean, Alaskaand Europe. The latest trend is <strong>for</strong> huge ships that carry as many as 3000 guests, andoffer a wide variety of enterta<strong>in</strong>ment alternatives. Such vessels feature rock-climb<strong>in</strong>g,ice-skat<strong>in</strong>g, m<strong>in</strong>iature golf, c<strong>in</strong>emas, discos, spa facilities, libraries, cas<strong>in</strong>os, extensivelive enterta<strong>in</strong>ment, and entire shopp<strong>in</strong>g malls, all onboard <strong>the</strong> ship. The focus of <strong>the</strong>secruise alternatives is on <strong>the</strong> vessel, ra<strong>the</strong>r than <strong>the</strong> dest<strong>in</strong>ation. Bob Dick<strong>in</strong>son, <strong>the</strong>president of Carnival <strong>Cruises</strong>, remarked “Now, <strong>the</strong> cruise itself is <strong>the</strong> dest<strong>in</strong>ation –magnificent float<strong>in</strong>g resorts. To me, <strong>the</strong> it<strong>in</strong>erary is a little Green Stamp, a little extrath<strong>in</strong>g.”Dest<strong>in</strong>ation (total bed-days) 1987 % of Total 1995 % of Total <strong>1998</strong> % of TotalCARIBBEAN 8,828,791 43.3% 15,254,551 42.8% 17,117,659 38.7%MEDITERRANEAN 841,051 4.1% 3,477,729 9.8% 5,092,530 11.5%ALASKA 1,715,197 8.4% 3,008,146 8.4% 3,790,816 8.6%BAHAMAS 1,922,386 9.4% 2,761,224 7.7% 2,891,352 6.5%TRANSCANAL 970,191 4.8% 2,277,201 6.4% 2,612,788 5.9%MEXICO WEST 1,131,462 5.6% 1,754,312 4.9% 2,421,126 5.5%EUROPE 357,516 1.8% 1,582,589 4.4% 3,714,437 8.4%BERMUDA 1,141,121 5.6% 1,094,707 3.1% 1,094,982 2.5%SOUTH AMERICA 620,396 3.0% 255,830 0.7% 943,392 2.1%TRANSATLANTIC 339,388 1.7% 658,928 1.8% 725,040 1.6%HAWAII 602,728 3.0% 601,542 1.7% 745,216 1.7%ALL OTHER (15 o<strong>the</strong>r locations) 1,906,767 9.4% 2,935,123 14.4% 3,091,374 15.2%TOTAL 20,376,994 100.0% 35,661,882 100.0% 44,240,712 100%