Forecasting for the Love Boat: Royal Caribbean Cruises in 1998(
Forecasting for the Love Boat: Royal Caribbean Cruises in 1998(
Forecasting for the Love Boat: Royal Caribbean Cruises in 1998(

Create successful ePaper yourself
Turn your PDF publications into a flip-book with our unique Google optimized e-Paper software.
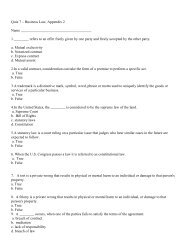
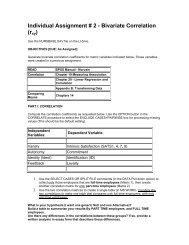
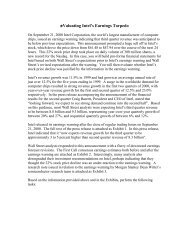
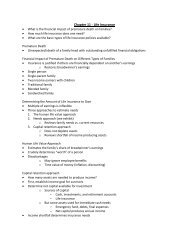
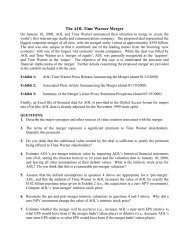
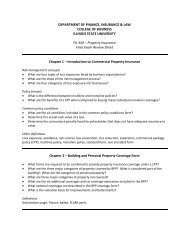
North America, but may fly to any part of <strong>the</strong> world to embark on a “North American”cruise. While all major cruise l<strong>in</strong>es offer “Air and Sea” options, this is really just aconvenience <strong>for</strong> <strong>the</strong>ir customers. The air portion is priced at cost, and this portion of <strong>the</strong>trip is handled completely by <strong>the</strong> airl<strong>in</strong>e. Virtually all cruise purchases take placethrough a local travel agent.Demand <strong>for</strong> cruise vacations has growth rapidly over <strong>the</strong> past two decades as <strong>the</strong>figure below illustrates, with <strong>the</strong> only decrease <strong>in</strong> demand occurr<strong>in</strong>g <strong>in</strong> 1994-1995.Fur<strong>the</strong>r, <strong>the</strong> average length of a cruise trip has grown to approximately 6.6 days, reach<strong>in</strong>glevels not experienced s<strong>in</strong>ce <strong>the</strong> early 1980s. Because of <strong>the</strong> fixed/variable cost structure<strong>in</strong> <strong>the</strong> cruise <strong>in</strong>dustry, longer trips are typically more profitable than short trips, so <strong>the</strong><strong>in</strong>dustry has welcomed this trend.60007annual cruise passengers (thousands)500040003000200010006.86.66.46.265.801980198119821983198419851986198719881989199019911992average cruise length (days)19931994199519961997<strong>1998</strong>5.6The North American cruise <strong>in</strong>dustry is composed of two very large companiesand many small ones. Carnival Cruise L<strong>in</strong>es is <strong>the</strong> largest firm with 33 ships carry<strong>in</strong>g2,045,000 passengers <strong>in</strong> <strong>1998</strong>, 38% of <strong>the</strong> North American cruise market. <strong>Royal</strong><strong>Caribbean</strong> <strong>Cruises</strong> is <strong>the</strong> second largest company with 16 ships carry<strong>in</strong>g 1,841,000passengers <strong>in</strong> <strong>1998</strong>, a total of 34% of <strong>the</strong> North American market. A host of smallercruise l<strong>in</strong>es make up <strong>the</strong> rest of <strong>the</strong> <strong>in</strong>dustry, divid<strong>in</strong>g 1,542,000 passengers between 96vessels. The relative market shares are illustrated <strong>in</strong> <strong>the</strong> figure below.
<strong>1998</strong> Market Share100%154200080%691079660%40%298001841000All O<strong>the</strong>r<strong>Royal</strong> <strong>Caribbean</strong> <strong>Cruises</strong>Carnival <strong>Cruises</strong>1620%333946620450000%ships berths passengersThe Cruise ExperienceThe cruise <strong>in</strong>dustry offers a wide variety of ship sizes, luxury levels andit<strong>in</strong>eraries. From small, quasi-research vessels that probe Artic passages to massive“mega-ships” that resemble float<strong>in</strong>g Malls of America, <strong>the</strong> cruise <strong>in</strong>dustry offerssometh<strong>in</strong>g <strong>for</strong> everyone. The <strong>Caribbean</strong> is <strong>the</strong> most common dest<strong>in</strong>ation <strong>for</strong> cruises sold<strong>in</strong> North America, as seen <strong>in</strong> <strong>the</strong> table below, with approximately 39% of all passengerdaysdevoted to this dest<strong>in</strong>ation. However, <strong>the</strong> table also shows that <strong>the</strong>re has been asignificant <strong>in</strong>crease <strong>in</strong> demand <strong>for</strong> trips to locations such as <strong>the</strong> Mediterranean, Alaskaand Europe. The latest trend is <strong>for</strong> huge ships that carry as many as 3000 guests, andoffer a wide variety of enterta<strong>in</strong>ment alternatives. Such vessels feature rock-climb<strong>in</strong>g,ice-skat<strong>in</strong>g, m<strong>in</strong>iature golf, c<strong>in</strong>emas, discos, spa facilities, libraries, cas<strong>in</strong>os, extensivelive enterta<strong>in</strong>ment, and entire shopp<strong>in</strong>g malls, all onboard <strong>the</strong> ship. The focus of <strong>the</strong>secruise alternatives is on <strong>the</strong> vessel, ra<strong>the</strong>r than <strong>the</strong> dest<strong>in</strong>ation. Bob Dick<strong>in</strong>son, <strong>the</strong>president of Carnival <strong>Cruises</strong>, remarked “Now, <strong>the</strong> cruise itself is <strong>the</strong> dest<strong>in</strong>ation –magnificent float<strong>in</strong>g resorts. To me, <strong>the</strong> it<strong>in</strong>erary is a little Green Stamp, a little extrath<strong>in</strong>g.”Dest<strong>in</strong>ation (total bed-days) 1987 % of Total 1995 % of Total <strong>1998</strong> % of TotalCARIBBEAN 8,828,791 43.3% 15,254,551 42.8% 17,117,659 38.7%MEDITERRANEAN 841,051 4.1% 3,477,729 9.8% 5,092,530 11.5%ALASKA 1,715,197 8.4% 3,008,146 8.4% 3,790,816 8.6%BAHAMAS 1,922,386 9.4% 2,761,224 7.7% 2,891,352 6.5%TRANSCANAL 970,191 4.8% 2,277,201 6.4% 2,612,788 5.9%MEXICO WEST 1,131,462 5.6% 1,754,312 4.9% 2,421,126 5.5%EUROPE 357,516 1.8% 1,582,589 4.4% 3,714,437 8.4%BERMUDA 1,141,121 5.6% 1,094,707 3.1% 1,094,982 2.5%SOUTH AMERICA 620,396 3.0% 255,830 0.7% 943,392 2.1%TRANSATLANTIC 339,388 1.7% 658,928 1.8% 725,040 1.6%HAWAII 602,728 3.0% 601,542 1.7% 745,216 1.7%ALL OTHER (15 o<strong>the</strong>r locations) 1,906,767 9.4% 2,935,123 14.4% 3,091,374 15.2%TOTAL 20,376,994 100.0% 35,661,882 100.0% 44,240,712 100%
Who’s OnboardObviously different types of cruises attract different types of customers.None<strong>the</strong>less, certa<strong>in</strong> demographic profiles are most likely to take a cruise. The tablebelow compares <strong>the</strong> demographic profile of those who have taken a cruise with <strong>the</strong> entireU.S. population over <strong>the</strong> age of 24. Generally, <strong>the</strong> population of past cruisers is older,wealthier and better educated than <strong>the</strong> entire population.DemographicProfileGender:Age:MaritalStatus:HouseholdComposition:Education:HouseholdIncome:MaleFemale25-under 40 years40-59 years60 years or olderAverageMedianMarriedNot MarriedHave childrenunder 18Adults onlyEver Cruised49%51%27%42%32%51 yrs.51 yrs.76%24%Past 5 YearCruisers51%48%28%42%30%50 yrs.51 yrs.78%22%Populationover Age 2450%49%43%44%13%43 yrs.42 yrs.69%31%37%63%35%65%54%46%Occupants 3 3 3Some College orless42% 36% 54%College Graduate or 58% 64% 46%more$20,000-$29,999$30,000-$39,999$40,000-$59,999$60,000-$99,999$100,000 or moreAverageMedian8%12%32%28%20%$72,600$58,5005%10%31%30%25%$79,100$64,50013%17%31%29%9%$60,400$51,800Exam<strong>in</strong><strong>in</strong>g those who have cruised most recently reveals a few different types ofcustomers, as <strong>the</strong> figure below illustrates, but most seek <strong>the</strong> relaxation and pamper<strong>in</strong>gthat a cruise can provide. Indeed, when <strong>the</strong> recent cruiser population was asked whatcruis<strong>in</strong>g offered that was superior to o<strong>the</strong>r types of vacations, <strong>the</strong> top three responseswere “be<strong>in</strong>g pamper,” “f<strong>in</strong>e d<strong>in</strong><strong>in</strong>g” and “hassle free.”
Restless Baby Boomers are newest to cruis<strong>in</strong>g. They are at a po<strong>in</strong>t <strong>in</strong> time when <strong>the</strong>y may be try<strong>in</strong>gdifferent vacation experiences.Enthusiastic Baby Boomers are already conv<strong>in</strong>ced about cruis<strong>in</strong>g and its many activities. They live<strong>in</strong>tense, stressful lives and look to vacations generally, and cruises <strong>in</strong> particular, <strong>for</strong> <strong>the</strong> escape andrelaxation <strong>the</strong>y offer.Luxury Seekers can af<strong>for</strong>d, and are will<strong>in</strong>g to spend money <strong>for</strong> deluxe accommodations and pamper<strong>in</strong>g.Consummate Shoppers are look<strong>in</strong>g <strong>for</strong> <strong>the</strong> best value <strong>in</strong> a vacation and <strong>in</strong> a cruise.Explorers are well-educated, well-traveled <strong>in</strong>dividuals with an <strong>in</strong>tellectual <strong>in</strong>terest and curiosity aboutdifferent dest<strong>in</strong>ations.Ship Buffs are <strong>the</strong> most senior segment: <strong>the</strong>y have cruised extensively and expect to cont<strong>in</strong>ue because<strong>the</strong>y f<strong>in</strong>d <strong>the</strong> on-board experience of cruis<strong>in</strong>g so pleasurable and com<strong>for</strong>table.Supply of Available BerthsThe supply of available berths as of <strong>1998</strong> was shown <strong>in</strong> <strong>the</strong> market share figure givenearlier. Fur<strong>the</strong>r, because <strong>the</strong> lead-time necessary to design and build a cruise ship isapproximately three years, a reasonably accurate <strong>for</strong>ecast of future supply is available <strong>for</strong><strong>the</strong> next three years, as seen <strong>in</strong> <strong>the</strong> figure below (more detailed <strong>in</strong><strong>for</strong>mation about <strong>Royal</strong><strong>Caribbean</strong>’s new ships is available later <strong>in</strong> <strong>the</strong> case). It is more difficult to estimate <strong>the</strong>amount of capacity that will be retired <strong>in</strong> <strong>the</strong> future. Over <strong>the</strong> past five years, 48 shipswith a total of 28,900 berths have been retired or moved out of <strong>the</strong> North Americanmarket. However, many of <strong>the</strong>se retirements occurred because of a 1997 deadl<strong>in</strong>e tomeet <strong>the</strong> heightened safety requirements imposed by <strong>the</strong> International MaritimeOrganization. From 1994 through 1996, retirements exceeded 7000 berths per year buthave slowed considerably s<strong>in</strong>ce <strong>the</strong>n.NEW Capacity 1999 1999 2000 2000 2001 2001total totalnew newships berths ships berths ships berths ships berthsCarnival <strong>Cruises</strong>(<strong>in</strong>cludes Holland brand)3 5480 2 6180 2 3900 7 15560<strong>Royal</strong> <strong>Caribbean</strong> <strong>Cruises</strong>(<strong>in</strong>cludes Celebrity brand)1 3100 2 5100 3 6100 6 14300All O<strong>the</strong>r Cruise L<strong>in</strong>es 7 7794 2 2800 4 6296 13 16890Total New Ships/Berths 11 16374 6 14080 9 16296 26 46750
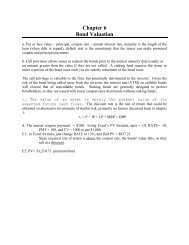
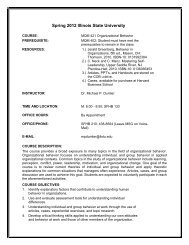
Demand <strong>for</strong> a Cruise VacationTo date only 11% of <strong>the</strong> U.S. population has ever taken a cruise. However, a recentcruise <strong>in</strong>dustry survey of people over <strong>the</strong> age of 24 found that 56% are <strong>in</strong>terest<strong>in</strong>g <strong>in</strong>cruis<strong>in</strong>g sometime <strong>in</strong> <strong>the</strong> future and 31% responded that <strong>the</strong>y will def<strong>in</strong>itely take a cruise<strong>in</strong> <strong>the</strong> next five years. Demographic trends also favor <strong>the</strong> cruise <strong>in</strong>dustry. As <strong>the</strong>demographic profile showed, 42% of recent cruise passengers are between <strong>the</strong> ages of 40and 59. As <strong>the</strong> baby boomers age, this segment of <strong>the</strong> U.S. population is estimated togrow at more than three times <strong>the</strong> national population growth rate over <strong>the</strong> next threeyears, as seen <strong>in</strong> <strong>the</strong> figure below.3.50%annual population growth rates by age3.00%2.50%2.00%1.50%1.00%0.50%0.00%-0.50%-1.00%-1.50%-2.00%1999 2000 2001age 24 and under age 25-39 age 40-59 age 60 and overAlong with growth <strong>in</strong> <strong>the</strong> US population, it is possible that <strong>the</strong> amount of vacationtime per <strong>in</strong>dividual will <strong>in</strong>crease over time. Numerous studies have shown that <strong>the</strong> babyboomer generation values recreation more highly than previous generations. This isillustrated <strong>in</strong> <strong>the</strong> next figure that plots grow rates <strong>in</strong> <strong>the</strong> U.S. gross domestic product(GDP), personal consumption and recreation expenditures. As figure shows, growth <strong>in</strong>personal consumption maps closely to growth <strong>in</strong> <strong>the</strong> gross domestic product (GDP). Bycomparison, recreation spend<strong>in</strong>g has grown faster than personal consumption <strong>in</strong> everyyear s<strong>in</strong>ce 1980, with <strong>the</strong> gap between <strong>the</strong> two <strong>in</strong>creas<strong>in</strong>g dramatically after <strong>the</strong> 1991recession. This <strong>in</strong>crease is widely attributed to <strong>the</strong> consumption tastes of <strong>the</strong> babyboomer generation. The figure also shows <strong>the</strong> <strong>1998</strong> Congressional Budget Office’s<strong>for</strong>ecasts <strong>for</strong> future GDP growth.
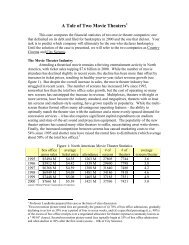
12.010.08.06.04.02.00.01980198119821983percentage growth19841985198619871988198919901991199219931994199519961997<strong>1998</strong>E1999E2000E2001E-2.0-4.0Real GDP Personal Consumption Expenditures Recreation ExpendituresF<strong>in</strong>ally, U.S. residents vacation far less than <strong>the</strong> citizens of all o<strong>the</strong>r developed countries,averag<strong>in</strong>g just 13 days per year. As <strong>the</strong> figure below illustrates, even <strong>the</strong> hard-work<strong>in</strong>gJapanese and Koreans vacation almost twice as much as Americans. Italians, liv<strong>in</strong>g <strong>the</strong>good life, vacation more than three times as much. It is certa<strong>in</strong>ly possible that Americanswill <strong>in</strong>crease <strong>the</strong>ir vacation expenditures even more <strong>in</strong> <strong>the</strong> future.45Average Number of Vacation Days4035302520151050Italy France Germany Brazil Austria UK Canada Korea Japan USA
Appendix 1Cruise Industry, Demographic and Macroeconomic DataPanel A: passengers and berths over timeyear 1980 1981 1982 1983 1984 1985 1986 1987 1988annual passengers (thousands) 1431 1453 1471 1755 1859 2152 2624 2898 3175average lenth of trip (days) 6.7 6.9 6.9 6.9 6.8 6.4 6.4 6.4% of passengers on 2-5 day trips 29.6 25.3 21.6 22.3 26.3 35.1 32.8 32.9available berths 41073 47266 47834 52392 56771 60446 66810 72268passenger growth % 1.5% 1.2% 19.3% 5.9% 15.8% 21.9% 10.4% 9.6%berth growth % 15.1% 1.2% 9.5% 8.4% 6.5% 10.5% 8.2%year 1990 1991 1992 1993 1994 1995 1996 1997 <strong>1998</strong>annual passengers (thousands) 3640 3979 4136 4480 4448 4378 4656 5051 5428average lenth of trip (days) 6.2 6.1 6.2 6.4 6.3 6.5 6.4 6.5 6.6% of passengers on 2-5 day trips 38.3 37.4 35.2 36.7 38 33.7 35.9 33.6 34.7available berths 83533 86631 97539 103988 103296 105171 110292 118399 138373passenger growth % 0.10773 0.093132 0.039457 0.083172 -0.007143 -0.015737 0.063499 0.084837 0.074639berth growth % 0.154265 0.037087 0.125913 0.066117 -0.006655 0.018152 0.048692 0.073505 0.168701Panel B: exist<strong>in</strong>g and new capacity<strong>1998</strong> exist<strong>in</strong>g <strong>1998</strong> exist<strong>in</strong>g NEW Capacity 1999 1999 2000 2000 2001 2001total totalnew newships berths ships berths ships berths ships berths ships berths33 39466Carnival <strong>Cruises</strong>(<strong>in</strong>cludes Holland brand)3 5480 2 6180 2 3900 7 1556016 29800<strong>Royal</strong> <strong>Caribbean</strong> <strong>Cruises</strong>(<strong>in</strong>cludes Celebrity brand)1 3100 2 5100 3 6100 6 1430096 69107 All O<strong>the</strong>r Cruise L<strong>in</strong>es 7 7794 2 2800 4 6296 13 16890145 138373 Total New Ships/Berths 11 16374 6 14080 9 16296 26 46750Panel C: dest<strong>in</strong>ationsDest<strong>in</strong>ation (total bed-days) 1987 % of Total 1995 % of Total <strong>1998</strong> % of TotalCARIBBEAN 8,828,791 43.3% 15,254,551 42.8% 17,117,659 38.7%MEDITERRANEAN 841,051 4.1% 3,477,729 9.8% 5,092,530 11.5%ALASKA 1,715,197 8.4% 3,008,146 8.4% 3,790,816 8.6%BAHAMAS 1,922,386 9.4% 2,761,224 7.7% 2,891,352 6.5%TRANSCANAL 970,191 4.8% 2,277,201 6.4% 2,612,788 5.9%MEXICO WEST 1,131,462 5.6% 1,754,312 4.9% 2,421,126 5.5%EUROPE 357,516 1.8% 1,582,589 4.4% 3,714,437 8.4%BERMUDA 1,141,121 5.6% 1,094,707 3.1% 1,094,982 2.5%SOUTH AMERICA 620,396 3.0% 255,830 0.7% 943,392 2.1%TRANSATLANTIC 339,388 1.7% 658,928 1.8% 725,040 1.6%HAWAII 602,728 3.0% 601,542 1.7% 745,216 1.7%ALL OTHER (15 o<strong>the</strong>r locations) 1,906,767 9.4% 2,935,123 14.4% 3,091,374 15.2%TOTAL 20,376,994 100.0% 35,661,882 100.0% 44,240,712 100%PanelD: U.S. demographics
US Demographic Estimates 1-Jul-98 1-Jul-99 1-Jul-00 1-Jul-01 1-Jul-02 1-Jul-03 1-Jul-04 1-Jul-05(all amounts <strong>in</strong> thousands)Po p ulation, All Ages 270,299 272,820 275,306 277,803 280,306 282,798 285,266 287,716Summary Ind ic a torsMedian Age.......... 35.2 35.5 35.8 36 36.2 36.4 36.5 36.7Mean Age............ 36.2 36.4 36.5 36.7 36.8 36.9 37.1 37.224 a nd und er 95,342 96,197 96,969 97,792 98,484 99,143 99,695 100,11725 to 39 61,400 60,556 59,717 58,862 58,158 57,564 57,137 57,01540 to 59 68,886 70,981 73,108 75,131 77,020 78,485 80,027 81,36760 a nd over 44,670 45,086 45,514 46,016 46,645 47,606 48,406 49,220annual growth <strong>in</strong> population 0.93% 0.91% 0.91% 0.90% 0.89% 0.87% 0.86%a ge 24 and under 0.90% 0.80% 0.85% 0.71% 0.67% 0.56% 0.42%a ge 25-39 -1.37% -1.39% -1.43% -1.20% -1.02% -0.74% -0.21%a ge 40-59 3.04% 3.00% 2.77% 2.51% 1.90% 1.96% 1.67%a ge 60 a nd over 0.93% 0.95% 1.10% 1.37% 2.06% 1.68% 1.68%Panel E: macroeconomic trends and estimates% growth <strong>in</strong> Personal% growth <strong>in</strong> CPI Consumption Recreationreal GDP (<strong>in</strong>flation) Expenditures Expenditures1980 -0.3 13.5 -0.4 -0.11981 2.3 10.3 1.2 4.01982 -2.1 6.2 1.2 2.41983 4.0 3.2 5.2 8.91984 7.0 4.3 5.2 9.51985 3.6 3.6 4.7 6.41986 3.1 1.9 4 8.01987 3.0 3.6 3.1 7.31988 3.8 4.1 3.9 8.01989 3.4 4.8 2.3 4.41990 1.2 5.4 1.7 3.41991 -0.9 4.2 -0.6 1.11992 2.7 3.0 2.8 5.31993 2.3 3.0 2.8 8.81994 3.5 2.6 3.1 8.01995 2.3 2.8 2.3 9.31996 3.5 3.0 2.5 7.71997 3.9 2.3 3.5 8.6<strong>1998</strong>E 3.0 2.91999E 2.1 2.32000E 1.9 2.52001E 2.0 2.4estimates are from <strong>the</strong> <strong>1998</strong> Economic and Budget Outlook from <strong>the</strong>Congressional Budget Officesource: Bureau of Economic Analysis
----------------------------------------------------------------------------------------------------------------------------------------------------------------SECURITIES AND EXCHANGE COMMISSIONWASHINGTON, D.C. 20549FORM 20-F(MARK ONE)[ ] REGISTRATION STATEMENT PURSUANT TO SECTION 12(B) OR (G) OFTHE SECURITIES EXCHANGE ACT OF 1934OR[X]ANNUAL REPORT PURSUANT TO SECTION 13 OR 15(D) OF THESECURITIES EXCHANGE ACT OF 1934FOR THE FISCAL YEAR ENDED DECEMBER 31, <strong>1998</strong>OR[ ] TRANSITION REPORT PURSUANT TO SECTION 13 OR 15(D) OF THESECURITIES EXCHANGE ACT OF 1934COMMISSION FILE NUMBER: 1-11884ROYAL CARIBBEAN CRUISES LTD.(Exact name of Registrant as specified <strong>in</strong> its charter)REPUBLIC OF LIBERIA(Jurisdiction of <strong>in</strong>corporation or organization)1050 CARIBBEAN WAY, MIAMI, FLORIDA 33132(Address of pr<strong>in</strong>cipal executive offices)Securities registered or to be registered pursuant to Section 12(b) of <strong>the</strong> Act:TITLE OF EACH CLASSNAME OF EACH EXCHANGE ON WHICH REGISTERED------------------- ---------------------------------------Common Stock, par value $.01 per shareNew York Stock Exchange$3.625 Series A Convertible Preferred Stock New York Stock Exchangepar value $.01 per share
PART IITEM 1. DESCRIPTION OF BUSINESSGENERAL<strong>Royal</strong> <strong>Caribbean</strong> <strong>Cruises</strong> Ltd., a Liberian corporation, <strong>in</strong>clud<strong>in</strong>g its subsidiaries (<strong>the</strong> "Company"), is <strong>the</strong> world's second largestcruise company with 16 cruise ships and a total of 29,800 berths. The Company offers more than 110 different it<strong>in</strong>eraries that callon more than 175 dest<strong>in</strong>ations on six cont<strong>in</strong>ents.The Company operates two brands, <strong>the</strong> <strong>Royal</strong> <strong>Caribbean</strong> International brand ("<strong>Royal</strong> <strong>Caribbean</strong> International") and <strong>the</strong> Celebrity<strong>Cruises</strong> brand ("Celebrity <strong>Cruises</strong>"). The Company acquired Celebrity Cruise L<strong>in</strong>es Inc. ("Celebrity") <strong>in</strong> July 1997.The <strong>Royal</strong> <strong>Caribbean</strong> International Brand<strong>Royal</strong> <strong>Caribbean</strong> International serves <strong>the</strong> volume cruise vacation market which it categorizes as <strong>the</strong> contemporary and premiumsegments. The brand operates 11 cruise ships with an aggregate of 21,600 berths, offer<strong>in</strong>g more than 60 different cruiseit<strong>in</strong>eraries, that range from three to 21 nights and call on more than 140 dest<strong>in</strong>ations on six cont<strong>in</strong>ents.<strong>Royal</strong> <strong>Caribbean</strong> International's strategy is to attract a broad array of vacation<strong>in</strong>g consumers <strong>in</strong> <strong>the</strong> contemporary segment of <strong>the</strong>volume market by provid<strong>in</strong>g a wide variety of it<strong>in</strong>eraries, vary<strong>in</strong>g cruise lengths and multiple options <strong>for</strong> d<strong>in</strong><strong>in</strong>g andenterta<strong>in</strong>ment aboard its vessels. The Company believes that <strong>the</strong> variety and quality of <strong>Royal</strong> <strong>Caribbean</strong> International's productoffer<strong>in</strong>g represent excellent value to consumers, especially to couples and families travel<strong>in</strong>g with children. While <strong>the</strong> brand ispositioned at <strong>the</strong> upper end of <strong>the</strong> contemporary segment, <strong>the</strong> Company believes that <strong>Royal</strong> <strong>Caribbean</strong> International's qualityenables it to attract consumers from <strong>the</strong> premium segment as well, <strong>the</strong>reby achiev<strong>in</strong>g <strong>the</strong> broadest market coverage of any of <strong>the</strong>major brands <strong>in</strong> <strong>the</strong> cruise <strong>in</strong>dustry.The Celebrity <strong>Cruises</strong> BrandCelebrity <strong>Cruises</strong> primarily serves <strong>the</strong> premium segment of <strong>the</strong> cruise vacation market. Celebrity <strong>Cruises</strong> operates five cruiseships with an aggregate of 8,200 berths. Celebrity <strong>Cruises</strong> offers more than 40 different it<strong>in</strong>eraries, that range from five to 19nights, reach<strong>in</strong>g over 80 dest<strong>in</strong>ations <strong>in</strong> Alaska, Bermuda, <strong>the</strong> <strong>Caribbean</strong>, Europe, Mexico, and <strong>the</strong> Panama Canal.Celebrity <strong>Cruises</strong>' strategy is to attract consumers who want an enhanced cruise vacation <strong>in</strong> terms of modern vessels, f<strong>in</strong>e d<strong>in</strong><strong>in</strong>gand service, large staterooms, a high staff to guest ratio, excellent spas and high technology. These are hallmarks of <strong>the</strong> premiumcruise vacation market, which is Celebrity <strong>Cruises</strong>' primary target. One of Celebrity <strong>Cruises</strong>' pr<strong>in</strong>cipal objectives is to offer apremium cruise experience. As such, it also attracts consumers from <strong>the</strong> contemporary and luxury cruise categories.Both brands offer a wide array of shipboard activities, services and amenities <strong>in</strong>clud<strong>in</strong>g swimm<strong>in</strong>g pools, sun decks, beautysalons, exercise and massage facilities, gam<strong>in</strong>g facilities, lounges, bars, show-time enterta<strong>in</strong>ment, retail shopp<strong>in</strong>g and c<strong>in</strong>emas.Although many of <strong>the</strong> shipboard activities are <strong>in</strong>cluded <strong>in</strong> <strong>the</strong> base price of <strong>the</strong> cruise, revenues are also realized from gam<strong>in</strong>gfacilities, <strong>the</strong> sale of alcoholic and o<strong>the</strong>r beverages, retail sales and shore excursions.INDUSTRYS<strong>in</strong>ce 1970, cruis<strong>in</strong>g has been one of <strong>the</strong> fastest grow<strong>in</strong>g sectors of <strong>the</strong> vacation market, as <strong>the</strong> number of North American guestshas grown to an estimated 5.4 million <strong>in</strong> <strong>1998</strong> from 0.5 million <strong>in</strong> 1970, a compound annual growth rate of approximately 9%,accord<strong>in</strong>g to Cruise L<strong>in</strong>es International Association ("CLIA"). The Company has capitalized on <strong>the</strong> <strong>in</strong>creas<strong>in</strong>g popularity ofcruises through an extensive fleet expansion program. The Company's revenues have <strong>in</strong>creased at a compound annual growth rateof approximately 18% between 1988 and <strong>1998</strong>. The Company's market share of North American guests carried <strong>in</strong> <strong>1998</strong> isestimated to have been approximately 33.9%.The follow<strong>in</strong>g table sets <strong>for</strong>th data regard<strong>in</strong>g <strong>in</strong>dustry and Company growth over <strong>the</strong> past five years based on guests carried <strong>for</strong> atleast three consecutive nights:GUESTSCARRIED ON NORTHTHEAMERICANCOMPANY'S CRUISE COMPANYYEAR SHIPS(2) GUESTS(1) PERCENTAGE---- ---------- ------------- ----------1994.................................. 1,051,868 4,448,000 23.6%1995.................................. 1,058,126 4,378,000 24.21996.................................. 1,245,696 4,659,000 26.71997.................................. 1,633,457 5,051,000 32.3<strong>1998</strong>.................................. 1,841,152 5,428,000 33.9(1) Source: CLIA (2) 1994 -- 1997 are pro<strong>for</strong>ma to <strong>in</strong>clude Celebrity <strong>Cruises</strong>
Accord<strong>in</strong>g to CLIA and o<strong>the</strong>r trade publications, <strong>the</strong> North American market was served by an estimated 130 cruise ships with anaggregate capacity of approximately 102,000 berths at <strong>the</strong> end of 1993. The number of berths <strong>in</strong> <strong>the</strong> <strong>in</strong>dustry is estimated to have<strong>in</strong>creased to approximately 128,000 berths on 122 ships by <strong>the</strong> end of <strong>1998</strong>. There are a number of cruise ships on order with atotal estimated capacity of 64,000 berths which will be placed <strong>in</strong> service between 1999 and 2004. Over <strong>the</strong> last five years,approximately 48 ships with an aggregate capacity of approximately 28,900 berths have ei<strong>the</strong>r been retired or moved out of <strong>the</strong>North American market. Although <strong>the</strong> Company cannot predict <strong>the</strong> rate at which future retirements will occur, <strong>the</strong> Companybelieves ship retirements will cont<strong>in</strong>ue due to competitive pressures and age of vessels.Cruise l<strong>in</strong>es compete <strong>for</strong> consumers' disposable leisure time dollars with o<strong>the</strong>r vacation alternatives such as land-based resorthotels and sightsee<strong>in</strong>g dest<strong>in</strong>ations, and public demand <strong>for</strong> such activities is <strong>in</strong>fluenced by general economic conditions. TheCompany believes that cruise guests currently represent only a small share of <strong>the</strong> vacation market and that a significant portion ofcruise guests carried are "first-time cruisers."OPERATING STRATEGIESThe Company's pr<strong>in</strong>cipal operat<strong>in</strong>g strategies are <strong>the</strong> follow<strong>in</strong>g: (i) build <strong>the</strong> awareness and market penetration of <strong>the</strong> brands; (ii)cont<strong>in</strong>ue to expand its fleet with state-of-<strong>the</strong>-art cruise ships; (iii) broaden its it<strong>in</strong>eraries worldwide; (iv) ma<strong>in</strong>ta<strong>in</strong> its competitiveposition with respect to <strong>the</strong> quality and <strong>in</strong>novation of its on-board product; (v) ma<strong>in</strong>ta<strong>in</strong> strong relationships with travel agencies,<strong>the</strong> pr<strong>in</strong>cipal <strong>in</strong>dustry distribution system; (vi) fur<strong>the</strong>r expand <strong>in</strong>ternational passenger sourc<strong>in</strong>g; (vii) utilize sophisticated yieldmanagement systems (revenue optimization per berth); and (viii) fur<strong>the</strong>r improve its technological capabilities.Brand AwarenessThe Company's strategy is to cont<strong>in</strong>ue to broaden <strong>the</strong> recognition of both <strong>the</strong> <strong>Royal</strong> <strong>Caribbean</strong> International brand and <strong>the</strong>Celebrity <strong>Cruises</strong> brand <strong>in</strong> <strong>the</strong> cruise vacation marketplace. Each brand has a dist<strong>in</strong>ct identity and market<strong>in</strong>g focus but utilizesshared <strong>in</strong>frastructure resources.<strong>Royal</strong> <strong>Caribbean</strong> International has positioned itself <strong>in</strong> <strong>the</strong> contemporary and premium segments of <strong>the</strong> cruise vacation market andfocuses on provid<strong>in</strong>g multiple choices to its guests through a variety of it<strong>in</strong>eraries, accommodations, d<strong>in</strong><strong>in</strong>g, ship activities andshore excursions. Hallmarks of <strong>the</strong> brand <strong>in</strong>clude friendly service, family programs, enterta<strong>in</strong>ment, health and fitness andactivities <strong>for</strong> various age groups.Celebrity <strong>Cruises</strong> primarily serves <strong>the</strong> premium segment of <strong>the</strong> cruise vacation market. The brand is recognized <strong>for</strong> its f<strong>in</strong>ed<strong>in</strong><strong>in</strong>g, impeccable service, large staterooms, a high staff to guest ratio and excellent spa facilities. In <strong>1998</strong> and 1999 Berlitz ratedCelebrity <strong>Cruises</strong> <strong>the</strong> highest rated premium cruise l<strong>in</strong>e <strong>in</strong> <strong>the</strong> large vessel category (over 1,000 passenger berths).Fleet Expansion<strong>Royal</strong> <strong>Caribbean</strong> InternationalFounded <strong>in</strong> 1968, <strong>Royal</strong> <strong>Caribbean</strong> International was <strong>the</strong> first cruise l<strong>in</strong>e to design ships specially <strong>for</strong> warm water year roundcruis<strong>in</strong>g. <strong>Royal</strong> <strong>Caribbean</strong> International operated a modern fleet <strong>in</strong> <strong>the</strong> 1970's and early 1980's, establish<strong>in</strong>g a reputation <strong>for</strong> highquality. Between 1988 and 1992, <strong>the</strong> brand tripled its capacity by embark<strong>in</strong>g on its first major capital expansion program. <strong>Royal</strong><strong>Caribbean</strong> International committed to its second capital expansion program with orders <strong>for</strong> six Vision-class vessels, rang<strong>in</strong>g <strong>in</strong>size from 1,800 to 2,000 berths, <strong>for</strong> delivery from 1995 through <strong>1998</strong>. With <strong>the</strong> delivery of <strong>the</strong> Vision-class vessels, <strong>Royal</strong><strong>Caribbean</strong> International's capacity <strong>in</strong>creased by 61.7% to 23,000 berths at <strong>the</strong> end of <strong>1998</strong>. Each Vision-class ship features aseven-deck atrium with glass elevators, skylights and glass walls; a pool and enterta<strong>in</strong>ment complex covered by a moveable glassroof; hundreds of cab<strong>in</strong>s with verandahs; a two-deck ma<strong>in</strong> d<strong>in</strong><strong>in</strong>g room; a state-of-<strong>the</strong>-art show <strong>the</strong>ater; a glass-encased<strong>in</strong>door/outdoor cafe; and a shopp<strong>in</strong>g mall. The ships are designed to be faster than most cruise ships which permits moreflexibility <strong>in</strong> it<strong>in</strong>erary plann<strong>in</strong>g.<strong>Royal</strong> <strong>Caribbean</strong> International currently has three Eagle-class vessels on order <strong>for</strong> delivery <strong>in</strong> <strong>the</strong> fourth quarter of 1999, thirdquarter of 2000 and second quarter of 2002. The Eagle-class vessels will be <strong>the</strong> largest passenger cruise ships built to date;142,000 tons with 3,100 berths. This new generation of vessels will be designed to provide more diverse vacation options <strong>for</strong>families and those seek<strong>in</strong>g active sports and enterta<strong>in</strong>ment alternatives. Each Eagle-class ship features <strong>the</strong> cruise <strong>in</strong>dustry's firsthorizontal atrium which is <strong>the</strong> length of two football fields, four decks high and <strong>in</strong>cludes two eleven-deck atriums; recreationalactivities such as rock climb<strong>in</strong>g and ice skat<strong>in</strong>g; enhanced staterooms; expanded d<strong>in</strong><strong>in</strong>g options; and a variety of <strong>in</strong>timate spaces.<strong>Royal</strong> <strong>Caribbean</strong> International also has two Vantage-class vessels on order scheduled <strong>for</strong> delivery <strong>in</strong> <strong>the</strong> first quarter of 2001 andsecond quarter of 2002. The Vantage-class is a progression from <strong>the</strong> brand's Vision-class series and will carry approximately2,100 guests.Beg<strong>in</strong>n<strong>in</strong>g <strong>in</strong> 1999 through 2002, <strong>Royal</strong> <strong>Caribbean</strong> International's capacity is expected to <strong>in</strong>crease 52.6% to 35,100 berths.
CELEBRITY CRUISESCelebrity <strong>Cruises</strong> was founded <strong>in</strong> 1990 and operated three ships between 1992 and 1995. Between 1995 and 1997, Celebrity<strong>Cruises</strong> undertook its first capital expansion program, add<strong>in</strong>g three Century-class vessels which range <strong>in</strong> size from 1,750 to 1,850berths. Celebrity <strong>Cruises</strong> has on order four Millennium-class vessels which will have approximately 2,000 berths and arescheduled <strong>for</strong> delivery <strong>in</strong> <strong>the</strong> second quarter 2000, first quarter 2001, third quarter 2001 and second quarter 2002. TheMillennium-class ships are a progression from <strong>the</strong> Century-class vessels, which have been widely accepted <strong>in</strong> <strong>the</strong> premiumsegment of <strong>the</strong> marketplace. This new class of vessels will build on <strong>the</strong> brands' primary strengths, <strong>in</strong>clud<strong>in</strong>g f<strong>in</strong>e d<strong>in</strong><strong>in</strong>g, largecab<strong>in</strong>s, extensive spa facilities and impeccable service.Beg<strong>in</strong>n<strong>in</strong>g <strong>in</strong> 2000 through 2002, Celebrity <strong>Cruises</strong>' capacity is expected to <strong>in</strong>crease 97.7% to 16,200 berths.At year-end <strong>1998</strong>, <strong>the</strong> Company's comb<strong>in</strong>ed fleet had an average age of approximately five years, which <strong>the</strong> Company believes is<strong>the</strong> youngest of any major cruise company. On a comb<strong>in</strong>ed basis, beg<strong>in</strong>n<strong>in</strong>g <strong>in</strong> 1999 through 2002, <strong>the</strong> Company's year-end berthcapacity is expected to <strong>in</strong>crease 64.4% from 31,200 to 51,300 berths.The Company's <strong>in</strong>creased average ship size and number of available berths have enabled it to achieve certa<strong>in</strong> economies of scale.Larger ships allow <strong>the</strong> Company to transport more guests than smaller ships without a correspond<strong>in</strong>g <strong>in</strong>crease <strong>in</strong> certa<strong>in</strong> operat<strong>in</strong>gexpenses. This <strong>in</strong>crease <strong>in</strong> fleet size also provides a larger revenue base to absorb its market<strong>in</strong>g, sell<strong>in</strong>g and adm<strong>in</strong>istrativeexpenses.Worldwide It<strong>in</strong>erariesThe Company's 1999 it<strong>in</strong>eraries <strong>in</strong>clude more than 110 different it<strong>in</strong>eraries that call on more than 175 dest<strong>in</strong>ations on sixcont<strong>in</strong>ents. New ships allow <strong>the</strong> Company to expand <strong>in</strong>to new dest<strong>in</strong>ations, it<strong>in</strong>eraries and markets. In 1999, <strong>Royal</strong> <strong>Caribbean</strong>International will be offer<strong>in</strong>g <strong>the</strong> "<strong>Royal</strong> Journeys" program which offers 10 global cruise it<strong>in</strong>eraries visit<strong>in</strong>g 41 ports <strong>in</strong> 19countries on four cont<strong>in</strong>ents. Celebrity <strong>Cruises</strong> is reposition<strong>in</strong>g a vessel to <strong>the</strong> European market. In addition, <strong>the</strong> Company is<strong>in</strong>creas<strong>in</strong>g its capacity <strong>in</strong> <strong>the</strong> short cruise market <strong>in</strong> 2000 by establish<strong>in</strong>g a <strong>Royal</strong> <strong>Caribbean</strong> International vessel year round <strong>in</strong>Port Canaveral to provide 3 and 4 day Bahamas cruises.Product InnovationThe Company recognizes <strong>the</strong> need <strong>for</strong> new and <strong>in</strong>novative on-board products and experiences <strong>for</strong> guests, and develops <strong>the</strong>seproducts based on guest feedback, crew suggestions and competitive product reviews. Accord<strong>in</strong>gly, <strong>the</strong> Company cont<strong>in</strong>ues to<strong>in</strong>vest <strong>in</strong> design <strong>in</strong>novations on new ships and additional product offer<strong>in</strong>gs on its exist<strong>in</strong>g fleet. New offer<strong>in</strong>gs such as expandedd<strong>in</strong><strong>in</strong>g options, and recreational activities such as rock climb<strong>in</strong>g and ice skat<strong>in</strong>g are among <strong>the</strong> services to be offered <strong>in</strong> <strong>the</strong> future.Travel Agency SupportBecause essentially all <strong>the</strong> book<strong>in</strong>gs <strong>for</strong> <strong>the</strong> Company's ships are made by <strong>in</strong>dependent travel agencies, <strong>the</strong> Company iscommitted to support<strong>in</strong>g <strong>the</strong> travel agency community. The Company ma<strong>in</strong>ta<strong>in</strong>s a large sales support organization <strong>in</strong>clud<strong>in</strong>g 100district sales managers support<strong>in</strong>g both brands <strong>in</strong> North America. The Company was <strong>the</strong> first cruise company to develop anautomated book<strong>in</strong>g system, CruiseMatch 2000(TM). This automated reservations system allows travel agents direct access to <strong>the</strong>Company's computer reservation system to improve ease of book<strong>in</strong>gs. More than 30,000 <strong>in</strong>dependent travel agencies worldwidecan book cruises <strong>for</strong> both brands us<strong>in</strong>g CruiseMatch 2000(TM). The Company also offers CruiseMatch 2000 Onl<strong>in</strong>e(R) whichmakes CruiseMatch 2000(TM) accessible to travel agencies through <strong>the</strong> <strong>Royal</strong> <strong>Caribbean</strong> International and Celebrity <strong>Cruises</strong>websites. In <strong>1998</strong>, <strong>the</strong> Company launched CruiseWriter(sm), an <strong>in</strong>stant collateral system that allows travel agents to customizecollateral materials <strong>for</strong> <strong>the</strong>ir clients. In 1997, <strong>the</strong> Company also opened a reservation call center <strong>in</strong> Wichita, Kansas to offergreater flexibility and extended hours of operations.International GuestsInternational guests cont<strong>in</strong>ue to provide an <strong>in</strong>creas<strong>in</strong>g share of <strong>the</strong> Company's growth. International guests have grown fromapproximately 7% of total guests <strong>in</strong> 1991 to approximately 16% of total guests <strong>in</strong> <strong>1998</strong>. One of <strong>the</strong> Company's strategies is to usefleet deployment and expanded it<strong>in</strong>eraries to <strong>in</strong>crease its passenger sourc<strong>in</strong>g outside North America. Dur<strong>in</strong>g <strong>1998</strong>, <strong>the</strong> Companyhired a senior vice president of <strong>in</strong>ternational sales and market<strong>in</strong>g to fur<strong>the</strong>r develop and expand its <strong>in</strong>ternational sales capability.The Company carries out its <strong>in</strong>ternational sales ef<strong>for</strong>t through sales offices located <strong>in</strong> London, Frankfurt, Oslo, Genoa and Paris,and a network of 38 <strong>in</strong>dependent <strong>in</strong>ternational representatives located throughout <strong>the</strong> world. The Company is also able to acceptbook<strong>in</strong>gs <strong>in</strong> various currencies.Yield ManagementThe Company cont<strong>in</strong>ues to develop more sophisticated pric<strong>in</strong>g and yield management programs to maximize its occupancy andrevenue by project<strong>in</strong>g <strong>the</strong> demand <strong>for</strong> its cruises <strong>in</strong> various passenger markets and, based on certa<strong>in</strong> variables, direct<strong>in</strong>g itsmarket<strong>in</strong>g ef<strong>for</strong>ts toward such markets. In addition to project<strong>in</strong>g demand, <strong>the</strong>se programs will cont<strong>in</strong>ue to enable <strong>the</strong> Company toreact quickly to changes <strong>in</strong> market conditions.
Technological DevelopmentThe Company's computer system, known as Enterprise 2000, is used by both brands and provides <strong>the</strong> foundation <strong>for</strong>: (i) asophisticated reservation system; (ii) sales tools to be used by <strong>the</strong> Company's comb<strong>in</strong>ed field sales <strong>for</strong>ce; and (iii) productivitytools <strong>for</strong> travel agents. The Company has developed a corporate shoreside <strong>in</strong>tranet as well as electronic ship to shorecommunication tools to improve its <strong>in</strong>ternal productivity. Both <strong>Royal</strong> <strong>Caribbean</strong> International and Celebrity <strong>Cruises</strong> haveextensive websites, provid<strong>in</strong>g access to millions of Internet users throughout <strong>the</strong> world.SALES, MARKETING AND PASSENGER SERVICESThe Company sells its cruise vacations almost exclusively through approximately 30,000 <strong>in</strong>dependent travel agencies worldwide.The Company ma<strong>in</strong>ta<strong>in</strong>s a large sales support organization <strong>in</strong>clud<strong>in</strong>g 100 district sales managers support<strong>in</strong>g both brands <strong>in</strong> NorthAmerica. The Company also utilizes a telemarket<strong>in</strong>g program <strong>in</strong> <strong>the</strong> United States and Canada called CruiseConnect to contactsmaller travel agencies to <strong>in</strong><strong>for</strong>m <strong>the</strong>m of new products and promotions. The Company believes that ma<strong>in</strong>ta<strong>in</strong><strong>in</strong>g personal contactwith travel agency owners, managers and front-l<strong>in</strong>e retail agents is crucial to reta<strong>in</strong><strong>in</strong>g travel agency loyalty. The Companyaugments this type of contact with an extensive program of sem<strong>in</strong>ars designed to familiarize travel agents with <strong>the</strong> cruise <strong>in</strong>dustryand <strong>the</strong> market<strong>in</strong>g of cruises.<strong>Royal</strong> <strong>Caribbean</strong> International pursues a comprehensive market<strong>in</strong>g program with an emphasis on consumer advertis<strong>in</strong>g us<strong>in</strong>g <strong>the</strong>tag l<strong>in</strong>e, "Like no vacation on earth(sm)." Through its advertis<strong>in</strong>g, <strong>Royal</strong> <strong>Caribbean</strong> International positions itself as a provider ofhigh quality, all-<strong>in</strong>clusive, cruise vacations offer<strong>in</strong>g a variety of dest<strong>in</strong>ations and, <strong>in</strong> <strong>the</strong> Company's op<strong>in</strong>ion, considerable value.<strong>Royal</strong> <strong>Caribbean</strong> International attempts to convey <strong>the</strong> message that <strong>the</strong> style and level of service of its shipboard cruiseexperience, toge<strong>the</strong>r with <strong>the</strong> dest<strong>in</strong>ations visited by its ships, is an attractive alternative to land-based vacations.Celebrity <strong>Cruises</strong> also pursues a comprehensive market<strong>in</strong>g program with an emphasis on consumer advertis<strong>in</strong>g us<strong>in</strong>g <strong>the</strong> tag l<strong>in</strong>e,"Exceed<strong>in</strong>g expectations(sm)". An advertis<strong>in</strong>g campaign utiliz<strong>in</strong>g national television, magaz<strong>in</strong>es and newspapers featurescommercials with <strong>the</strong> <strong>the</strong>me, "Simply <strong>the</strong> Best". The Company believes that Celebrity <strong>Cruises</strong> represents enhanced value to <strong>the</strong>premium segment based on elements such as its d<strong>in</strong><strong>in</strong>g experience, staff to guest ratio, cab<strong>in</strong> size, artwork, technology,AquaSpa(sm) packages and its modern fleet of ships, all of which have been built <strong>in</strong> <strong>the</strong> 1990's.OPERATIONSCruise Ships and It<strong>in</strong>erariesThe Company operates 16 ships under two brands and offers more than 110 different it<strong>in</strong>eraries rang<strong>in</strong>g from three to 21 nightsthat call on more than 175 dest<strong>in</strong>ations on six cont<strong>in</strong>ents. The follow<strong>in</strong>g table represents summary <strong>in</strong><strong>for</strong>mation concern<strong>in</strong>g <strong>the</strong>Company's ships and <strong>the</strong>ir areas of operation based on 1999 it<strong>in</strong>eraries (subject to change):YEAR VESSEL PASSENGERENTERED SERVICE CAPACITY(1) PRIMARY AREAS OF OPERATION--------------- ----------- ----------------------------ROYAL CARIBBEAN INTERNATIONAL:Voyager of <strong>the</strong> Seas(2)............. 1999 3,100 Western <strong>Caribbean</strong>Vision of <strong>the</strong> Seas................. <strong>1998</strong> 2,000 Panama Canal, Hawaii, AlaskaEnchantment of <strong>the</strong> Seas............ 1997 1,950 Eastern & Western <strong>Caribbean</strong>Rhapsody of <strong>the</strong> Seas............... 1997 2,000 Alaska, Sou<strong>the</strong>rn <strong>Caribbean</strong>,Mexico, Panama Canal, HawaiiGrandeur of <strong>the</strong> Seas............... 1996 1,950 Eastern <strong>Caribbean</strong>Splendour of <strong>the</strong> Seas.............. 1996 1,800 Europe, <strong>Caribbean</strong>,Canada/New EnglandLegend of <strong>the</strong> Seas................. 1995 1,800 Europe, Hawaii, PanamaCanal, Mexico, <strong>Royal</strong>JourneysMajesty of <strong>the</strong> Seas................ 1992 2,350 Western & Sou<strong>the</strong>rn <strong>Caribbean</strong>Monarch of <strong>the</strong> Seas................ 1991 2,350 Sou<strong>the</strong>rn <strong>Caribbean</strong>Vik<strong>in</strong>g Serenade(3)................. 1982/1991 1,500 Mexican BajaNordic Empress..................... 1990 1,600 Sou<strong>the</strong>rn <strong>Caribbean</strong>, BermudaSovereign of <strong>the</strong> Seas.............. 1988 2,250 BahamasCELEBRITY CRUISES:Mercury............................ 1997 1,850 Western <strong>Caribbean</strong>, Alaska,Panama CanalGalaxy............................. 1996 1,850 Sou<strong>the</strong>rn <strong>Caribbean</strong>, AlaskaCentury............................ 1995 1,750 Eastern & Western <strong>Caribbean</strong>,EuropeZenith............................. 1992 1,350 Panama Canal, BermudaHorizon............................ 1990 1,350 Sou<strong>the</strong>rn <strong>Caribbean</strong>, Bermuda(1) Based on double occupancy per cab<strong>in</strong>. (2) Voyager of <strong>the</strong> Seas is expected to enter service <strong>in</strong> November 1999.(3) Indicates year placed <strong>in</strong> service and year redeployed after conversion to expand capacity.
At year-end <strong>1998</strong>, <strong>the</strong> comb<strong>in</strong>ed fleets of <strong>Royal</strong> <strong>Caribbean</strong> International and Celebrity <strong>Cruises</strong> had an average age ofapproximately five years, which <strong>the</strong> Company believes is <strong>the</strong> youngest of any major cruise company.New VesselsThe Company has n<strong>in</strong>e ships on order. The planned passenger capacity and expected delivery dates of <strong>the</strong> ships on order are asfollows:EXPECTEDPASSENGERVESSEL DELIVERY DATES CAPACITY(1)------ ----------------- -----------ROYAL CARIBBEAN INTERNATIONAL:Eagle-classVoyager of <strong>the</strong> Seas(2)................................. 4th Quarter 1999 3,100Explorer of <strong>the</strong> Seas................................... 3rd Quarter 2000 3,100Adventure of <strong>the</strong> Seas.................................. 2nd Quarter 2002 3,100Vantage-classRadiance of <strong>the</strong> Seas................................... 1st Quarter 2001 2,100Brilliance of <strong>the</strong> Seas................................. 2nd Quarter 2002 2,100CELEBRITY CRUISES:Millennium-classMillennium............................................. 2nd Quarter 2000 2,000Unnamed................................................ 1st Quarter 2001 2,000Unnamed................................................ 3rd Quarter 2001 2,000Unnamed................................................ 2nd Quarter 2002 2,000(1) Based on double occupancy per cab<strong>in</strong>. (2) Included <strong>in</strong> table on prior page -- Cruise Ships and It<strong>in</strong>eraries.The Eagle-class vessels are be<strong>in</strong>g built <strong>in</strong> Turku, F<strong>in</strong>land by Kvaerner-Masa Yards which built two of <strong>the</strong> <strong>Royal</strong> <strong>Caribbean</strong>International ships. The Vantage-class vessels are be<strong>in</strong>g built <strong>in</strong> Papenburg, Germany by Meyer Werft, <strong>the</strong> same shipyard whichbuilt all of <strong>the</strong> Celebrity <strong>Cruises</strong> vessels. The Millennium-class vessels are be<strong>in</strong>g built by Chantiers de l'Atlantique <strong>in</strong> St. Nazaire,France, <strong>the</strong> same shipyard which built seven of <strong>the</strong> <strong>Royal</strong> <strong>Caribbean</strong> International ships. The aggregate contract price of <strong>the</strong> n<strong>in</strong>eships, which excludes capitalized <strong>in</strong>terest and o<strong>the</strong>r ancillary costs, is approximately $3.6 billion.Shipboard Activities and Shipboard RevenuesBoth brands offer modern fleets with a wide array of shipboard activities, services and amenities <strong>in</strong>clud<strong>in</strong>g swimm<strong>in</strong>g pools, sundecks, spa facilities which <strong>in</strong>clude massage and exercise facilities, beauty salons, gam<strong>in</strong>g facilities (which operate while <strong>the</strong> shipsare at sea), lounges, bars, Las Vegas-style enterta<strong>in</strong>ment, retail shopp<strong>in</strong>g, libraries, c<strong>in</strong>emas, conference centers and shoreexcursions at each port of call. While many shipboard activities are <strong>in</strong>cluded <strong>in</strong> <strong>the</strong> base price of a cruise, additional revenues arerealized from gam<strong>in</strong>g, <strong>the</strong> sale of alcoholic and o<strong>the</strong>r beverages, <strong>the</strong> sale of gift shop items, shore excursions, photography andspa services.Private Dest<strong>in</strong>ations<strong>Royal</strong> <strong>Caribbean</strong> International operates two private dest<strong>in</strong>ations: (i) CocoCay, an island owned by <strong>the</strong> Company and known asLittle Stirrup Cay located <strong>in</strong> <strong>the</strong> Bahamas; and (ii) Labadee, a secluded pen<strong>in</strong>sula leased by <strong>the</strong> Company and located on <strong>the</strong> northcoast of Haiti. The facilities at CocoCay and Labadee <strong>in</strong>clude, among o<strong>the</strong>rs, a variety of watersports activities, refreshment bars,artisan markets and picnic facilities.SeasonalityThe Company's revenues are moderately seasonal, due to variations <strong>in</strong> rates and occupancy percentages. See Note 14 to <strong>the</strong>Annual Consolidated F<strong>in</strong>ancial Statements.Guests and CapacityThe follow<strong>in</strong>g table sets <strong>for</strong>th <strong>the</strong> aggregate number of guests carried and <strong>the</strong> number of guests expressed as a percentage of totalcapacity <strong>for</strong> <strong>the</strong> Company's ships:FISCAL YEARS-------------------------------<strong>1998</strong> 1997 1996--------- --------- -------Number of Guests....................................... 1,841,152 1,465,450 973,602Percentage of Total Capacity.......................... 105.2% 104.2% 101.3%In accordance with cruise <strong>in</strong>dustry practice, total capacity is determ<strong>in</strong>ed based on double occupancy per cab<strong>in</strong> even though somecab<strong>in</strong>s accommodate three or four guests; accord<strong>in</strong>gly, a percentage <strong>in</strong> excess of 100% <strong>in</strong>dicates that more than two guestsoccupied some cab<strong>in</strong>s.
Cruise Pric<strong>in</strong>gThe Company's cruise prices <strong>in</strong>clude a wide variety of activities and amenities, <strong>in</strong>clud<strong>in</strong>g all meals and enterta<strong>in</strong>ment. Prices varydepend<strong>in</strong>g on <strong>the</strong> dest<strong>in</strong>ation, cruise length, cab<strong>in</strong> category selected and <strong>the</strong> time of year <strong>the</strong> voyage takes place. Additionally, <strong>the</strong>Company offers "Air add-ons" <strong>for</strong> guests that elect to utilize <strong>the</strong> Company's Air/Sea Program. Air add-ons vary by gateway anddest<strong>in</strong>ation and are available from cities <strong>in</strong> <strong>the</strong> United States, Canada and Europe. Fur<strong>the</strong>rmore, <strong>the</strong> Company sells tripcancellation <strong>in</strong>surance which provides guests with <strong>in</strong>surance coverage <strong>for</strong> trip cancellation, medical protection and baggageprotection.SUPPLIERSThe Company's largest purchases are <strong>for</strong> airfare, food and related items, advertis<strong>in</strong>g, diesel fuel, hotel supplies and productsrelated to passenger accommodations. Most of <strong>the</strong> supplies required by <strong>the</strong> Company are available from numerous sources atcompetitive prices. The Company's largest operat<strong>in</strong>g cost is air transportation <strong>for</strong> its guests. None of <strong>the</strong> Company's suppliersprovided goods or services represent<strong>in</strong>g <strong>in</strong> excess of 10% of <strong>the</strong> Company's revenues <strong>in</strong> <strong>1998</strong>.EMPLOYEESAs of December 31, <strong>1998</strong>, <strong>the</strong> Company and its subsidiaries employed approximately 2,300 full-time and 400 part-timeemployees <strong>in</strong> shoreside operations worldwide. The Company and its subsidiaries also employ approximately 18,300 crew andstaff <strong>for</strong> its vessels. As of December 31, <strong>1998</strong>, approximately 70% of <strong>the</strong> Company's shipboard employees are covered bycollective barga<strong>in</strong><strong>in</strong>g agreements. The Company believes that its relationship with its employees is good.TAXATION OF THE COMPANYThe follow<strong>in</strong>g discussion of <strong>the</strong> application to <strong>the</strong> Company and its subsidiaries of <strong>the</strong> United States federal <strong>in</strong>come tax laws isbased on <strong>the</strong> current provisions of <strong>the</strong> Internal Revenue Code of 1986, as amended, (<strong>the</strong> "Code"), proposed, temporary and f<strong>in</strong>alTreasury Department regulations, adm<strong>in</strong>istrative rul<strong>in</strong>gs and court decisions. All of <strong>the</strong> <strong>for</strong>ego<strong>in</strong>g are subject to change, and anychange <strong>the</strong>reto could affect <strong>the</strong> accuracy of this discussion.Application of Section 883 of <strong>the</strong> CodeThe Company and its wholly owned subsidiary, Celebrity <strong>Cruises</strong> Inc. ("CCI"), are <strong>for</strong>eign corporations that are engaged <strong>in</strong> atrade or bus<strong>in</strong>ess <strong>in</strong> <strong>the</strong> United States, and <strong>the</strong> Company's vessel-own<strong>in</strong>g subsidiaries are <strong>for</strong>eign corporations that, <strong>in</strong> many cases,depend<strong>in</strong>g upon <strong>the</strong> it<strong>in</strong>eraries of <strong>the</strong>ir vessels, receive <strong>in</strong>come from sources with<strong>in</strong> <strong>the</strong> United States. Under Section 883 of <strong>the</strong>Code, certa<strong>in</strong> <strong>for</strong>eign corporations are not subject to United States <strong>in</strong>come or branch profits tax on United States source <strong>in</strong>comederived from or <strong>in</strong>cidental to <strong>the</strong> <strong>in</strong>ternational operation of a ship or ships, <strong>in</strong>clud<strong>in</strong>g <strong>in</strong>come from <strong>the</strong> leas<strong>in</strong>g of such ships.ITEM 2. DESCRIPTION OF PROPERTYFor a description of <strong>the</strong> Company's cruise ships, see "Item 1. Description of Bus<strong>in</strong>ess -- Operations -- Cruise Ships andIt<strong>in</strong>eraries."The Company leases three office build<strong>in</strong>gs on <strong>the</strong> Port of Miami from Dade County, Florida. Two of <strong>the</strong> build<strong>in</strong>gs have <strong>in</strong>itialterms of 20 years which began <strong>in</strong> 1991 and 1995, respectively, and <strong>the</strong> third build<strong>in</strong>g has an <strong>in</strong>itial term of 17 years which began<strong>in</strong> <strong>1998</strong>. The Company also leases a build<strong>in</strong>g <strong>in</strong> Wichita, Kansas which is used as an additional reservation center with an <strong>in</strong>itialterm of ten years beg<strong>in</strong>n<strong>in</strong>g <strong>in</strong> 1997. The Company leases space <strong>for</strong> its <strong>in</strong>ternational sales offices <strong>in</strong> London, Oslo, Frankfurt,Genoa and Paris.<strong>Royal</strong> <strong>Caribbean</strong> International operates two private dest<strong>in</strong>ations, (i) CocoCay, an island owned by <strong>the</strong> Company and known asLittle Stirrup Cay located <strong>in</strong> <strong>the</strong> Bahamas and (ii) Labadee, a secluded pen<strong>in</strong>sula leased by <strong>the</strong> Company and located on <strong>the</strong> northcoast of Haiti.The Company owns one build<strong>in</strong>g <strong>in</strong> San Juan, Puerto Rico and leases a second build<strong>in</strong>g <strong>in</strong> St. Thomas, Virg<strong>in</strong> Islands <strong>for</strong> <strong>Royal</strong><strong>Caribbean</strong> International's Crown and Anchor Clubs. These facilities, which are exclusively <strong>for</strong> <strong>Royal</strong> <strong>Caribbean</strong> International'sguests, provide a rest stop where guests can check packages, get refreshments or make phone calls.The Company believes that its facilities are adequate <strong>for</strong> its current needs.ITEM 3. LEGAL PROCEEDINGSIn June <strong>1998</strong>, <strong>the</strong> Company entered <strong>in</strong>to a plea agreement with <strong>the</strong> U.S. Department of Justice settl<strong>in</strong>g previously filed chargesconta<strong>in</strong>ed <strong>in</strong> two <strong>in</strong>dictments pend<strong>in</strong>g <strong>in</strong> <strong>the</strong> U.S. District of Puerto Rico and <strong>the</strong> Sou<strong>the</strong>rn District of Florida, respectively. The<strong>in</strong>dictments, which perta<strong>in</strong>ed to events that occurred <strong>in</strong> 1994 and prior years, conta<strong>in</strong>ed a total of 11 felony counts related toimproper disposal of oil-contam<strong>in</strong>ated bilge water and attempts to conceal such activities from <strong>the</strong> U.S. Coast Guard. Under <strong>the</strong>plea agreement, <strong>the</strong> Company pled guilty to eight of <strong>the</strong> 11 counts and paid $9.0 million. The Company was also placed onprobation <strong>for</strong> up to five years and has implemented a Court supervised Environmental Compliance Plan. The U.S. government is
cont<strong>in</strong>u<strong>in</strong>g its <strong>in</strong>vestigation of <strong>the</strong> Company's bilge water and o<strong>the</strong>r waste disposal practices through federal grand juryproceed<strong>in</strong>gs <strong>in</strong> Anchorage, Alaska, Los Angeles, Cali<strong>for</strong>nia, Miami, Florida and New York, New York. In February 1999, <strong>the</strong>Company was <strong>in</strong>dicted by <strong>the</strong> grand jury <strong>in</strong> Los Angeles on charges that it presented false oil record books <strong>for</strong> one of its vesselsto <strong>the</strong> U.S. Coast Guard three times dur<strong>in</strong>g 1994 and <strong>the</strong> Company has pled guilty to <strong>the</strong>se charges. Each of <strong>the</strong> three counts <strong>in</strong><strong>the</strong> <strong>in</strong>dictment carries a maximum f<strong>in</strong>e of $500,000, subject to <strong>in</strong>crease under certa<strong>in</strong> circumstances. Although <strong>the</strong> Company isnot able at this time to estimate <strong>the</strong> tim<strong>in</strong>g or impact of <strong>the</strong>se cont<strong>in</strong>u<strong>in</strong>g <strong>in</strong>vestigations, <strong>the</strong> Company may be subject to additionalcharges <strong>for</strong> violations of U.S. law.The Company is rout<strong>in</strong>ely <strong>in</strong>volved <strong>in</strong> o<strong>the</strong>r claims typical to <strong>the</strong> cruise <strong>in</strong>dustry. The majority of <strong>the</strong>se claims are covered by<strong>in</strong>surance. Management believes <strong>the</strong> outcome of such o<strong>the</strong>r claims which are not covered by <strong>in</strong>surance would not have a materialadverse effect upon <strong>the</strong> Company's f<strong>in</strong>ancial condition or results of operations.ITEM 9. MANAGEMENT'S DISCUSSION AND ANALYSIS OF FINANCIAL CONDITION AND RESULTSOF OPERATIONSCerta<strong>in</strong> statements under this caption "Management's Discussion and Analysis of F<strong>in</strong>ancial Condition and Results of Operations",may constitute "<strong>for</strong>ward-look<strong>in</strong>g statements" under <strong>the</strong> Private Securities Litigation Re<strong>for</strong>m Act of 1995. Such <strong>for</strong>ward-look<strong>in</strong>gstatements are not guarantees of future per<strong>for</strong>mance and <strong>in</strong>volve known and unknown risks, uncerta<strong>in</strong>ties and o<strong>the</strong>r factors,which may cause <strong>the</strong> actual results, per<strong>for</strong>mance or achievements to differ materially from <strong>the</strong> future results, per<strong>for</strong>mance orachievements expressed or implied <strong>in</strong> such <strong>for</strong>ward-look<strong>in</strong>g statements. Such factors <strong>in</strong>clude <strong>in</strong>ter alia general economic andbus<strong>in</strong>ess conditions, cruise <strong>in</strong>dustry competition, <strong>the</strong> impact of tax laws and regulations affect<strong>in</strong>g <strong>the</strong> Company and its pr<strong>in</strong>cipalshareholders, changes <strong>in</strong> o<strong>the</strong>r laws and regulations affect<strong>in</strong>g <strong>the</strong> Company, delivery schedule of new vessels, emergency shiprepairs, <strong>in</strong>cidents <strong>in</strong>volv<strong>in</strong>g cruise vessels at sea, changes <strong>in</strong> <strong>in</strong>terest rates, Year 2000 compliance and wea<strong>the</strong>r.GENERALSummary<strong>Royal</strong> <strong>Caribbean</strong> <strong>Cruises</strong> Ltd. (<strong>the</strong> "Company") reported improved revenues, operat<strong>in</strong>g <strong>in</strong>come, net <strong>in</strong>come and earn<strong>in</strong>gs pershare <strong>for</strong> <strong>the</strong> year ended December 31, <strong>1998</strong> as shown <strong>in</strong> <strong>the</strong> table below. The improvements were driven primarily by capacity<strong>in</strong>creases result<strong>in</strong>g from <strong>the</strong> acquisition of Celebrity Cruise L<strong>in</strong>es Inc. ("Celebrity") <strong>in</strong> July 1997, and additions to <strong>the</strong> <strong>Royal</strong><strong>Caribbean</strong> International brand as well as improved revenue per available lower berth ("Yield"). Net <strong>in</strong>come <strong>for</strong> <strong>1998</strong> <strong>in</strong>cluded a$9.0 million charge related to a plea agreement with <strong>the</strong> U.S. Department of Justice <strong>in</strong> <strong>the</strong> second quarter and a reduction <strong>in</strong>earn<strong>in</strong>gs of approximately $9.0 million related to <strong>the</strong> ground<strong>in</strong>g of Monarch of <strong>the</strong> Seas <strong>in</strong> <strong>the</strong> fourth quarter. Also <strong>in</strong>cluded <strong>in</strong> net<strong>in</strong>come <strong>for</strong> <strong>1998</strong> is a $31.0 million ga<strong>in</strong> on <strong>the</strong> sale of Song of America and a $32.0 million write-down of Vik<strong>in</strong>g Serenade toreflect its estimated fair market value. Net <strong>in</strong>come <strong>for</strong> 1997 <strong>in</strong>cluded an extraord<strong>in</strong>ary loss of $7.6 million result<strong>in</strong>g from <strong>the</strong> earlyext<strong>in</strong>guishment of debt as well as a ga<strong>in</strong> of $4.0 million from <strong>the</strong> sale of Sun Vik<strong>in</strong>g. Accord<strong>in</strong>gly, on a comparable basis, be<strong>for</strong>e<strong>the</strong>se items, earn<strong>in</strong>gs <strong>in</strong>creased to $349.8 million or $1.93 per share <strong>in</strong> <strong>1998</strong>, from $178.7 million or $1.17 per share <strong>in</strong> 1997.FOR THE YEAR ENDED DECEMBER 31,------------------------------------------<strong>1998</strong> 1997 1996------------ ------------ ------------(IN THOUSANDS, EXCEPT PER SHARE AMOUNTS)Revenues................................................... $2,636,291 $1,939,007 $1,357,325Operat<strong>in</strong>g Income........................................... 488,735 303,555 217,033Net Income................................................. 330,770 175,127 150,866Basic Earn<strong>in</strong>gs Per Share................................... $1.90 $1.17 $1.19Diluted Earn<strong>in</strong>gs Per Share................................. $1.83 $1.15 $1.17Selected Statistical In<strong>for</strong>mation<strong>1998</strong> 1997 1996---------- ---------- ----------Passengers Carried......................................... 1,841,152 1,465,450 973,602Passenger Cruise Days...................................... 11,607,906 8,759,651 6,055,068Occupancy Percentage...................................... 105.2% 104.2% 101.3%Fleet ExpansionThe Company's fleet expansion cont<strong>in</strong>ued <strong>in</strong> <strong>1998</strong> with <strong>the</strong> delivery of <strong>the</strong> last of <strong>the</strong> six Vision-class vessels <strong>in</strong> <strong>the</strong> <strong>Royal</strong><strong>Caribbean</strong> International fleet, Vision of <strong>the</strong> Seas, <strong>in</strong> April <strong>1998</strong>. With <strong>the</strong> delivery of <strong>the</strong>se six ships and <strong>the</strong> acquisition ofCelebrity <strong>in</strong> 1997, <strong>the</strong> Company's capacity has <strong>in</strong>creased approximately 119.3% from 14,228 berths at December 31, 1994 to31,200 at December 31, <strong>1998</strong>.
The Company has n<strong>in</strong>e ships on order. See table given earlier <strong>for</strong> details on capacity and delivery dates.The Eagle-class vessels will be <strong>the</strong> largest passenger cruise ships built to date. The Vantage-class vessels are a progression from<strong>Royal</strong> <strong>Caribbean</strong> International's Vision-class vessels, while <strong>the</strong> Millennium-class vessels are a progression from Celebrity<strong>Cruises</strong>' Century-class vessels.Between <strong>1998</strong> and 2002, <strong>the</strong> Company's year-end berth capacity is expected to <strong>in</strong>crease 64.4% from 31,200 to 51,300 berths.In May <strong>1998</strong>, <strong>the</strong> Company sold Song of America <strong>for</strong> $94.5 million and recognized a ga<strong>in</strong> on <strong>the</strong> sale of $31.0 million. TheCompany operated <strong>the</strong> vessel under a charter agreement until March 1999.RESULTS OF OPERATIONS:The follow<strong>in</strong>g table presents operat<strong>in</strong>g data as a percentage of revenues:FOR THE YEAR ENDEDDECEMBER 31,---------------------<strong>1998</strong> 1997 1996----- ----- -----Revenues.................................................... 100.0% 100.0% 100.0%Expenses:Operat<strong>in</strong>g................................................. 60.5 62.9 63.0Market<strong>in</strong>g, sell<strong>in</strong>g and adm<strong>in</strong>istrative..................... 13.6 14.0 14.3Depreciation and amortization............................. 7.4 7.4 6.7----- ----- -----Operat<strong>in</strong>g Income............................................ 18.5 15.7 16.0O<strong>the</strong>r Income (Expense)...................................... (6.0) (6.3) (4.9)----- ----- -----Income Be<strong>for</strong>e Extraord<strong>in</strong>ary Item............................ 12.5% 9.4% 11.1%===== ===== =====YEAR ENDED DECEMBER 31, <strong>1998</strong> COMPARED TO YEAR ENDED DECEMBER 31, 1997RevenuesRevenues <strong>in</strong>creased 36.0% to $2.6 billion compared to $1.9 billion <strong>in</strong> 1997. The <strong>in</strong>crease <strong>in</strong> revenues was primarily due to a31.2% <strong>in</strong>crease <strong>in</strong> capacity and a 3.6% <strong>in</strong>crease <strong>in</strong> Yield. The acquisition of Celebrity (which occurred <strong>in</strong> July 1997) accounted<strong>for</strong> approximately two-thirds of <strong>the</strong> capacity <strong>in</strong>crease, while additions to <strong>the</strong> <strong>Royal</strong> <strong>Caribbean</strong> International fleet accounted <strong>for</strong> <strong>the</strong>balance of <strong>the</strong> <strong>in</strong>crease. The <strong>in</strong>crease <strong>in</strong> Yield was due to an <strong>in</strong>crease <strong>in</strong> occupancy levels to 105.2% as compared to 104.2% <strong>in</strong>1997 as well as an <strong>in</strong>crease <strong>in</strong> cruise ticket per diems, partially offset by a reduction <strong>in</strong> shipboard revenue per diems. Thereduction <strong>in</strong> shipboard revenue per diems is due to <strong>the</strong> <strong>in</strong>clusion of Celebrity's results <strong>for</strong> <strong>the</strong> full year <strong>1998</strong> as compared to sixmonths <strong>in</strong> 1997. Celebrity derives a higher percentage of its shipboard revenue from concessionaires than does <strong>Royal</strong> <strong>Caribbean</strong>International, result<strong>in</strong>g <strong>in</strong> a dilutive effect on <strong>the</strong> per diem. Concessionaires pay a net commission to <strong>the</strong> Company which isrecorded as revenue, <strong>in</strong> contrast to <strong>in</strong>-house operations, where shipboard revenues and <strong>the</strong> related cost of sales are recorded on agross basis.ExpensesOperat<strong>in</strong>g expenses <strong>in</strong>creased 30.7% <strong>in</strong> <strong>1998</strong> to $1.6 billion as compared to $1.2 billion <strong>in</strong> 1997. The <strong>in</strong>crease <strong>in</strong> operat<strong>in</strong>gexpenses was primarily due to <strong>the</strong> <strong>in</strong>crease <strong>in</strong> capacity. Included <strong>in</strong> operat<strong>in</strong>g expenses is a $9.0 million charge related to <strong>the</strong> pleaagreement with <strong>the</strong> U.S. Department of Justice. As a percentage of revenues, operat<strong>in</strong>g expenses decreased 2.4% <strong>in</strong> <strong>1998</strong> due toimproved ticket pric<strong>in</strong>g as well as <strong>the</strong> <strong>in</strong>clusion of Celebrity results <strong>for</strong> <strong>the</strong> full year of <strong>1998</strong> versus six months of 1997.Celebrity's operat<strong>in</strong>g expenses as a percentage of revenues were lower than <strong>Royal</strong> <strong>Caribbean</strong> International's due to lowershipboard cost of sales as a result of <strong>the</strong> higher use of concessionaires onboard Celebrity vessels as discussed above.Market<strong>in</strong>g, sell<strong>in</strong>g and adm<strong>in</strong>istrative expenses <strong>in</strong>creased 31.9% <strong>in</strong> <strong>1998</strong> to $359.2 million from $272.4 million <strong>in</strong> 1997. The<strong>in</strong>crease was primarily due to <strong>the</strong> acquisition of Celebrity as well as higher advertis<strong>in</strong>g and staff<strong>in</strong>g costs. As a percentage ofrevenues, market<strong>in</strong>g, sell<strong>in</strong>g and adm<strong>in</strong>istrative expenses decreased to 13.6% <strong>in</strong> <strong>1998</strong> as a result of economies of scale.Depreciation and amortization <strong>in</strong>creased to $194.6 million <strong>in</strong> <strong>1998</strong> from $143.8 million <strong>in</strong> 1997. The <strong>in</strong>crease was primarily dueto <strong>the</strong> acquisition of Celebrity as well as additions to <strong>the</strong> <strong>Royal</strong> <strong>Caribbean</strong> International fleet.
O<strong>the</strong>r Income (Expense)Interest expense, net of capitalized <strong>in</strong>terest, <strong>in</strong>creased to $167.9 million <strong>in</strong> <strong>1998</strong> as compared to $128.5 million <strong>in</strong> 1997. The<strong>in</strong>crease is due to <strong>the</strong> <strong>in</strong>crease <strong>in</strong> <strong>the</strong> average debt level as a result of <strong>the</strong> Company's fleet expansion program as well as <strong>the</strong>acquisition of Celebrity <strong>in</strong> July 1997.Included <strong>in</strong> O<strong>the</strong>r <strong>in</strong>come (expense) <strong>in</strong> <strong>1998</strong> is a $31.0 million ga<strong>in</strong> from <strong>the</strong> sale of Song of America as well as a $32.0 millioncharge related to <strong>the</strong> write-down to fair market value of Vik<strong>in</strong>g Serenade. Based on <strong>the</strong> Company's strategic objective to ma<strong>in</strong>ta<strong>in</strong>a modernized fleet, <strong>the</strong> unique circumstances of this vessel and <strong>in</strong>dications of <strong>the</strong> current value of Vik<strong>in</strong>g Serenade, <strong>the</strong> Companyrecorded a write-down of <strong>the</strong> carry<strong>in</strong>g value to its current estimated fair market value. The Company cont<strong>in</strong>ues to operate anddepreciate <strong>the</strong> vessel which is classified as part of Property and Equipment on <strong>the</strong> balance sheet.On December 15, <strong>1998</strong>, Monarch of <strong>the</strong> Seas experienced significant damage to <strong>the</strong> ship's hull and equipment, result<strong>in</strong>g <strong>in</strong> <strong>the</strong>ship be<strong>in</strong>g out of service until mid-March 1999. The <strong>in</strong>cident resulted <strong>in</strong> a net reduction <strong>in</strong> earn<strong>in</strong>gs of approximately $9.0million, or $0.05 per share <strong>in</strong> <strong>the</strong> fourth quarter of <strong>1998</strong>. This reduction is comprised of lost revenue, net of related variableexpenses, of $5.2 million, and costs associated with repairs to <strong>the</strong> ship, passenger transportation and lodg<strong>in</strong>g, commissions andvarious o<strong>the</strong>r costs, net of estimated <strong>in</strong>surance recoveries, of $3.8 million. The costs of $3.8 million were <strong>in</strong>cluded <strong>in</strong> O<strong>the</strong>r<strong>in</strong>come (expense) <strong>for</strong> <strong>the</strong> quarter and year ended December 31, <strong>1998</strong>.Included <strong>in</strong> O<strong>the</strong>r <strong>in</strong>come (expense) <strong>in</strong> 1997 is a $4.0 million ga<strong>in</strong> from <strong>the</strong> sale of Sun Vik<strong>in</strong>g.Extraord<strong>in</strong>ary ItemIncluded <strong>in</strong> 1997 is an extraord<strong>in</strong>ary charge of $7.6 million or $0.05 per share related to <strong>the</strong> early ext<strong>in</strong>guishment of debt.YEAR ENDED DECEMBER 31, 1997 COMPARED TO YEAR ENDED DECEMBER 31, 1996RevenuesRevenues <strong>in</strong>creased 42.9% <strong>in</strong> 1997 to $1.9 billion compared to $1.4 billion <strong>in</strong> 1996 as a result of a 40.7% <strong>in</strong>crease <strong>in</strong> capacity aswell as an <strong>in</strong>crease <strong>in</strong> Yield. The acquisition of Celebrity contributed 22.1% of <strong>the</strong> capacity <strong>in</strong>crease while additions to <strong>the</strong> <strong>Royal</strong><strong>Caribbean</strong> International fleet accounted <strong>for</strong> 18.6% of <strong>the</strong> <strong>in</strong>crease. Yield <strong>for</strong> <strong>the</strong> year <strong>in</strong>creased 1.5% over 1996 as a result of an<strong>in</strong>crease <strong>in</strong> occupancy. Occupancy levels <strong>in</strong>creased to 104.2% <strong>in</strong> 1997 as compared to 101.3% <strong>in</strong> 1996.ExpensesOperat<strong>in</strong>g expenses <strong>in</strong>creased 42.7% to $1.2 billion <strong>in</strong> 1997 as compared to $854.5 million <strong>in</strong> 1996. This <strong>in</strong>crease <strong>in</strong> operat<strong>in</strong>gexpenses was primarily due to <strong>the</strong> 40.7% <strong>in</strong>crease <strong>in</strong> capacity and higher variable costs associated with <strong>the</strong> <strong>in</strong>creased occupancy.Market<strong>in</strong>g, sell<strong>in</strong>g and adm<strong>in</strong>istrative expenses <strong>in</strong>creased 39.9% <strong>in</strong> 1997 to $272.4 million versus $194.6 million <strong>in</strong> 1996. The<strong>in</strong>crease was primarily due to <strong>the</strong> acquisition of Celebrity, an <strong>in</strong>crease <strong>in</strong> staff<strong>in</strong>g and additional advertis<strong>in</strong>g costs. These expensesdecreased as a percentage of revenues <strong>in</strong> 1997 as a result of <strong>the</strong> economies of scale achieved with <strong>the</strong> <strong>in</strong>crease <strong>in</strong> capacity.Depreciation and amortization <strong>in</strong>creased to $143.8 million <strong>in</strong> 1997 from $91.2 million <strong>in</strong> 1996. The <strong>in</strong>crease was primarily due to<strong>the</strong> acquisition of Celebrity as well as additions to <strong>the</strong> <strong>Royal</strong> <strong>Caribbean</strong> International fleet.O<strong>the</strong>r Income (Expense)Interest expense, net of capitalized <strong>in</strong>terest, <strong>in</strong>creased to $128.5 million <strong>in</strong> 1997 from $76.5 million <strong>in</strong> 1996. The <strong>in</strong>crease was aresult of an <strong>in</strong>crease <strong>in</strong> <strong>the</strong> average debt level associated with <strong>the</strong> Company's fleet expansion program and from <strong>the</strong> acquisition ofCelebrity <strong>in</strong> July 1997.O<strong>the</strong>r <strong>in</strong>come (expense) <strong>in</strong> 1997 <strong>in</strong>cludes a ga<strong>in</strong> of $4.0 million from <strong>the</strong> sale of Sun Vik<strong>in</strong>g as compared to 1996 which <strong>in</strong>cludesa ga<strong>in</strong> of $10.3 million from <strong>the</strong> sale of Song of Norway.Extraord<strong>in</strong>ary ItemIn May 1997, <strong>the</strong> Company redeemed <strong>the</strong> rema<strong>in</strong><strong>in</strong>g $104.5 million of 11 3/8% Senior Subord<strong>in</strong>ated Notes and <strong>in</strong>curred anextraord<strong>in</strong>ary charge of $7.6 million, or $0.05 per share on <strong>the</strong> early ext<strong>in</strong>guishment of debt.LIQUIDITY AND CAPITAL RESOURCESSources and Uses of CashThe Company generated substantial cash flows result<strong>in</strong>g <strong>in</strong> net cash provided by operat<strong>in</strong>g activities of $526.9 million <strong>in</strong> <strong>1998</strong> ascompared to $434.1 million <strong>in</strong> 1997 and $299.5 million <strong>in</strong> 1996. The <strong>in</strong>crease was primarily due to higher net <strong>in</strong>come as well astim<strong>in</strong>g differences <strong>in</strong> cash payments relat<strong>in</strong>g to operat<strong>in</strong>g assets and liabilities.
In March <strong>1998</strong>, <strong>the</strong> Company issued $150.0 million of 6.75% Senior Notes due 2008 and $150.0 million of 7.25% SeniorDebentures due 2018. The net proceeds to <strong>the</strong> Company were approximately $296.1 million.In March <strong>1998</strong>, <strong>the</strong> Company issued 6,100,690 shares of common stock. The net proceeds to <strong>the</strong> Company were approximately$165.5 million. (See Note 7 -- Shareholders' Equity.)Dur<strong>in</strong>g <strong>the</strong> year ended December 31, <strong>1998</strong>, <strong>the</strong> Company's capital expenditures were approximately $557.0 million as comparedto $1.1 billion dur<strong>in</strong>g 1997 and $722.4 million dur<strong>in</strong>g 1996. The largest portion of capital expenditures related to <strong>the</strong> delivery ofVision of <strong>the</strong> Seas <strong>in</strong> <strong>1998</strong>, delivery of Rhapsody of <strong>the</strong> Seas, Enchantment of <strong>the</strong> Seas and Mercury <strong>in</strong> 1997, delivery ofSplendour of <strong>the</strong> Seas and Grandeur of <strong>the</strong> Seas <strong>in</strong> 1996, as well as progress payments <strong>for</strong> ships under construction dur<strong>in</strong>g <strong>1998</strong>,1997 and 1996. Also <strong>in</strong>cluded <strong>in</strong> capital expenditures are shoreside capital expenditures and costs <strong>for</strong> vessel refurbish<strong>in</strong>g toma<strong>in</strong>ta<strong>in</strong> consistent fleet standards.The Company received proceeds of $94.5 and $100.0 million from <strong>the</strong> sale of vessels dur<strong>in</strong>g <strong>1998</strong> and 1997, respectively.Capitalized <strong>in</strong>terest decreased to $15.0 million <strong>in</strong> <strong>1998</strong>, from $15.8 million <strong>in</strong> 1997 and $15.9 million <strong>in</strong> 1996. The decreasedur<strong>in</strong>g <strong>1998</strong> was due to a reduction <strong>in</strong> <strong>the</strong> level of construction-<strong>in</strong>-progress expenditures associated with <strong>the</strong> Company's fleetexpansion program.Dur<strong>in</strong>g <strong>1998</strong>, <strong>the</strong> Company paid quarterly cash dividends on its common stock total<strong>in</strong>g $55.2 million as well as quarterly cashdividends on its preferred stock, total<strong>in</strong>g $12.5 million. Dur<strong>in</strong>g 1997, <strong>the</strong> Company paid quarterly cash dividends total<strong>in</strong>g $40.8and $9.2 million on its common stock and preferred stock, respectively.The Company made pr<strong>in</strong>cipal payments total<strong>in</strong>g approximately $335.1 and $245.4 million under various term loans and capitalleases dur<strong>in</strong>g <strong>1998</strong> and 1997, respectively.Future CommitmentsThe Company currently has n<strong>in</strong>e ships on order <strong>for</strong> an additional capacity of 21,500 berths. The aggregate contract price of <strong>the</strong>n<strong>in</strong>e ships, which excludes capitalized <strong>in</strong>terest and o<strong>the</strong>r ancillary costs, is approximately $3.6 billion, of which <strong>the</strong> Companydeposited $144.6 million dur<strong>in</strong>g <strong>1998</strong> and $74.3 million dur<strong>in</strong>g 1997. Additional deposits are due prior to <strong>the</strong> dates of delivery of$237.4 million <strong>in</strong> 1999, $88.1 million <strong>in</strong> 2000 and $25.0 million <strong>in</strong> 2001. The Company anticipates that overall capitalexpenditures will be approximately $997, $1,196, and $1,368 million <strong>for</strong> 1999, 2000 and 2001, respectively.The Company has $2.5 billion of long-term debt of which $127.9 million is due dur<strong>in</strong>g <strong>the</strong> twelve month period end<strong>in</strong>gDecember 31, 1999. (See Note 6 -- Long-Term Debt.)In addition, <strong>the</strong> Company cont<strong>in</strong>uously considers potential acquisitions, strategic alliances and adjustments to its fleetcomposition, <strong>in</strong>clud<strong>in</strong>g <strong>the</strong> acquisition or disposition of vessels. If any such acquisitions, strategic alliances and adjustments to itsfleet composition were to occur, <strong>the</strong>y would be f<strong>in</strong>anced through <strong>the</strong> issuance of additional shares of equity securities, by <strong>the</strong><strong>in</strong>currence of additional <strong>in</strong>debtedness or from cash flows from operations.Fund<strong>in</strong>g SourcesAs of December 31, <strong>1998</strong>, <strong>the</strong> Company's liquidity was $1.2 billion consist<strong>in</strong>g of $172.9 million <strong>in</strong> cash and cash equivalents and$1.0 billion available under its $1.0 billion unsecured revolv<strong>in</strong>g credit facility (<strong>the</strong> "$1 Billion Revolv<strong>in</strong>g Credit Facility"). Thecapital expenditures and scheduled debt payments will be funded through a comb<strong>in</strong>ation of cash flows provided by operations,drawdowns under <strong>the</strong> $1 Billion Revolv<strong>in</strong>g Credit Facility, and sales of securities <strong>in</strong> private or public securities markets. Inaddition, <strong>the</strong> agreements related to <strong>the</strong> ships scheduled <strong>for</strong> delivery subsequent to 1999 require <strong>the</strong> shipyards to make availableexport f<strong>in</strong>anc<strong>in</strong>g <strong>for</strong> up to 80% of <strong>the</strong> contract price of <strong>the</strong> vessels.The Company's cash management practice is to utilize excess cash to reduce outstand<strong>in</strong>g balances on <strong>the</strong> $1 Billion Revolv<strong>in</strong>gCredit Facility, and to <strong>the</strong> extent <strong>the</strong> cash balances exceed <strong>the</strong> amounts drawn under <strong>the</strong> $1 Billion Revolv<strong>in</strong>g Credit Facility, <strong>the</strong>Company <strong>in</strong>vests <strong>in</strong> short-term securities.O<strong>the</strong>rThe Company enters <strong>in</strong>to <strong>in</strong>terest rate swap agreements to manage <strong>in</strong>terest costs as part of its liability risk management program.The differential <strong>in</strong> <strong>in</strong>terest rates to be paid or received under <strong>the</strong>se agreements is recognized <strong>in</strong> <strong>in</strong>come as part of <strong>in</strong>terest expenseover <strong>the</strong> life of <strong>the</strong> contracts. The objective of <strong>the</strong> program is to modify <strong>the</strong> Company's exposure to <strong>in</strong>terest rate movements. TheCompany cont<strong>in</strong>uously evaluates its debt portfolio, <strong>in</strong>clud<strong>in</strong>g its <strong>in</strong>terest rate swap agreements, and makes periodic adjustmentsto <strong>the</strong> mix of fixed rate and float<strong>in</strong>g rate debt based on its view of <strong>in</strong>terest rate movements. (See Note 12 -- F<strong>in</strong>ancialInstruments.)
Impact of Year 2000The "Year 2000 issue" is <strong>the</strong> result of computer programs that were written us<strong>in</strong>g two digits ra<strong>the</strong>r than four to def<strong>in</strong>e <strong>the</strong>applicable year. If <strong>the</strong> Company's computer programs with date-sensitive functions are not Year 2000 compliant, <strong>the</strong>y mayrecognize a date us<strong>in</strong>g "00" as <strong>the</strong> year 1900 ra<strong>the</strong>r than <strong>the</strong> year 2000. This could result <strong>in</strong> a system failure or miscalculationscaus<strong>in</strong>g disruptions to operations.RisksBased on its current assessment ef<strong>for</strong>ts, <strong>the</strong> Company does not believe that Year 2000 issues will have a material adverse effecton <strong>the</strong> results of its operations, liquidity or f<strong>in</strong>ancial condition. However, this assessment is dependent on <strong>the</strong> ability of third-partysuppliers and o<strong>the</strong>rs whose system failures potentially could have a significant impact on <strong>the</strong> Company's operations to be Year2000 compliant. For <strong>in</strong>stance, <strong>the</strong> operations of <strong>the</strong> Company could be impacted by disruptions <strong>in</strong> airl<strong>in</strong>es, port authorities, travelagents or o<strong>the</strong>rs <strong>in</strong> <strong>the</strong> transportation or sales distribution channels whose systems are not Year 2000 compliant. Although <strong>the</strong>Company cannot control <strong>the</strong> conduct of <strong>the</strong>se third parties, <strong>the</strong> Year 2000 Project is expected to reduce <strong>the</strong> Company's level ofuncerta<strong>in</strong>ty and <strong>the</strong> adverse effect that any such failures may have.CostsThe total cost associated with required modifications to become Year 2000 compliant are not expected to be material to <strong>the</strong>Company's f<strong>in</strong>ancial position.The Company estimates that it will <strong>in</strong>cur approximately $6.0 million <strong>in</strong> expense on ef<strong>for</strong>ts directly related to fix<strong>in</strong>g <strong>the</strong> Year 2000issue, as well as an additional $5.0 million of capital expenditures related to <strong>the</strong> accelerated replacement of non-compliantsystems. The Company has <strong>in</strong>curred approximately $2.0 million <strong>in</strong> expense s<strong>in</strong>ce January 1, <strong>1998</strong>, and spent an additional $2.0million <strong>for</strong> capital expenditures related to <strong>the</strong> accelerated replacement of non-compliant systems. Estimated costs do not <strong>in</strong>cludecosts that may be <strong>in</strong>curred by <strong>the</strong> Company as a result of <strong>the</strong> failure of any third parties to become Year 2000 compliant or coststo implement any cont<strong>in</strong>gency plans.ITEM 9A. QUANTITATIVE AND QUALITATIVE DISCLOSURES ABOUT MARKET RISKGeneralThe Company is exposed to market risks attributable to changes <strong>in</strong> <strong>in</strong>terest rates, currency exchange rates and commodity prices.The Company enters <strong>in</strong>to various derivative transactions to manage a portion of <strong>the</strong>se exposures to market risk pursuant to <strong>the</strong>Company's hedg<strong>in</strong>g practices and policies. The impacts of <strong>the</strong>se hedg<strong>in</strong>g <strong>in</strong>struments are offset by correspond<strong>in</strong>g changes <strong>in</strong> <strong>the</strong>underly<strong>in</strong>g exposures be<strong>in</strong>g hedged. The Company achieves this by closely match<strong>in</strong>g <strong>the</strong> amount, term and conditions of <strong>the</strong>derivative <strong>in</strong>strument with <strong>the</strong> underly<strong>in</strong>g risk be<strong>in</strong>g hedged. The Company does not hold or issue derivative f<strong>in</strong>ancial<strong>in</strong>struments <strong>for</strong> trad<strong>in</strong>g or o<strong>the</strong>r speculative purposes. Derivative positions are monitored us<strong>in</strong>g techniques <strong>in</strong>clud<strong>in</strong>g marketvaluations and sensitivity analysis. See Notes 2 and 12 to <strong>the</strong> Consolidated F<strong>in</strong>ancial Statements <strong>for</strong> a discussion of <strong>the</strong>Company's account<strong>in</strong>g policies <strong>for</strong> f<strong>in</strong>ancial <strong>in</strong>struments.Interest Rate RiskThe Company's exposure to market risk <strong>for</strong> changes <strong>in</strong> <strong>in</strong>terest rates relates to its long-term debt obligations. At December 31,<strong>1998</strong>, <strong>the</strong> fair value of <strong>the</strong> Company's long-term fixed rate debt was estimated at approximately $2,565.0 million us<strong>in</strong>g quotedmarket prices where available, or discounted cash flow analyses. Market risk associated with <strong>the</strong> Company's long-term debt is <strong>the</strong>potential <strong>in</strong>crease <strong>in</strong> fair value result<strong>in</strong>g from a decrease <strong>in</strong> <strong>in</strong>terest rates. The Company uses <strong>in</strong>terest rate swaps to modify itsexposure to <strong>in</strong>terest rate movements and manage its <strong>in</strong>terest expense. The Company's <strong>in</strong>terest rate swaps are primarily float<strong>in</strong>grate <strong>in</strong>struments that are tied to LIBOR. The fair value of <strong>the</strong> Company's <strong>in</strong>terest rate swaps was approximately $48.6 million atDecember 31, <strong>1998</strong>. A 10% decrease <strong>in</strong> assumed <strong>in</strong>terest rates would <strong>in</strong>crease <strong>the</strong> fair value of <strong>the</strong> Company's long-term debt byapproximately $73.8 million. This <strong>in</strong>crease would be partially offset by an <strong>in</strong>crease <strong>in</strong> <strong>the</strong> fair value of <strong>the</strong> Company's <strong>in</strong>terest rateswaps of $18.6 million.
ROYAL CARIBBEAN CRUISES LTD.CONSOLIDATED STATEMENTS OF OPERATIONS(IN THOUSANDS, EXCEPT PER SHARE AMOUNTS)YEAR ENDED DECEMBER 31,------------------------------------<strong>1998</strong> 1997 1996---------- ---------- ----------Revenues................................................... $2,636,291 $1,939,007 $1,357,325---------- ---------- ----------ExpensesOperat<strong>in</strong>g................................................ 1,593,728 1,219,268 854,478Market<strong>in</strong>g, sell<strong>in</strong>g and adm<strong>in</strong>istrative.................... 359,214 272,368 194,629Depreciation and amortization............................ 194,614 143,816 91,185---------- ---------- ----------2,147,556 1,635,452 1,140,292---------- ---------- ----------Operat<strong>in</strong>g Income........................................... 488,735 303,555 217,033---------- ---------- ----------O<strong>the</strong>r Income (Expense)Interest <strong>in</strong>come.......................................... 15,912 4,666 2,278Interest expense, net of capitalized <strong>in</strong>terest............ (167,869) (128,531) (76,540)O<strong>the</strong>r <strong>in</strong>come (expense)................................... (6,008) 2,995 8,095---------- ---------- ----------(157,965) (120,870) (66,167)---------- ---------- ----------Income Be<strong>for</strong>e Extraord<strong>in</strong>ary Item........................... 330,770 182,685 150,866Extraord<strong>in</strong>ary Item......................................... -- (7,558) ------------ ---------- ----------Net Income................................................. $ 330,770 $ 175,127 $ 150,866========== ========== ==========Basic Earn<strong>in</strong>gs Per ShareIncome be<strong>for</strong>e extraord<strong>in</strong>ary item......................... $ 1.90 $ 1.22 $ 1.19Extraord<strong>in</strong>ary item....................................... -- (0.05) ------------ ---------- ----------Net <strong>in</strong>come............................................... $ 1.90 $ 1.17 $ 1.19========== ========== ==========Diluted Earn<strong>in</strong>gs Per ShareIncome be<strong>for</strong>e extraord<strong>in</strong>ary item......................... $ 1.83 $ 1.20 $ 1.17Extraord<strong>in</strong>ary item....................................... -- (0.05) ------------ ---------- ----------Net, <strong>in</strong>come.............................................. $ 1.83 $ 1.15 $ 1.17========== ========== ==========(Please note that <strong>the</strong> preferred dividend is $12,500K <strong>in</strong> <strong>1998</strong> and $9,200K <strong>in</strong> 1997. Subtract<strong>in</strong>g <strong>the</strong>se amounts from <strong>the</strong> NetIncome shown above results <strong>in</strong> Net Income Available to Common Shareholders.)
ROYAL CARIBBEAN CRUISES LTD.CONSOLIDATED BALANCE SHEETS(IN THOUSANDS EXCEPT SHARE AMOUNTS)<strong>1998</strong> 1997---------- ----------ASSETSCurrent AssetsCash and cash equivalents................................. $ 172,921 $ 110,793Trade and o<strong>the</strong>r receivables, net.......................... 36,532 22,628Inventories............................................... 31,834 37,274Prepaid expenses.......................................... 45,044 40,450---------- ----------Total current assets.............................. 286,331 211,145Property and Equipment -- at cost less accumulateddepreciation and amortization............................. 5,073,008 4,785,291Goodwill -- less accumulated amortization of $107,365 and$96,952, respectively..................................... 309,801 320,214O<strong>the</strong>r Assets................................................ 16,936 23,098---------- ----------$5,686,076 $5,339,748========== ==========LIABILITIES AND SHAREHOLDERS' EQUITYCurrent LiabilitiesCurrent portion of long-term debt......................... $ 127,919 $ 141,013Accounts payable.......................................... 115,833 108,474Accrued liabilities....................................... 243,477 210,454Customer deposits......................................... 402,926 429,403---------- ----------Total current liabilities......................... 890,155 889,344Long-Term Debt.............................................. 2,341,163 2,431,683Commitments and Cont<strong>in</strong>gencies (Note 13)Shareholders' EquityPreferred stock ($.01 par value; 20,000,000 sharesauthorized; cumulative convertible preferred sharesissued and outstand<strong>in</strong>g, 3,450,000 shares stated atliquidation value)..................................... 172,500 172,500Common stock ($.01 par value; 500,000,000 sharesauthorized 168,945,222 and 162,128,974 sharesissued)................................................ 1,690 1,621Paid-<strong>in</strong> capital........................................... 1,361,796 1,188,304Reta<strong>in</strong>ed earn<strong>in</strong>gs......................................... 923,691 660,655Treasury stock (354,492 and 314,148 common shares atcost).................................................. (4,919) (4,359)---------- ----------Total shareholders' equity........................ 2,454,758 2,018,721---------- ----------$5,686,076 $5,339,748========== ==========The accompany<strong>in</strong>g notes are an <strong>in</strong>tegral part of <strong>the</strong>se f<strong>in</strong>ancial statements.
ROYAL CARIBBEAN CRUISES LTD. CONSOLIDATED STATEMENTS OF CASH FLOWS(IN THOUSANDS) <strong>1998</strong> 1997 1996-------- ----------- --------OPERATING ACTIVITIES:Net <strong>in</strong>come.................................................. $330,770 $ 175,127 $150,866Adjustments:Depreciation and amortization............................. 194,614 143,816 91,185Ga<strong>in</strong> on sale of assets.................................... (31,031) (4,000) (10,306)Write-down of vessel to fair value........................ 32,035 -- --Extraord<strong>in</strong>ary item........................................ -- 2,387 --Changes <strong>in</strong> operat<strong>in</strong>g assets and liabilities:(Increase) decrease <strong>in</strong> trade and o<strong>the</strong>r receivables, net... (13,904) 145 (3,364)Decrease (<strong>in</strong>crease) <strong>in</strong> <strong>in</strong>ventories........................ 5,440 (1,885) (5,835)(Increase) <strong>in</strong> prepaid expenses............................ (3,600) (6,206) (7,065)Increase (decrease) <strong>in</strong> accounts payable................... 7,359 2,010 (2,437)Increase <strong>in</strong> accrued liabilities........................... 27,722 31,299 22,451(Decrease) <strong>in</strong>crease <strong>in</strong> customer deposits.................. (26,477) 89,896 61,408O<strong>the</strong>r, net................................................ 3,930 1,532 2,611-------- ----------- --------Net cash provided by operat<strong>in</strong>g activities......... 526,858 434,121 299,514-------- ----------- --------INVESTING ACTIVITIES:Purchase of property and equipment.......................... (556,953) (1,106,214) (722,389)Proceeds from sale of assets................................ 94,500 99,966 40,000Acquisition of Celebrity Cruise L<strong>in</strong>es Inc., net of cash,cash equivalents and short-term <strong>in</strong>vestments acquired...... -- (152,423) --O<strong>the</strong>r, net.................................................. 247 (11,802) (6,039)-------- ----------- --------Net cash used <strong>in</strong> <strong>in</strong>vest<strong>in</strong>g activities............. (462,206) (1,170,473) (688,428)-------- ----------- --------FINANCING ACTIVITIES:Proceeds from issuance of long-term debt.................... 296,141 695,189 452,668Repayment of long-term debt................................. (395,144) (367,353) (22,025)Dividends................................................... (67,734) (49,984) (34,384)Proceeds from issuance of common stock...................... 165,532 364,631 --Proceeds from issuance of preferred stock................... -- 167,030 --O<strong>the</strong>r, net.................................................. (1,319) (2,787) 1,818-------- ----------- --------Net cash (used <strong>in</strong>) provided by f<strong>in</strong>anc<strong>in</strong>gactivities...................................... (2,524) 806,726 398,077-------- ----------- --------Net <strong>in</strong>crease <strong>in</strong> cash and cash equivalents................... 62,128 70,374 9,163Cash and cash equivalents, beg<strong>in</strong>n<strong>in</strong>g of year................ 110,793 40,419 31,256-------- ----------- --------Cash and cash equivalents, end of year...................... $172,921 $ 110,793 $ 40,419======== =========== ========SUPPLEMENTAL DISCLOSUREInterest paid, net of amount capitalized.................... $170,278 $ 127,457 $ 65,110======== =========== ========Capital stock issued <strong>for</strong> acquisition........................ $ -- $ 270,000 $ --======== =========== ========
ROYAL CARIBBEAN CRUISES LTD.NOTES TO THE CONSOLIDATED FINANCIAL STATEMENTSNOTE 1. GENERALDescription of Bus<strong>in</strong>ess<strong>Royal</strong> <strong>Caribbean</strong> <strong>Cruises</strong> Ltd., a Liberian corporation, and its subsidiaries (<strong>the</strong> "Company"), is a global cruise company. In July1997, <strong>the</strong> Company acquired 100% of <strong>the</strong> outstand<strong>in</strong>g stock of Celebrity Cruise L<strong>in</strong>es Inc. ("Celebrity") (See Note 4 --Acquisition). The Company operates two cruise brands, <strong>Royal</strong> <strong>Caribbean</strong> International, which operates operates 12 cruise ships(one of which has been sold and will operate under a charter agreement until March 1999), and Celebrity <strong>Cruises</strong>, which operatesfive cruise ships. The Company's ships call on dest<strong>in</strong>ations <strong>in</strong> Alaska, <strong>the</strong> Bahamas, Bermuda, <strong>the</strong> <strong>Caribbean</strong>, Canada, Europe,Hawaii, Mexico, New England, <strong>the</strong> Panama Canal and Scand<strong>in</strong>avia.Basis <strong>for</strong> Preparation of Consolidated F<strong>in</strong>ancial StatementsThe consolidated f<strong>in</strong>ancial statements are prepared <strong>in</strong> accordance with U.S. generally accepted account<strong>in</strong>g pr<strong>in</strong>ciples and arepresented <strong>in</strong> U.S. dollars. Management estimates are required <strong>for</strong> <strong>the</strong> preparation of f<strong>in</strong>ancial statements <strong>in</strong> accordance withgenerally accepted account<strong>in</strong>g pr<strong>in</strong>ciples. Actual results could differ from <strong>the</strong>se estimates. All significant <strong>in</strong>tercompany accountsand transactions are elim<strong>in</strong>ated <strong>in</strong> consolidation.NOTE 2. SUMMARY OF SIGNIFICANT ACCOUNTING POLICIESCruise Revenues and ExpensesDeposits received on sales of passenger cruises are recorded as customer deposits and are recognized, toge<strong>the</strong>r with revenuesfrom shipboard activities and all associated direct costs of a voyage, upon completion of voyages with durations of 10 days orless and on a pro rata basis <strong>for</strong> voyages <strong>in</strong> excess of 10 days. Certa<strong>in</strong> revenues and expenses <strong>for</strong> pro rata voyages are estimated.Cash and Cash EquivalentsCash and cash equivalents <strong>in</strong>clude cash and marketable securities with orig<strong>in</strong>al maturities of less than 90 days.InventoriesInventories consist of provisions, supplies, fuel and gift shop merchandise carried at <strong>the</strong> lower of cost (weighted-average) ormarket.Property and EquipmentProperty and equipment are stated at cost. Significant vessel refurbish<strong>in</strong>g costs are capitalized as additions to <strong>the</strong> vessel, whilecosts of repairs and ma<strong>in</strong>tenance are charged to expense as <strong>in</strong>curred. The Company capitalizes <strong>in</strong>terest as part of <strong>the</strong> cost ofconstruction. The Company reviews long-lived assets, identifiable <strong>in</strong>tangibles and goodwill and reserves <strong>for</strong> impairmentwhenever events or changes <strong>in</strong> circumstances <strong>in</strong>dicate, based on estimated future cash flows, <strong>the</strong> carry<strong>in</strong>g amount of <strong>the</strong> assetswill not be fully recoverable.Depreciation of property and equipment, which <strong>in</strong>cludes amortization of vessels under capital lease, is computed us<strong>in</strong>g <strong>the</strong>straight-l<strong>in</strong>e method over useful lives of primarily 30 years <strong>for</strong> vessels and three to 10 years <strong>for</strong> o<strong>the</strong>r property and equipment.(See Note 5 -- Property and Equipment.)GoodwillGoodwill represents <strong>the</strong> excess of cost over <strong>the</strong> fair value of net assets acquired and is be<strong>in</strong>g amortized over 40 years us<strong>in</strong>g <strong>the</strong>straight-l<strong>in</strong>e method.Advertis<strong>in</strong>g CostsAdvertis<strong>in</strong>g costs are expensed as <strong>in</strong>curred except those costs which result <strong>in</strong> tangible assets, such as brochures, are treated asprepaid supplies and charged to operations as consumed. Advertis<strong>in</strong>g expense consists of media advertis<strong>in</strong>g as well as brochure,production and direct mail costs. Media advertis<strong>in</strong>g was $76.7, $62.5 and $46.6 million, and brochure, production and direct mailcosts were $63.2, $33.7 and $29.2 million <strong>for</strong> <strong>the</strong> years <strong>1998</strong>, 1997 and 1996, respectively.Drydock<strong>in</strong>gDrydock<strong>in</strong>g costs are accrued evenly over <strong>the</strong> period to <strong>the</strong> next scheduled drydock<strong>in</strong>g and are <strong>in</strong>cluded <strong>in</strong> accrued liabilities.Segment Report<strong>in</strong>gThe Company adopted Statement of F<strong>in</strong>ancial Account<strong>in</strong>g Standards No. 131 -- Disclosures About Segments of an Enterpriseand Related In<strong>for</strong>mation <strong>for</strong> <strong>the</strong> year ended December 31, <strong>1998</strong>. Although <strong>the</strong> Company operates two brands, <strong>Royal</strong> <strong>Caribbean</strong>International and Celebrity <strong>Cruises</strong>, <strong>the</strong> brands have been aggregated as a s<strong>in</strong>gle operat<strong>in</strong>g segment based on <strong>the</strong> similarity of<strong>the</strong>ir economic characteristics as well as product and services provided.
In<strong>for</strong>mation about geographic areas is shown <strong>in</strong> <strong>the</strong> table below. Revenues are attributed to geographic areas based on <strong>the</strong> sourceof <strong>the</strong> customer.<strong>1998</strong> 1997 1996---- ---- ----Revenues:United States............................................... 84% 85% 85%All O<strong>the</strong>r Countries......................................... 16% 15% 15%NOTE 3. STOCK SPLITOn June 23, <strong>1998</strong>, <strong>the</strong> Company authorized a two-<strong>for</strong>-one split of its common stock effected <strong>in</strong> <strong>the</strong> <strong>for</strong>m of a stock dividend. Theadditional shares were distributed on July 31, <strong>1998</strong> to shareholders of record on July 10, <strong>1998</strong>. All share and per share<strong>in</strong><strong>for</strong>mation has been retroactively restated to reflect this stock split.NOTE 4. ACQUISITIONIn July 1997, <strong>the</strong> Company acquired all of <strong>the</strong> outstand<strong>in</strong>g stock of Celebrity, a provider of cruises to <strong>the</strong> North American market.The purchase price was $515.0 million, payable <strong>in</strong> cash of $245.0 million and 14,896,552 shares of <strong>the</strong> Company's commonstock. This acquisition has been accounted <strong>for</strong> under <strong>the</strong> purchase method, and <strong>the</strong> results of <strong>the</strong> operations of Celebrity havebeen <strong>in</strong>cluded <strong>in</strong> <strong>the</strong> consolidated f<strong>in</strong>ancial statements s<strong>in</strong>ce July 1, 1997. The total cost of <strong>the</strong> acquisition was allocated to <strong>the</strong>tangible assets acquired and liabilities assumed based on <strong>the</strong>ir respective fair values.The follow<strong>in</strong>g unaudited pro <strong>for</strong>ma <strong>in</strong><strong>for</strong>mation presents a summary of consolidated results of operations of <strong>the</strong> Company,<strong>in</strong>clud<strong>in</strong>g Celebrity, as if <strong>the</strong> acquisition had occurred January 1, 1996 (<strong>in</strong> thousands, except per share amounts).1997 1996---------- ----------Revenue..................................................... $2,196,571 $1,769,216Income be<strong>for</strong>e extraord<strong>in</strong>ary item............................ $ 174,406 $ 136,498Net <strong>in</strong>come.................................................. $ 166,848 $ 136,498Earn<strong>in</strong>gs per shareIncome be<strong>for</strong>e extraord<strong>in</strong>ary itemBasic.................................................. $ 1.10 $ 0.96Diluted................................................ $ 1.10 $ 0.95Net <strong>in</strong>comeBasic.................................................. $ 1.05 $ 0.96Diluted................................................ $ 1.05 $ 0.95The unaudited pro <strong>for</strong>ma results have been prepared <strong>for</strong> comparative purposes only and <strong>in</strong>clude certa<strong>in</strong> adjustments, such asadditional depreciation expense as a result of a step-up <strong>in</strong> <strong>the</strong> basis of fixed assets and <strong>in</strong>creased <strong>in</strong>terest expense on acquisitiondebt. They do not purport to be <strong>in</strong>dicative of <strong>the</strong> results which would actually have been achieved if this acquisition had beeneffected on <strong>the</strong> date <strong>in</strong>dicated or of those results which may be obta<strong>in</strong>ed <strong>in</strong> <strong>the</strong> future.NOTE 5. PROPERTY AND EQUIPMENTProperty and equipment consists of <strong>the</strong> follow<strong>in</strong>g (<strong>in</strong> thousands):<strong>1998</strong> 1997---------- ----------Land........................................................ $ 5,320 $ 5,320Vessels..................................................... 4,457,070 4,201,443Vessels under capital lease................................. 763,350 760,941Vessels under construction.................................. 285,243 160,771O<strong>the</strong>r....................................................... 170,290 139,281---------- ----------5,681,273 5,267,756Less -- accumulated depreciation and amortization........... (608,265) (482,465)---------- ----------$5,073,008 $4,785,291========== ==========Vessels under construction <strong>in</strong>cludes progress payments <strong>for</strong> <strong>the</strong> construction of new vessels as well as plann<strong>in</strong>g, design, <strong>in</strong>terest,commitment fees and o<strong>the</strong>r associated costs. The Company capitalized <strong>in</strong>terest costs of $15.0, $15.8 and $15.9 million <strong>for</strong> <strong>the</strong>
years <strong>1998</strong>, 1997 and 1996, respectively. Accumulated amortization related to vessels under capital lease was $67.9 and $45.8million at December 31, <strong>1998</strong> and 1997, respectively.In May <strong>1998</strong>, <strong>the</strong> Company sold Song of America <strong>for</strong> $94.5 million and recognized a ga<strong>in</strong> on <strong>the</strong> sale of $31.0 million which is<strong>in</strong>cluded <strong>in</strong> O<strong>the</strong>r <strong>in</strong>come (expense). In <strong>the</strong> second quarter of <strong>1998</strong> <strong>the</strong> Company <strong>in</strong>curred a $32.0 million charge related to <strong>the</strong>write-down to fair market value of Vik<strong>in</strong>g Serenade. Based on <strong>the</strong> Company's strategic objective to ma<strong>in</strong>ta<strong>in</strong> a modernized fleet,<strong>the</strong> unique circumstances of this vessel and <strong>in</strong>dications of <strong>the</strong> current value of Vik<strong>in</strong>g Serenade, <strong>the</strong> Company recorded a writedownof <strong>the</strong> carry<strong>in</strong>g value to its current estimated fair market value which is <strong>in</strong>cluded <strong>in</strong> O<strong>the</strong>r <strong>in</strong>come (expense). The Companycont<strong>in</strong>ues to operate and depreciate <strong>the</strong> vessel which is classified as part of Property and Equipment on <strong>the</strong> balance sheet.In October 1997, <strong>the</strong> Company sold Sun Vik<strong>in</strong>g <strong>for</strong> $30.0 million and recognized a ga<strong>in</strong> on <strong>the</strong> sale of $4.0 million. In September1997, <strong>the</strong> Company sold Meridian. The sale price was $62.1 million and <strong>the</strong>re was no ga<strong>in</strong> or loss recognized <strong>in</strong> <strong>the</strong> transaction.In October 1996, <strong>the</strong> Company sold Song of Norway <strong>for</strong> $40.0 million and recognized a ga<strong>in</strong> on <strong>the</strong> sale of $10.3 million. TheCompany has recorded <strong>the</strong> ga<strong>in</strong>s <strong>in</strong> O<strong>the</strong>r <strong>in</strong>come (expense).NOTE 6. LONG-TERM DEBTLong-term debt consists of <strong>the</strong> follow<strong>in</strong>g (<strong>in</strong> thousands):<strong>1998</strong> 1997---------- ----------$1 billion revolv<strong>in</strong>g credit facility, LIBOR plus 0.30%<strong>in</strong>terest rate on balances outstand<strong>in</strong>g, 0.15% facility fee,due 2003.................................................. $ -- $ 60,000Senior Notes and Senior Debentures bear<strong>in</strong>g <strong>in</strong>terest at ratesrang<strong>in</strong>g from 6.75% to 8.25%, due 2002 through 2008, 2018and 2027.................................................. 1,390,006 1,090,443Unsecured fixed rate loan bear<strong>in</strong>g <strong>in</strong>terest at 8.0%, due2006...................................................... 185,277 211,075Fixed rate loans bear<strong>in</strong>g <strong>in</strong>terest at rates rang<strong>in</strong>g from 6.7%to 8.0%, due through 2005, secured by certa<strong>in</strong> Celebrityvessels................................................... 403,560 595,147Variable rate loans bear<strong>in</strong>g <strong>in</strong>terest at 6.5% through Nov.2001, LIBOR plus 0.45% through 2004, due through 2004,secured by certa<strong>in</strong> Celebrity vessels...................... 30,978 142,670Capital lease obligations, implicit <strong>in</strong>terest rates rang<strong>in</strong>gfrom 7.0% to 7.2%, due through 2011....................... 459,261 473,361---------- ----------2,469,082 2,572,696Less -- current portion..................................... (127,919) (141,013)---------- ----------Long-term portion........................................... $2,341,163 $2,431,683========== ==========Under <strong>the</strong> Company's $1.0 billion unsecured revolv<strong>in</strong>g credit facility (<strong>the</strong> "$1 Billion Revolv<strong>in</strong>g Credit Facility"), <strong>the</strong> contractual<strong>in</strong>terest rate on balances outstand<strong>in</strong>g varies with <strong>the</strong> Company's debt rat<strong>in</strong>g. In addition, <strong>the</strong> $1 Billion Revolv<strong>in</strong>g Credit Facilityconta<strong>in</strong>s a competitive bid provision which may allow <strong>the</strong> Company to borrow funds at less than <strong>the</strong> contractual <strong>in</strong>terest rate.In March <strong>1998</strong>, <strong>the</strong> Company issued $150.0 million of 6.75% Senior Notes due 2008 and $150.0 million of 7.25% SeniorDebentures due 2018. Net proceeds to <strong>the</strong> Company were approximately $296.1 million.In May 1997, <strong>the</strong> Company redeemed <strong>the</strong> rema<strong>in</strong><strong>in</strong>g $104.5 million of 11 3/8% Senior Subord<strong>in</strong>ated Notes and <strong>in</strong>curred anextraord<strong>in</strong>ary charge of approximately $7.6 million, or $0.05 per share on <strong>the</strong> early ext<strong>in</strong>guishment of debt.The Senior Notes and Senior Debentures are unsecured and are not redeemable prior to maturity.The Company entered <strong>in</strong>to a $264.0 million capital lease to f<strong>in</strong>ance Splendour of <strong>the</strong> Seas and a $260.0 million capital lease tof<strong>in</strong>ance Legend of <strong>the</strong> Seas <strong>in</strong> 1996 and 1995, respectively. The capital leases each have semi-annual payments of $12.0 millionover 15 years with f<strong>in</strong>al payments of $99.0 and $97.5 million, respectively.
The Company's debt agreements conta<strong>in</strong> covenants that require <strong>the</strong> Company, among o<strong>the</strong>r th<strong>in</strong>gs, to ma<strong>in</strong>ta<strong>in</strong> m<strong>in</strong>imum liquidityamounts, net worth and fixed charge coverage ratios and limit debt to capital ratios. The Company is <strong>in</strong> compliance with allcovenants as of December 31, <strong>1998</strong>. Follow<strong>in</strong>g is a schedule of pr<strong>in</strong>cipal repayments on long-term debt (<strong>in</strong> thousands):YEAR----1999........................................................ $ 127,9192000........................................................ 128,0862001........................................................ 109,9822002........................................................ 259,8532003........................................................ 110,948Thereafter.................................................. 1,732,294----------$2,469,082==========NOTE 9. RETIREMENT PLANSThe Company ma<strong>in</strong>ta<strong>in</strong>s a def<strong>in</strong>ed contribution pension plan cover<strong>in</strong>g all of its full-time shoreside employees who havecompleted <strong>the</strong> m<strong>in</strong>imum period of cont<strong>in</strong>uous service. Annual contributions to <strong>the</strong> plan are based on fixed percentages ofparticipants' salaries and years of service, not to exceed certa<strong>in</strong> maximums, as def<strong>in</strong>ed <strong>in</strong> <strong>the</strong> plan. Pension cost was $6.9, $4.9and $4.3 million <strong>for</strong> <strong>the</strong> years <strong>1998</strong>, 1997 and 1996, respectively.NOTE 10. OPERATING LEASESThe Company is obligated under noncancelable operat<strong>in</strong>g leases <strong>for</strong> various facilities, primarily office and warehouse space. Asof December 31, <strong>1998</strong>, future m<strong>in</strong>imum lease payments under noncancelable operat<strong>in</strong>g leases were as follows (<strong>in</strong> thousands):YEAR----1999........................................................ $ 5,1342000........................................................ 4,4442001........................................................ 4,2052002........................................................ 4,1102003........................................................ 4,023Thereafter.................................................. 26,017-------$47,933=======Total rent expense <strong>for</strong> all operat<strong>in</strong>g leases amounted to $6.9, $5.7 and $4.9 million <strong>for</strong> <strong>the</strong> years <strong>1998</strong>, 1997 and 1996,respectively.NOTE 11. INCOME TAXESThe Company and <strong>the</strong> majority of its subsidiaries are not subject to U.S. corporate <strong>in</strong>come tax on <strong>in</strong>come generated from <strong>the</strong><strong>in</strong>ternational operation of ships pursuant to Section 883 of <strong>the</strong> Internal Revenue Code, provided that <strong>the</strong>y meet certa<strong>in</strong> testsrelated to country of <strong>in</strong>corporation and composition of shareholders. The Company believes that it and a majority of itssubsidiaries meet <strong>the</strong>se tests. Income tax expense related to <strong>the</strong> Company's rema<strong>in</strong><strong>in</strong>g subsidiaries is not significant.NOTE 13. COMMITMENTS AND CONTINGENCIESThe Company has n<strong>in</strong>e ships on order. Three are Eagle-class vessels designated <strong>for</strong> <strong>the</strong> <strong>Royal</strong> <strong>Caribbean</strong> International fleet, <strong>the</strong>first of which, Voyager of <strong>the</strong> Seas is scheduled <strong>for</strong> delivery <strong>in</strong> <strong>the</strong> fourth quarter of 1999, followed by two sister vesselsscheduled <strong>for</strong> delivery <strong>in</strong> <strong>the</strong> third quarter of 2000 and second quarter of 2002. The Company also has two Vantage-class vesseldesignated <strong>for</strong> <strong>the</strong> <strong>Royal</strong> <strong>Caribbean</strong> International fleet scheduled <strong>for</strong> delivery <strong>in</strong> <strong>the</strong> first quarter of 2001 and second quarter of2002 and four Millennium-class vessels designated <strong>for</strong> <strong>the</strong> Celebrity <strong>Cruises</strong> fleet, scheduled <strong>for</strong> delivery <strong>in</strong> <strong>the</strong> second quarter of2000, first quarter of 2001, third quarter of 2001 and second quarter of 2002. The aggregate contract price of <strong>the</strong> n<strong>in</strong>e ships,which excludes capitalized <strong>in</strong>terest and o<strong>the</strong>r ancillary costs, is approximately $3.6 billion of which <strong>the</strong> Company deposited$144.6 million dur<strong>in</strong>g <strong>1998</strong> and $74.3 million dur<strong>in</strong>g 1997. Additional deposits are due prior to <strong>the</strong> dates of delivery of $237.4million <strong>in</strong> 1999, $88.1 million <strong>in</strong> 2000 and $25.0 million <strong>in</strong> 2001.
NOTE 14. QUARTERLY DATA (UNAUDITED)FIRST QUARTER SECOND QUARTER THIRD QUARTER FOURTH QUARTER------------------- ------------------- ------------------- -------------------<strong>1998</strong> 1997 <strong>1998</strong> 1997 <strong>1998</strong> 1997 <strong>1998</strong> 1997-------- -------- -------- -------- -------- -------- -------- --------(IN THOUSANDS, EXCEPT PER SHARE AMOUNTS)Revenues.............................. $659,777 $394,590 $656,456 $403,467 $744,910 $612,542 $575,148 $528,408Operat<strong>in</strong>g Income...................... 119,461 60,637 121,533 67,397 183,592 116,911 64,149 58,610Income Be<strong>for</strong>e Extraord<strong>in</strong>ary Item...... 77,537 38,481 79,770 45,918 150,038 75,931 23,425 22,355Extraord<strong>in</strong>ary Item.................... -- -- -- (7,558) -- -- -- ---------- -------- -------- -------- -------- -------- -------- --------Net Income............................ $ 77,537 $ 38,481 $ 79,770 $ 38,360 $150,038 $ 75,931 $ 23,425 $ 22,355======== ======== ======== ======== ======== ======== ======== ========Basic Earn<strong>in</strong>gs Per Share(1):Income be<strong>for</strong>e extraord<strong>in</strong>ary item.... $ 0.45 $ 0.29 $ 0.45 $ 0.33 $ 0.87 $ 0.50 $ 0.12 $ 0.12Extraord<strong>in</strong>ary item.................. -- -- -- (0.05) -- -- -- ---------- -------- -------- -------- -------- -------- -------- --------Net <strong>in</strong>come.......................... $ 0.45 $ 0.29 $ 0.45 $ 0.28 $ 0.87 $ 0.50 $ 0.12 $ 0.12======== ======== ======== ======== ======== ======== ======== ========Diluted Earn<strong>in</strong>gs Per Share(1):Income be<strong>for</strong>e extraord<strong>in</strong>ary item.... $ 0.44 $ 0.29 $ 0.44 $ 0.32 $ 0.82 $ 0.48 $ 0.12 $ 0.12Extraord<strong>in</strong>ary item.................. -- -- -- (0.05) -- -- -- ---------- -------- -------- -------- -------- -------- -------- --------Net <strong>in</strong>come.......................... $ 0.44 $ 0.29 $ 0.44 $ 0.27 $ 0.82 $ 0.48 $ 0.12 $ 0.12======== ======== ======== ======== ======== ======== ======== ========Dividends Declared Per Share.......... $ 0.08 $ 0.07 $ 0.08 $ 0.07 $ 0.09 $ 0.08 $ 0.09 $ 0.08======== ======== ======== ======== ======== ======== ======== ========
FORM 10-KSECURITIES AND EXCHANGE COMMISSIONWash<strong>in</strong>gton, DC 20549(Mark One)[X] ANNUAL REPORT PURSUANT TO SECTION 13 OR 15(d) OF THE SECURITIESEXCHANGE ACT OF 1934For <strong>the</strong> fiscal year ended November 30, <strong>1998</strong>OR[ ]TRANSITION REPORT PURSUANT TO SECTION 13 OR 15(d) OF THE SECURITIESEXCHANGE ACT OF 1934For <strong>the</strong> transition period from ______________ to ________________Commission file number 1-9610CARNIVAL CORPORATION(Exact name of registrant as specified <strong>in</strong> its charter)Republic of Panama 59-1562976(State or o<strong>the</strong>r jurisdiction of(I.R.S. Employer<strong>in</strong>corporation or organization)Identification No.)3655 N.W. 87th Avenue, Miami, Florida 33178-2428(Address of pr<strong>in</strong>cipal executive offices) (Zip Code)Registrant's telephone number, <strong>in</strong>clud<strong>in</strong>g area code (305) 599-2600Securities registered pursuant to Section 12(b) of <strong>the</strong> Act:Name of exchange onTitle of each classwhich registeredCommon StockNew York Stock($.01 par value) Exchange, Inc.
PART IItem 1. Bus<strong>in</strong>essA. GeneralCarnival Corporation was <strong>in</strong>corporated under <strong>the</strong> laws of <strong>the</strong> Republic of Panama <strong>in</strong> November 1974. Carnival Corporation,<strong>in</strong>clud<strong>in</strong>g its wholly and majority owned subsidiaries (referred to collectively as <strong>the</strong> "Company"), is <strong>the</strong> world's largest multiplenightcruise company based on <strong>the</strong> number of passengers carried, revenues generated and available capacity. The Company offersa broad range of lead<strong>in</strong>g cruise brands serv<strong>in</strong>g <strong>the</strong> contemporary cruise market through Carnival Cruise L<strong>in</strong>es ("Carnival"), <strong>the</strong>premium cruise market through Holland America L<strong>in</strong>e ("Holland America") and <strong>the</strong> luxury cruise market through Cunard L<strong>in</strong>e("Cunard"), Seabourn Cruise L<strong>in</strong>e ("Seabourn") and W<strong>in</strong>dstar <strong>Cruises</strong> ("W<strong>in</strong>dstar") (collectively <strong>the</strong> "Majority Owned CruiseOperations"). The Company also owns equity <strong>in</strong>terests <strong>in</strong> Costa Crociere S.p.A. ("Costa"), an Italian cruise company, andAirtours plc ("Airtours"), an <strong>in</strong>tegrated leisure travel group of companies which also operates cruise ships (collectively <strong>the</strong>"Affiliated Cruise Operations"). Costa and Airtours' Sun <strong>Cruises</strong> target <strong>the</strong> contemporary cruise market.A summary of <strong>the</strong> cruise operations of <strong>the</strong> Company and its affiliates is as follows:PercentageOwned byPrimaryCruise Carnival Number Passenger GeographicBrand Corporation of Ships Capacity(1) MarketMajority Owned CruiseOperations:Carnival 100% 13 24,404 North AmericaHolland America 100% 8 10,302 North AmericaW<strong>in</strong>dstar 100% 4 756 North AmericaCunard (2) 68% 5 3,380 WorldwideSeabourn (2) 68% 3 624 North America33 39,466Affiliated CruiseOperations:Costa 50%(3) 7 7,644 EuropeAirtours' Sun <strong>Cruises</strong> 26% 3 2,924 Europe10 10,56843 50,034(1) In accordance with cruise <strong>in</strong>dustry practice, all passenger capacities <strong>in</strong>dicated with<strong>in</strong> this document are calculated based ontwo passengers per cab<strong>in</strong> even though some cab<strong>in</strong>s can accommodate three or four passengers.(2) In May <strong>1998</strong>, <strong>the</strong> Company and a group of <strong>in</strong>vestors acquired <strong>the</strong> assets of Cunard, a cruise company operat<strong>in</strong>g five luxuryships, <strong>for</strong> $500 million, as adjusted. Simultaneous with <strong>the</strong> acquisition, Seabourn Cruise L<strong>in</strong>e Limited, a luxury cruise l<strong>in</strong>e <strong>in</strong>which <strong>the</strong> Company owned a 50% <strong>in</strong>terest, was comb<strong>in</strong>ed with Cunard. The Company now owns 68% of <strong>the</strong> comb<strong>in</strong>ed entity,which is named Cunard L<strong>in</strong>e Limited. See Note 13 to <strong>the</strong> F<strong>in</strong>ancial Statements as <strong>in</strong>cluded <strong>in</strong> Exhibit 13 to this Form 10-K.(3) The 50% equity <strong>in</strong>terest of Costa not owned by <strong>the</strong> Company is owned by Airtours. Includ<strong>in</strong>g <strong>the</strong> Company's <strong>in</strong>terest <strong>in</strong>Airtours, it beneficially owns 63% of Costa.Historically, <strong>the</strong> Company's cruise brands have been marketed primarily <strong>in</strong> North America. The Company began to globalize itscruise bus<strong>in</strong>ess by expand<strong>in</strong>g its markets <strong>in</strong>to Europe through <strong>the</strong> acquisition of its <strong>in</strong>terest <strong>in</strong> Airtours <strong>in</strong> April 1996, Costa <strong>in</strong>June 1997 and Cunard <strong>in</strong> May <strong>1998</strong>. Airtours, which is headquartered <strong>in</strong> Manchester, England, is <strong>the</strong> largest air <strong>in</strong>clusive touroperator <strong>in</strong> <strong>the</strong> world, sell<strong>in</strong>g packaged tours <strong>in</strong> <strong>the</strong> Austrian, British, Belgian, Dutch, French, German, Irish, Polish,Scand<strong>in</strong>avian, Swiss and North American markets. Additionally, it operates three cruise ships (a fourth ship is expected to enterservice <strong>in</strong> April 1999) under <strong>the</strong> Sun <strong>Cruises</strong> name. Costa, which is headquartered <strong>in</strong> Genoa, Italy, has sales offices <strong>in</strong> Argent<strong>in</strong>a,Brazil, England, Florida, France, Italy, Spa<strong>in</strong> and Switzerland and sells <strong>the</strong> majority of its cruises <strong>in</strong> Sou<strong>the</strong>rn Europe, primarily<strong>in</strong> Italy, France and Spa<strong>in</strong>. Cunard L<strong>in</strong>e Limited, which is headquartered <strong>in</strong> Miami, Florida, has Cunard and Seabourn salesoffices <strong>in</strong> Miami, New York City, England, Germany and Australia, and sells a substantial number of its cruises <strong>in</strong> Europe,primarily <strong>in</strong> <strong>the</strong> United K<strong>in</strong>gdom and Germany. The cruise markets <strong>in</strong> Europe are much smaller than <strong>the</strong> North American market.Industry-wide European cruise passengers carried <strong>in</strong> <strong>1998</strong> are estimated to be approximately 1.3 million compared toapproximately 5.4 million from North America.
The Company has signed agreements with two shipyards provid<strong>in</strong>g <strong>for</strong> <strong>the</strong> construction of additional cruise ships. A summary ofnew ship agreements <strong>for</strong> <strong>the</strong> Company's Majority Owned Cruise Operations is as follows:EXPECTEDSERVICEPASSENGERVESSEL DATE(1) CAPACITYCarnival:Carnival Triumph 7/99 2,758Carnival Victory 8/00 2,758Newbuild 4/01 2,100Carnival Conquest 12/02 2,758Carnival Glory 8/03 2,758Total Carnival 13,132(2)Holland America:Volendam 8/99 1,440Zaandam 3/00 1,440Newbuild 11/00 1,380Total Holland America 4,260Total 17,392(1) The expected service date is <strong>the</strong> date <strong>the</strong> vessel is expected to beg<strong>in</strong> revenue generat<strong>in</strong>g activities.(2) The Company also has options <strong>for</strong> <strong>the</strong> construction of two additional vessels each with a passenger capacity of 2,100. Noassurance can be given that <strong>the</strong> options to construct <strong>the</strong> vessels will be exercised.In addition to its cruise operations, <strong>the</strong> Company operates a tour bus<strong>in</strong>ess, through Holland America L<strong>in</strong>e-Westours Inc.("Holland America Westours"), which markets sightsee<strong>in</strong>g tours both separately and as a part of Holland America cruise/tourpackages. Holland America Westours operates 14 hotels <strong>in</strong> Alaska and <strong>the</strong> Canadian Yukon, two luxury dayboats offer<strong>in</strong>g toursto <strong>the</strong> glaciers of Alaska and <strong>the</strong> Yukon River, over 280 motor coaches used <strong>for</strong> sightsee<strong>in</strong>g and charters <strong>in</strong> <strong>the</strong> states ofWash<strong>in</strong>gton and Alaska and <strong>in</strong> <strong>the</strong> Canadian Rockies and 13 private domed rail cars which are run on <strong>the</strong> Alaska Railroadbetween Anchorage and Fairbanks.MANAGEMENT'S DISCUSSION AND ANALYSISRESULTS OF OPERATIONSThe Company earns its cruise revenues primarily from (i) <strong>the</strong> sale of passenger tickets, which <strong>in</strong>cludes accommodations, mealsand most shipboard activities, (ii) <strong>the</strong> sale of air transportation to and from <strong>the</strong> cruise ship and (iii) <strong>the</strong> sale of goods and serviceson board its cruise ships, such as cas<strong>in</strong>o gam<strong>in</strong>g, bar sales, gift shop sales and o<strong>the</strong>r related services. The Company also derivesrevenues from <strong>the</strong> tour and related operations of Holland America Westours.For selected segment and export sales <strong>in</strong><strong>for</strong>mation related to <strong>the</strong> Company's revenues, gross operat<strong>in</strong>g profit, operat<strong>in</strong>g <strong>in</strong>comeand o<strong>the</strong>r f<strong>in</strong>ancial <strong>in</strong><strong>for</strong>mation, see Note 10 <strong>in</strong> <strong>the</strong> accompany<strong>in</strong>g f<strong>in</strong>ancial statements. Operations data expressed as a percentageof total revenues and selected statistical <strong>in</strong><strong>for</strong>mation <strong>for</strong> <strong>the</strong> periods <strong>in</strong>dicated is as follows:YEARS ENDED NOVEMBER 30,<strong>1998</strong> 1997 1996REVENUES 100% 100% 100%COSTS AND EXPENSES:Operat<strong>in</strong>g expenses 54 54 56Sell<strong>in</strong>g and adm<strong>in</strong>istrative 12 12 12Depreciation and amortization 7 7 7OPERATING INCOME BEFORE INCOMEFROM AFFILIATED OPERATIONS 27 27 25INCOME FROM AFFILIATED OPERATIONS, NET 3 2 2OPERATING INCOME 30 29 27NET INCOME 28% 27% 26%SELECTED STATISTICAL INFORMATION(<strong>in</strong> thousands):Passengers carried 2,045 1,945 1,764Passenger cruise days (1) 13,009 11,908 10,583Occupancy percentage 106.3% 108.3% 107.6%(1) A passenger cruise day is one passenger sail<strong>in</strong>g <strong>for</strong> a period of one day. For example, one passenger sail<strong>in</strong>g on a one weekcruise is seven passenger cruise days.
GENERALThe growth <strong>in</strong> <strong>the</strong> Company's revenues dur<strong>in</strong>g <strong>the</strong> last three fiscal years has primarily been a function of <strong>the</strong> expansion of its fleetcapacity and, additionally <strong>in</strong> <strong>1998</strong>, its ability to obta<strong>in</strong> significantly higher net yields than <strong>in</strong> previous years.Fixed costs, <strong>in</strong>clud<strong>in</strong>g depreciation, fuel, <strong>in</strong>surance and crew costs, represent more than one-third of <strong>the</strong> Company's operat<strong>in</strong>gexpenses and do not change significantly <strong>in</strong> relation to changes <strong>in</strong> passenger loads and aggregate passenger ticket revenue.The Company's cruise and tour operations experience vary<strong>in</strong>g degrees of seasonality. The Company's revenue from <strong>the</strong> sale ofpassenger tickets <strong>for</strong> its cruise operations is moderately seasonal. Historically, demand <strong>for</strong> cruises has been greater dur<strong>in</strong>g <strong>the</strong>summer months. The Company's tour revenues are extremely seasonal with a majority of tour revenues generated dur<strong>in</strong>g <strong>the</strong> latespr<strong>in</strong>g and summer months <strong>in</strong> conjunction with <strong>the</strong> Alaska cruise season.The year over year percentage <strong>in</strong>crease <strong>in</strong> average passenger capacity <strong>for</strong> <strong>the</strong> Company's cruise brands, exclud<strong>in</strong>g <strong>the</strong> impact of<strong>the</strong> acquisition and consolidation of Cunard and Seabourn, is expected to be 13.7% dur<strong>in</strong>g fiscal 1999 as compared to fiscal <strong>1998</strong>.This <strong>in</strong>crease is primarily a result of <strong>the</strong> <strong>in</strong>troduction <strong>in</strong>to service of Carnival's Elation <strong>in</strong> March <strong>1998</strong> and Paradise <strong>in</strong> lateNovember <strong>1998</strong>, <strong>the</strong> expected <strong>in</strong>troduction <strong>in</strong>to service of <strong>the</strong> Carnival Triumph <strong>in</strong> July 1999 and Holland America's Volendam<strong>in</strong> August 1999 and <strong>the</strong> <strong>in</strong>troduction <strong>in</strong>to service of W<strong>in</strong>dstar's W<strong>in</strong>d Surf <strong>in</strong> May <strong>1998</strong>. Includ<strong>in</strong>g <strong>the</strong> impact of Cunard andSeabourn, average passenger capacity is expected to <strong>in</strong>crease 18.5% <strong>in</strong> fiscal 1999 as compared to fiscal <strong>1998</strong>. The acquisitionand consolidation of Cunard and Seabourn is not expected to materially affect <strong>the</strong> Company's consolidated net <strong>in</strong>come <strong>in</strong> 1999.The year over year percentage <strong>in</strong>crease <strong>in</strong> average passenger capacity, exclud<strong>in</strong>g <strong>the</strong> impact of Cunard and Seabourn, result<strong>in</strong>gfrom <strong>the</strong> delivery of vessels currently under contract <strong>for</strong> construction <strong>for</strong> <strong>the</strong> fiscal years 2000 and 2001 is expected toapproximate 12.9% and 11.9%, respectively. Includ<strong>in</strong>g <strong>the</strong> impact of Cunard and Seabourn, <strong>the</strong> year over year <strong>in</strong>crease <strong>in</strong>average passenger capacity <strong>for</strong> fiscal 2000 and 2001 is expected to approximate 11.7% and 10.9%, respectively.In June 1997, <strong>the</strong> Company and Airtours, a publicly traded leisure travel company <strong>in</strong> which <strong>the</strong> Company holds a 26% <strong>in</strong>terest,each acquired a 50% <strong>in</strong>terest <strong>in</strong> Il Ponte, <strong>the</strong> parent company of Costa, an Italian cruise company. The Company records its<strong>in</strong>terest <strong>in</strong> Airtours and Il Ponte us<strong>in</strong>g <strong>the</strong> equity method of account<strong>in</strong>g and records its portion of Airtours' and Il Ponte'sconsolidated operat<strong>in</strong>g results on a two-month lag basis. Demand <strong>for</strong> Airtours' and Costa's products is seasonal due to <strong>the</strong> natureof <strong>the</strong> European leisure travel <strong>in</strong>dustry and European cruise season. Typically, Airtours' and Costa's quarters end<strong>in</strong>g June 30 andSeptember 30 experience higher demand, with demand <strong>in</strong> <strong>the</strong> quarter end<strong>in</strong>g September 30 be<strong>in</strong>g <strong>the</strong> highest.Fiscal <strong>1998</strong> Compared To Fiscal 1997RevenuesThe <strong>in</strong>crease <strong>in</strong> total revenues of $561.8 million, or 23.0%, was due primarily to an <strong>in</strong>crease <strong>in</strong> cruise revenues of $540.3 million,or 23.9%. Approximately $281.9 million of <strong>the</strong> cruise revenue <strong>in</strong>crease is due to <strong>the</strong> acquisition and consolidation of Cunard andSeabourn and $258.4 million is due to <strong>in</strong>creased cruise revenues from Carnival, Holland America and W<strong>in</strong>dstar. The <strong>in</strong>creasefrom Carnival, Holland America and W<strong>in</strong>dstar resulted from an <strong>in</strong>crease of approximately 7.0% <strong>in</strong> total revenue per passengercruise day and a 4.8% <strong>in</strong>crease <strong>in</strong> passenger capacity, offset slightly by a .6% decrease <strong>in</strong> occupancy rates. Total revenue perpassenger cruise day <strong>in</strong>creased primarily due to strong demand <strong>for</strong> <strong>the</strong> Company's cruise brands and <strong>the</strong> <strong>in</strong>troduction of HollandAmerica's new Rotterdam VI <strong>in</strong> November 1997, which has obta<strong>in</strong>ed higher pric<strong>in</strong>g. Passenger capacity <strong>in</strong>creased due to <strong>the</strong>addition of new vessels discussed previously partially offset by <strong>the</strong> Ecstasy be<strong>in</strong>g out of service <strong>for</strong> two months dur<strong>in</strong>g <strong>1998</strong> (seeNonoperat<strong>in</strong>g Income (Expense)). Tour revenues <strong>in</strong>creased $31.8 million, or 13.1% to $274.5 million <strong>in</strong> <strong>1998</strong> from $242.6million <strong>in</strong> 1997 due primarily to an <strong>in</strong>crease <strong>in</strong> <strong>the</strong> number of tours sold.Cost and ExpensesOperat<strong>in</strong>g expenses <strong>in</strong>creased $296.7 million, or 22.4%. Cruise operat<strong>in</strong>g costs <strong>in</strong>creased by $274.2 million, or 23.1% <strong>in</strong> <strong>1998</strong>.Approximately $177.5 million of <strong>the</strong> cruise operat<strong>in</strong>g costs <strong>in</strong>crease is due to <strong>the</strong> acquisition and consolidation of Cunard andSeabourn. Exclud<strong>in</strong>g Cunard and Seabourn, cruise operat<strong>in</strong>g costs as a percentage of cruise revenues were 50.9% and 52.5% <strong>in</strong><strong>1998</strong> and 1997, respectively. Cruise operat<strong>in</strong>g costs, exclud<strong>in</strong>g Cunard and Seabourn, <strong>in</strong>creased primarily as a result of <strong>in</strong>creases<strong>in</strong> passenger capacity and airfare costs, partially offset by lower fuel costs. Airfare costs <strong>in</strong>creased due to a higher rate per airpassenger as well as a higher percentage of passengers elect<strong>in</strong>g <strong>the</strong> Company's air program. Tour operat<strong>in</strong>g expenses <strong>in</strong>creased$32.8 million, or 17.2% primarily due to <strong>the</strong> <strong>in</strong>crease <strong>in</strong> tour volume and higher expenses <strong>in</strong>curred primarily as a result of<strong>in</strong>creased tour content.Sell<strong>in</strong>g and adm<strong>in</strong>istrative expenses <strong>in</strong>creased $72.9 million, or 24.6%, of which $46.8 million, or 15.8%, was due to <strong>the</strong>acquisition and consolidation of Cunard and Seabourn. Exclud<strong>in</strong>g Cunard and Seabourn, sell<strong>in</strong>g and adm<strong>in</strong>istrative expenses as apercentage of revenues were 11.8% and 12.1% <strong>in</strong> <strong>1998</strong> and 1997, respectively. Sell<strong>in</strong>g and adm<strong>in</strong>istrative expenses, exclud<strong>in</strong>gCunard and Seabourn, <strong>in</strong>creased primarily as a result of <strong>in</strong>creases <strong>in</strong> advertis<strong>in</strong>g and payroll and related costs.
Depreciation and amortization <strong>in</strong>creased by $33.4 million, or 20.0%, to $200.7 million <strong>in</strong> <strong>1998</strong> from $167.3 million <strong>in</strong> 1997primarily due to <strong>the</strong> additional depreciation associated with <strong>the</strong> <strong>in</strong>crease <strong>in</strong> <strong>the</strong> size of <strong>the</strong> fleet and <strong>the</strong> acquisition andconsolidation of Cunard and Seabourn.Affiliated OperationsDur<strong>in</strong>g <strong>1998</strong>, <strong>the</strong> Company recorded $76.7 million of <strong>in</strong>come from affiliated operations as compared with $53.1 million of<strong>in</strong>come <strong>in</strong> 1997. The Company's portion of Airtours' <strong>in</strong>come <strong>in</strong>creased $3.7 million to $39.4 million <strong>in</strong> <strong>1998</strong>. The Companyrecorded <strong>in</strong>come of $39.9 million and $15.5 million dur<strong>in</strong>g <strong>1998</strong> and 1997, respectively, related to its <strong>in</strong>terest <strong>in</strong> Il Ponte. TheCompany did not record earn<strong>in</strong>gs from its <strong>in</strong>vestment <strong>in</strong> Il Ponte <strong>in</strong> <strong>the</strong> first n<strong>in</strong>e months of 1997 s<strong>in</strong>ce Il Ponte was acquired <strong>in</strong>June 1997 and its consolidated operat<strong>in</strong>g results are recorded on a two- month lag basis. The affiliated operations <strong>for</strong> <strong>1998</strong><strong>in</strong>cludes Seabourn through May 28, <strong>1998</strong> after which its results are <strong>in</strong>cluded <strong>in</strong> <strong>the</strong> Company's consolidated results.Nonoperat<strong>in</strong>g Income (Expense)Gross <strong>in</strong>terest expense (exclud<strong>in</strong>g capitalized <strong>in</strong>terest) <strong>in</strong>creased $20.2 million <strong>in</strong> <strong>1998</strong> primarily as a result of higher averagedebt balances, aris<strong>in</strong>g from <strong>the</strong> acquisition and consolidation of Cunard and Seabourn as well as <strong>in</strong>vestments <strong>in</strong> new vesselprojects. Capitalized <strong>in</strong>terest <strong>in</strong>creased $18.3 million due primarily to higher levels of <strong>in</strong>vestments <strong>in</strong> ship construction projectsdur<strong>in</strong>g fiscal <strong>1998</strong> as compared with fiscal 1997.Included <strong>in</strong> o<strong>the</strong>r <strong>in</strong>come <strong>in</strong> <strong>1998</strong> were ga<strong>in</strong>s of $8.4 and $14.8 million result<strong>in</strong>g from <strong>the</strong> clos<strong>in</strong>g of <strong>the</strong> sale of CHC's hotelmanagement division and Airtours' issuances of its common stock, respectively. In <strong>the</strong> event that Airtours issues additionalcommon stock <strong>in</strong> <strong>the</strong> future, <strong>the</strong> Company may recognize ga<strong>in</strong>s or losses related to <strong>the</strong>se future issuances. Additionally, o<strong>the</strong>rexpense <strong>in</strong>cludes $8.7 million of previously deferred start-up costs, which were expensed <strong>in</strong> <strong>1998</strong> and represent <strong>the</strong> cumulativeeffect from <strong>the</strong> Company chang<strong>in</strong>g its policy <strong>in</strong> connection with its early adoption of SOP 98-5 (see Notes 4 and 14 <strong>in</strong> <strong>the</strong>accompany<strong>in</strong>g f<strong>in</strong>ancial statements).In July <strong>1998</strong>, a fire occurred on <strong>the</strong> moor<strong>in</strong>g deck on Carnival Cruise L<strong>in</strong>es' Ecstasy. There were no serious <strong>in</strong>juries to passengersor crew, however, <strong>the</strong>re was damage to <strong>the</strong> ship's aft section. The time necessary to complete repairs to <strong>the</strong> Ecstasy resulted <strong>in</strong> <strong>the</strong>ship be<strong>in</strong>g out of service <strong>for</strong> approximately two months dur<strong>in</strong>g <strong>1998</strong>. The Ecstasy fire resulted <strong>in</strong> a reduction <strong>in</strong> earn<strong>in</strong>gs ofapproximately $19.3 million <strong>in</strong> <strong>1998</strong>. This reduction was comprised of lost revenue, net of related variable expenses, of $12.0million, and costs associated with repairs to <strong>the</strong> ship, passenger handl<strong>in</strong>g and various o<strong>the</strong>r costs, net of estimated <strong>in</strong>surancerecoveries, of $7.3 million. The costs of $7.3 million were <strong>in</strong>cluded <strong>in</strong> o<strong>the</strong>r expenses.M<strong>in</strong>ority <strong>in</strong>terest was $11.1 million which represents <strong>the</strong> m<strong>in</strong>ority shareholders' <strong>in</strong>terest <strong>in</strong> Cunard L<strong>in</strong>e Limited's net <strong>in</strong>comes<strong>in</strong>ce its acquisition and consolidation by <strong>the</strong> Company on May 28, <strong>1998</strong>.
CARNIVAL CORPORATIONCONSOLIDATED BALANCE SHEETS (<strong>in</strong> thousands, except par value)ASSETS NOVEMBER 30,<strong>1998</strong> 1997CURRENT ASSETSCash and cash equivalents $ 137,273 $ 139,989Short-term <strong>in</strong>vestments 5,956 9,738Accounts receivable, net 60,837 57,090Consumable <strong>in</strong>ventories, at average cost 75,449 54,970Prepaid expenses and o<strong>the</strong>r 90,764 74,238Total current assets 370,279 336,025PROPERTY AND EQUIPMENT, Net 5,768,114 4,327,413OTHER ASSETSInvestments <strong>in</strong> and advances to affiliates 546,693 479,329Goodwill, less accumulated amortization of$72,255 and $62,256 437,464 212,607O<strong>the</strong>r assets 56,773 71,401$7,179,323 $5,426,775LIABILITIES AND SHAREHOLDERS' EQUITYCURRENT LIABILITIESCurrent portion of long-term debt $ 67,626 $ 59,620Accounts payable 168,546 106,783Accrued liabilities 206,968 154,253Customer deposits 638,383 420,908Dividends payable 53,590 44,578Total current liabilities 1,135,113 786,142LONG-TERM DEBT 1,563,014 1,015,294DEFERRED INCOME AND OTHER LONG-TERM LIABILITIES 63,036 20,241COMMITMENTS AND CONTINGENCIES (Notes 2 and 9)MINORITY INTEREST 132,684SHAREHOLDERS' EQUITYCommon Stock; $.01 par value; 960,000 sharesauthorized; 595,448 and 594,408 shares issued andoutstand<strong>in</strong>g 5,955 5,944Paid-<strong>in</strong>-capital 880,488 863,125Reta<strong>in</strong>ed earn<strong>in</strong>gs 3,379,628 2,731,213O<strong>the</strong>r 19,405 4,816Total shareholders' equity 4,285,476 3,605,098$7,179,323 $5,426,775The accompany<strong>in</strong>g notes are an <strong>in</strong>tegral part of <strong>the</strong>se consolidated f<strong>in</strong>ancial statements.
CARNIVAL CORPORATIONCONSOLIDATED STATEMENTS OF OPERATIONS(<strong>in</strong> thousands, except per share data)YEARS ENDED NOVEMBER 30,<strong>1998</strong> 1997 1996REVENUES $3,009,306 $2,447,468 $2,212,572COSTS AND EXPENSESOperat<strong>in</strong>g expenses 1,619,377 1,322,669 1,241,269Sell<strong>in</strong>g and adm<strong>in</strong>istrative 369,469 296,533 274,855Depreciation and amortization 200,668 167,287 144,9872,189,514 1,786,489 1,661,111OPERATING INCOME BEFORE INCOME FROMAFFILIATED OPERATIONS 819,792 660,979 551,461INCOME FROM AFFILIATED OPERATIONS, NET 76,732 53,091 45,967OPERATING INCOME 896,524 714,070 597,428NONOPERATING INCOME (EXPENSE)Interest <strong>in</strong>come 10,257 8,675 18,597Interest expense, net ofcapitalized <strong>in</strong>terest (57,772) (55,898) (64,092)O<strong>the</strong>r <strong>in</strong>come, net 1,793 5,436 23,414Income tax expense (3,815) (6,233) (9,045)M<strong>in</strong>ority <strong>in</strong>terest (11,102)(60,639) (48,020) (31,126)NET INCOME $ 835,885 $ 666,050 $ 566,302EARNINGS PER SHARE:Basic $1.40 $1.12 $.98Diluted $1.40 $1.12 $.96The accompany<strong>in</strong>g notes are an <strong>in</strong>tegral part of <strong>the</strong>se consolidated f<strong>in</strong>ancial statements.
CARNIVAL CORPORATIONCONSOLIDATED STATEMENTS OF CASH FLOWS(<strong>in</strong> thousands)YEARS ENDED NOVEMBER 30,<strong>1998</strong> 1997 1996OPERATING ACTIVITIESNet <strong>in</strong>come $ 835,885 $666,050 $566,302Adjustments to reconcile net <strong>in</strong>come tonet cash provided from operat<strong>in</strong>g activities:Depreciation and amortization 200,668 167,287 144,987Income from affiliates <strong>in</strong> excess ofdividends received (63,059) (46,569) (43,224)M<strong>in</strong>ority <strong>in</strong>terest 11,102O<strong>the</strong>r (8,428) 2,540 19,639Changes <strong>in</strong> operat<strong>in</strong>g assets and liabilities,exclud<strong>in</strong>g bus<strong>in</strong>esses acquired and consolidated:Decrease (<strong>in</strong>crease) <strong>in</strong>:Receivables 137 (21,229) (4,432)Consumable <strong>in</strong>ventories (3,913) (1,689) (4,461)Prepaid expenses and o<strong>the</strong>r (15,369) 903 (4,919)Increase (decrease) <strong>in</strong>:Accounts payable 18,758 22,035 (5,489)Accrued liabilities 42,401 20,042 13,028Customer deposits 73,658 68,210 60,092Net cash provided from operat<strong>in</strong>gactivities 1,091,840 877,580 741,523INVESTING ACTIVITIESAdditions to property and equipment, net (1,150,413) (497,657) (901,905)Proceeds from sale of assets 47,028 17,041 94,291Proceeds from litigation settlementsapplied to cost of ships 43,050Acquisition of consolidated subsidiaries, net (242,868)Purchase of equity <strong>in</strong>terests <strong>in</strong> affiliates (38,378) (163,112)O<strong>the</strong>r (additions to) reductions <strong>in</strong><strong>in</strong>vestments <strong>in</strong> and advances toaffiliates, net (380) 39,540 (23,903)Decrease <strong>in</strong> short-term <strong>in</strong>vestments, net 4,052 2,748 37,710O<strong>the</strong>r, net 21,528 21,805 94,644Net cash used <strong>for</strong> <strong>in</strong>vest<strong>in</strong>g activities (1,321,053) (454,901) (819,225)FINANCING ACTIVITIESProceeds from long-term debt 1,404,395 155,366 971,361Pr<strong>in</strong>cipal payments of long-term debt (1,006,586) (424,391) (735,246)Dividends paid (178,458) (130,456) (103,877)Proceeds from issuance of Common Stock 11,399 5,162 3,728O<strong>the</strong>r (4,253)Net cash provided from (used <strong>for</strong>)f<strong>in</strong>anc<strong>in</strong>g activities 226,497 (394,319) 135,966Net (decrease) <strong>in</strong>crease <strong>in</strong> cash andcash equivalents (2,716) 28,360 58,264Cash and cash equivalents at beg<strong>in</strong>n<strong>in</strong>gof year 139,989 111,629 53,365Cash and cash equivalents at end of year $ 137,273 $139,989 $111,629The accompany<strong>in</strong>g notes are an <strong>in</strong>tegral part of <strong>the</strong>se consolidated f<strong>in</strong>ancial statements.
CARNIVAL CORPORATIONNOTES TO CONSOLIDATED FINANCIAL STATEMENTSNOTE 1 - GENERALDescription of Bus<strong>in</strong>essCarnival Corporation, a Panamanian corporation, and its wholly and majority owned subsidiaries (referred to collectively as <strong>the</strong>"Company") operate five cruise l<strong>in</strong>es under <strong>the</strong> brand names Carnival Cruise L<strong>in</strong>es ("Carnival"), Cunard L<strong>in</strong>e ("Cunard"),Holland America L<strong>in</strong>e ("Holland America"), Seabourn Cruise L<strong>in</strong>e ("Seabourn") and W<strong>in</strong>dstar <strong>Cruises</strong> ("W<strong>in</strong>dstar") and a tourbus<strong>in</strong>ess, Holland America Westours. Carnival operates thirteen cruise ships cruis<strong>in</strong>g primarily <strong>in</strong> <strong>the</strong> <strong>Caribbean</strong>, MexicanRiviera and Alaska. Holland America operates eight cruise ships cruis<strong>in</strong>g primarily <strong>in</strong> Alaska, <strong>the</strong> <strong>Caribbean</strong> and Europe andW<strong>in</strong>dstar operates four luxury, sail-powered vessels which call on more exotic locations <strong>in</strong>accessible to larger ships, primarily <strong>in</strong><strong>the</strong> <strong>Caribbean</strong>, Europe and Central America. Cunard and Seabourn operate five and three luxury cruise vessels, respectively, toworldwide dest<strong>in</strong>ations (see Note 13). Holland America L<strong>in</strong>e- Westours Inc. markets sightsee<strong>in</strong>g tours both separately and as apart of Holland America cruise/tour packages. Holland America Westours operates 14 hotels <strong>in</strong> Alaska and <strong>the</strong> Canadian Yukon,two luxury dayboats offer<strong>in</strong>g tours to <strong>the</strong> glaciers of Alaska and <strong>the</strong> Yukon River, over 280 motor coaches used <strong>for</strong> sightsee<strong>in</strong>gand charters <strong>in</strong> <strong>the</strong> states of Wash<strong>in</strong>gton and Alaska and <strong>in</strong> <strong>the</strong> Canadian Rockies and 13 private domed rail cars which are run on<strong>the</strong> Alaskan Railroad between Anchorage and Fairbanks.The Company has a 50% direct equity <strong>in</strong>terest <strong>in</strong> Il Ponte S.p.A. ("Il Ponte"), <strong>the</strong> parent company of Costa Crociere, S.p.A.("Costa"), an Italian cruise company. Additionally, <strong>the</strong> Company has a 26% <strong>in</strong>terest <strong>in</strong> Airtours plc ("Airtours"), a large publiclytraded air-<strong>in</strong>clusive <strong>in</strong>tegrated leisure travel company headquartered <strong>in</strong> England, and a 23% <strong>in</strong>terest <strong>in</strong> a cas<strong>in</strong>o development andmanagement company, CRC Hold<strong>in</strong>gs, Inc. ("CRC"). Costa operates seven cruise ships <strong>in</strong> Europe, <strong>the</strong> <strong>Caribbean</strong> and SouthAmerica and its cruises are marketed primarily to Europeans. Airtours provided holidays <strong>for</strong> approximately eight million people<strong>in</strong> <strong>1998</strong> primarily from <strong>the</strong> United K<strong>in</strong>gdom, Scand<strong>in</strong>avia and North America and owns or operates over 800 retail travel shops,36 aircraft, three cruise ships (an additional ship is scheduled to be delivered <strong>in</strong> 1999), 26 holiday hotels and develops andmarkets vacation ownership resorts. Airtours also owns <strong>the</strong> o<strong>the</strong>r 50% of Il Ponte not owned by <strong>the</strong> Company. CRC's cas<strong>in</strong>oactivities are located <strong>in</strong> <strong>the</strong> United States and Canada.NOTE 3 - PROPERTY AND EQUIPMENTProperty and equipment consists of <strong>the</strong> follow<strong>in</strong>g:November 30,<strong>1998</strong> 1997(<strong>in</strong> thousands)Vessels $5,754,218 $4,536,382Vessels under construction 526,529 182,9296,280,747 4,719,311Land, build<strong>in</strong>gs and improvements 217,597 194,013Transportation and o<strong>the</strong>r equipment 322,069 268,520Total property and equipment 6,820,413 5,181,844Less accumulated depreciation and amortization (1,052,299) (854,431)$5,768,114 $4,327,413Interest costs associated with <strong>the</strong> construction of property and equipment, consist<strong>in</strong>g primarily of vessels, are capitalized dur<strong>in</strong>g<strong>the</strong> construction period and amounted to $35.1 million <strong>in</strong> <strong>1998</strong>, $16.8 million <strong>in</strong> 1997 and $25.8 million <strong>in</strong> 1996.NOTE 10 - SEGMENT INFORMATIONThe Company's cruise segment currently operates twenty-n<strong>in</strong>e passenger cruise ships and four luxury sail<strong>in</strong>g vessels. Cruiserevenues are comprised of sales of passenger tickets, <strong>in</strong>clud<strong>in</strong>g, <strong>in</strong> some cases, air transportation to and from <strong>the</strong> cruise ship, andrevenues from on-board activities and o<strong>the</strong>r related services. The tour bus<strong>in</strong>ess represents <strong>the</strong> operations of Holland AmericaWestours. The corporate segment is primarily comprised of cash and cash equivalents, goodwill, and <strong>in</strong>vestments, <strong>in</strong>clud<strong>in</strong>g <strong>the</strong>Company's <strong>in</strong>vestments <strong>in</strong> and advances to affiliates and <strong>the</strong> related earn<strong>in</strong>gs from <strong>the</strong>se affiliates. Intersegment revenuesprimarily represent charges <strong>for</strong> <strong>the</strong> cruise portion of a tour when a cruise is sold as a part of a tour package. Export sales representrevenues identified with <strong>the</strong> Company's domestic operations, which were generated from outside <strong>the</strong> U.S. Segment and exportsales <strong>in</strong><strong>for</strong>mation <strong>for</strong> each of <strong>the</strong> three years <strong>in</strong> <strong>the</strong> period ended November 30, <strong>1998</strong> is as follows:
<strong>1998</strong> 1997 1996(<strong>in</strong> thousands)REVENUESCruise $2,797,856 $2,257,567 $2,003,458Tour 274,491 242,646 263,356Intersegment revenues (63,041) (52,745) (54,242)$3,009,306 $2,447,468 $2,212,572GROSS OPERATING PROFITCruise $1,338,833 $1,072,758 $ 913,880Tour 51,096 52,041 57,423$1,389,929 $1,124,799 $ 971,303DEPRECIATION AND AMORTIZATIONCruise $ 189,345 $ 157,454 $ 135,694Tour 9,491 8,862 8,317Corporate 1,832 971 976$ 200,668 $ 167,287 $ 144,987OPERATING INCOMECruise $ 822,242 $ 656,009 $ 535,814Tour 9,248 13,262 21,252Corporate 65,034 44,799 40,362$ 896,524 $ 714,070 $ 597,428IDENTIFIABLE ASSETSCruise $6,149,625 $4,744,140 $4,514,675Tour 174,140 163,941 150,851Corporate 855,558 518,694 436,362$7,179,323 $5,426,775 $5,101,888CAPITAL EXPENDITURESCruise $1,113,191 $ 414,963 $ 841,871Tour 28,480 42,507 14,964Corporate 8,742 40,187 1,810$1,150,413 $ 497,657 $ 858,645EXPORT SALES $ 342,017 $ 213,405 $ 198,046NOTE 13 - ACQUISITIONOn May 28, <strong>1998</strong>, <strong>the</strong> Company and a group of <strong>in</strong>vestors acquired <strong>the</strong> operat<strong>in</strong>g assets of Cunard, a cruise company operat<strong>in</strong>gfive luxury cruise ships, <strong>for</strong> $500 million, adjusted <strong>for</strong> a work<strong>in</strong>g capital deficiency and debt assumed. The Company isaccount<strong>in</strong>g <strong>for</strong> <strong>the</strong> acquisition us<strong>in</strong>g <strong>the</strong> purchase account<strong>in</strong>g method. Simultaneous with <strong>the</strong> acquisition, Seabourn Cruise L<strong>in</strong>eLimited ("Seabourn"), a luxury cruise l<strong>in</strong>e <strong>in</strong> which <strong>the</strong> Company owned a 50% <strong>in</strong>terest, was comb<strong>in</strong>ed with Cunard. TheCompany owns approximately 68% of <strong>the</strong> comb<strong>in</strong>ed entity, which is named Cunard L<strong>in</strong>e Limited. Commenc<strong>in</strong>g on May 28,<strong>1998</strong>, <strong>the</strong> f<strong>in</strong>ancial results of Cunard L<strong>in</strong>e Limited have been <strong>in</strong>cluded <strong>in</strong> <strong>the</strong> Company's consolidated f<strong>in</strong>ancial statements. Priorto May 28, <strong>1998</strong>, <strong>the</strong> Company's 50% <strong>in</strong>terest <strong>in</strong> Seabourn was accounted <strong>for</strong> us<strong>in</strong>g <strong>the</strong> equity method (see Notes 2 and 4).Had <strong>the</strong> above transactions occurred on December 1, 1996, <strong>the</strong> Company's unaudited consolidated revenues <strong>for</strong> fiscal <strong>1998</strong> and1997 would have been approximately $3.23 billion and $2.92 billion, respectively. The impact on <strong>the</strong> Company's fiscal <strong>1998</strong> and1997 unaudited net <strong>in</strong>come and earn<strong>in</strong>gs per share would have been immaterial.
SELECTED FINANCIAL DATAThe selected f<strong>in</strong>ancial data presented below <strong>for</strong> <strong>the</strong> fiscal years 1994 through <strong>1998</strong> and as of <strong>the</strong> end of each such fiscal year arederived from <strong>the</strong> f<strong>in</strong>ancial statements of <strong>the</strong> Company and should be read <strong>in</strong> conjunction with such f<strong>in</strong>ancial statements and <strong>the</strong>related notes.YEARS ENDED NOVEMBER 30,<strong>1998</strong> 1997 1996 1995 1994(<strong>in</strong> thousands, except per share data)INCOME STATEMENT DATA:Revenues $3,009,306 $2,447,468 $2,212,572 $1,998,150 $1,806,016Operat<strong>in</strong>g <strong>in</strong>comebe<strong>for</strong>e <strong>in</strong>come fromaffiliated operations $ 819,792 $ 660,979 $ 551,461 $ 490,038 $ 443,674Operat<strong>in</strong>g <strong>in</strong>come $ 896,524 $ 714,070 $ 597,428 $ 490,038 $ 443,674Net <strong>in</strong>come $ 835,885 $ 666,050 $ 566,302 $ 451,091 $ 381,765Earn<strong>in</strong>gs per share (1):Basic $1.40 $1.12 $.98 $.79 $.68Diluted $1.40 $1.12 $.96 $.79 $.67Dividends declaredper share (1) $.315 $.240 $.190 $.158 $.142Passenger cruise days 13,009 11,908 10,583 9,201 8,102Occupancy percentage (2) 106.3% 108.3% 107.6% 105.0% 104.0%----------------------------------(1) All per share amounts have been adjusted to reflect two-<strong>for</strong>-one stock splits effective November 30, 1994 and June 12, <strong>1998</strong>.(2) In accordance with cruise <strong>in</strong>dustry practice, occupancy percentage is calculated based upon two passengers per cab<strong>in</strong> eventhough some cab<strong>in</strong>s can accommodate three or four passengers. The percentages <strong>in</strong> excess of 100% <strong>in</strong>dicate that more than twopassengers occupied some cab<strong>in</strong>s.SELECTED QUARTERLY FINANCIAL DATA (unaudited)Quarterly f<strong>in</strong>ancial results <strong>for</strong> fiscal <strong>1998</strong> are as follows:QUARTERS ENDEDFEBRUARY 28, MAY 31, AUGUST 31, NOVEMBER 30,(<strong>in</strong> thousands, except per share data)Revenues $557,838 $661,358 $1,061,539 $728,571Gross profit $250,243 $299,002 $ 521,196 $319,488Operat<strong>in</strong>g <strong>in</strong>come be<strong>for</strong>e<strong>in</strong>come from affiliatedoperations $128,401 $167,794 $ 365,007 $158,590Operat<strong>in</strong>g <strong>in</strong>come $117,720 $165,441 $ 378,849 $234,514Net <strong>in</strong>come $109,914 $160,596 $ 344,752 $220,623Earn<strong>in</strong>gs per share (1):Basic $.18 $.27 $.58 $.37Diluted $.18 $.27 $.58 $.37Dividends declared per share (1) $.075 $.075 $.075 $.09Quarterly f<strong>in</strong>ancial results <strong>for</strong> fiscal 1997 are as follows:QUARTERS ENDEDFEBRUARY 28, MAY 31, AUGUST 31, NOVEMBER 30,(<strong>in</strong> thousands, except per share data)Revenues $521,082 $596,614 $805,421 $524,351Gross profit $224,144 $258,930 $417,301 $224,424Operat<strong>in</strong>g <strong>in</strong>come be<strong>for</strong>e<strong>in</strong>come from affiliatedoperations $103,944 $140,253 $308,590 $108,192Operat<strong>in</strong>g <strong>in</strong>come $ 94,962 $137,541 $318,961 $162,606Net <strong>in</strong>come $ 85,360 $127,447 $297,893 $155,350Earn<strong>in</strong>gs per share (1):Basic $.14 $.21 $.50 $.26Diluted $.14 $.21 $.50 $.26Dividends declared per share (1) $.055 $.055 $.055 $.075
Company NameCommon Shares Outstand<strong>in</strong>gROYAL CARIBBEAN CRUISES LTD168,591 (<strong>in</strong> 000s at most recent fiscal year end)Estimated Price/Share=$98.02Actual Actual Actual Actual ActualFiscal Year End (MM/DD/YYYY) 12/31/1994 12/31/1995 12/31/1996 12/31/1997 12/31/<strong>1998</strong>Income StatementSales (Net) 1,171,423 1,183,952 1,357,325 1,939,007 2,636,291Cost of Goods Sold (728,760) (742,467) (854,478) (1,219,268) (1,593,728)Gross Profit 442,663 441,485 502,847 719,739 1,042,563R&D Expense 0 0 0 0 0SG&A Expense (179,051) (177,481) (194,629) (272,368) (359,214)EBITDA 263,612 264,004 308,218 447,371 683,349Depreciation & Amortization (77,892) (80,071) (91,185) (143,816) (194,614)EBIT 185,720 183,933 217,033 303,555 488,735Interest Expense (43,349) (54,844) (76,540) (128,531) (167,869)Non-Operat<strong>in</strong>g Income (Loss) (46) 19,869 10,373 7,661 9,904EBT 142,325 148,958 150,866 182,685 330,770Income Taxes 0 0 0 0 0M<strong>in</strong>ority Interest <strong>in</strong> Earn<strong>in</strong>gs 0 0 0 0 0O<strong>the</strong>r Income (Loss) 0 0 0 0 0Net Income Be<strong>for</strong>e Ext. Items 142,325 148,958 150,866 182,685 330,770Ext. Items & Disc. Ops. (5,700) 0 0 (7,558) 0Preferred Dividends 0 0 0 (9,200) (12,500)Net Income (available to common) 136,625 148,958 150,866 165,927 318,270Balance SheetOperat<strong>in</strong>g Cash and Market. Sec. 23,920 31,256 40,419 110,793 172,921Receivables 9,424 12,171 15,535 22,628 36,532Inventories 13,555 16,830 22,665 37,274 31,834O<strong>the</strong>r Current Assets 71,233 27,563 33,745 40,450 45,044Total Current Assets 118,132 87,820 112,364 211,145 286,331PP&E (Net) 1,384,814 1,758,446 2,378,934 4,785,291 5,073,008Investments 0 0 0 0 0Intangibles 351,456 341,041 330,628 320,214 309,801O<strong>the</strong>r Assets 10,602 15,936 20,373 23,098 16,936Total Assets 1,865,004 2,203,243 2,842,299 5,339,748 5,686,076Current Debt 0 6,234 13,061 141,013 127,919Accounts Payable 63,181 71,528 69,091 108,474 115,833Income Taxes Payable 0 0 0 0 0O<strong>the</strong>r Current Liabilities 209,094 230,935 321,307 639,857 646,403Total Current Liabilities 272,275 308,697 403,459 889,344 890,155Long-Term Debt 747,107 929,458 1,353,906 2,431,683 2,341,163O<strong>the</strong>r Liabilities 0 0 0 0 0Deferred Taxes 0 0 0 0 0M<strong>in</strong>ority Interest 0 0 0 0 0Total Liabilities 1,019,382 1,238,155 1,757,365 3,321,027 3,231,318Preferred Stock 0 0 0 172,500 172,500Paid <strong>in</strong> Common Capital (Net) 545,061 546,058 549,422 1,185,566 1,358,567Reta<strong>in</strong>ed Earn<strong>in</strong>gs 300,561 419,030 535,512 660,655 923,691Total Common Equity 845,622 965,088 1,084,934 1,846,221 2,282,258Total Liabilities and Equity 1,865,004 2,203,243 2,842,299 5,339,748 5,686,076Statement of Reta<strong>in</strong>ed Earn<strong>in</strong>gsBeg. Reta<strong>in</strong>ed Earn<strong>in</strong>gs 300,561 419,030 535,512 660,655+Net Income 148,958 150,866 165,927 318,270-Common Dividends (30,489) (34,384) (49,984) (67,734)+/-Clean Surplus Plug (Ignore) 0 0 9,200 12,500=End. Reta<strong>in</strong>ed Earn<strong>in</strong>gs 300,561 419,030 535,512 660,655 923,691
Company NameROYAL CARIBBEAN CRUISES LTDActual Actual Actual Actual ActualFiscal Year End Date 12/31/1994 12/31/1995 12/31/1996 12/31/1997 12/31/<strong>1998</strong>Annual Growth RatesSales 1.1% 14.6% 42.9% 36.0%Assets 18.1% 29.0% 87.9% 6.5%Common Equity 14.1% 12.4% 70.2% 23.6%Earn<strong>in</strong>gs 9.0% 1.3% 16.1% 88.9%Free Cash Flow to Investors #N/A #N/A #N/ASusta<strong>in</strong>able Growth Rate 11.4% 8.5% 12.7%ProfitabilityReturn on Equity 0.165 0.147 0.119 0.160Return on Equity (b4 non-recurr<strong>in</strong>g) 0.143 0.137 0.119 0.155Return on Net Operat<strong>in</strong>g Assets 0.117 0.104 0.086 0.105Basic Dupont ModelNet Profit Marg<strong>in</strong> 0.117 0.126 0.111 0.090 0.125x Total Asset Turnover 0.582 0.538 0.474 0.478x Total Leverage 2.247 2.461 2.791 2.671= Return on Equity 0.165 0.147 0.119 0.160Advanced Dupont ModelNet Operat<strong>in</strong>g Marg<strong>in</strong> 0.154 0.172 0.168 0.157 0.189x Net Operat<strong>in</strong>g Asset Turnover 0.678 0.624 0.551 0.554= Return on Net Operat<strong>in</strong>g Assets 0.117 0.104 0.086 0.105Net Borrow<strong>in</strong>g Cost (NBC) 0.065 0.066 0.063 0.062Spread (RNOA - NBC) 0.051 0.038 0.024 0.042F<strong>in</strong>ancial Leverage (LEV) 0.929 1.123 1.403 1.305ROE = RNOA + LEV*Spread 0.165 0.147 0.119 0.160Marg<strong>in</strong> AnalysisGross Marg<strong>in</strong> 0.378 0.373 0.370 0.371 0.395EBITDA Marg<strong>in</strong> 0.225 0.223 0.227 0.231 0.259EBIT Marg<strong>in</strong> 0.159 0.155 0.160 0.157 0.185Net Operat<strong>in</strong>g Marg<strong>in</strong> (b4 non-rec.) 0.159 0.155 0.160 0.157 0.185Net Operat<strong>in</strong>g Marg<strong>in</strong> 0.154 0.172 0.168 0.157 0.189Turnover AnalysisNet Operat<strong>in</strong>g Asset Turnover 0.678 0.624 0.551 0.554Net Work<strong>in</strong>g Capital Turnover (6.421) (5.510) (4.757) (5.204)Avge Days to Collect Receivables 3.329 3.725 3.592 4.095Avge Inventory Hold<strong>in</strong>g Period 7.469 8.435 8.972 7.914Avge Days to Pay Payables 33.258 30.240 26.900 25.598PP&E Turnover 0.753 0.656 0.541 0.535Analysis of Leverage-Long-Term Capital StructureDebt to Equity Ratio 0.883 0.970 1.260 1.393 1.082FFO to Total Debt 0.272 0.210 0.162 0.208CFO to Total Debt 0.353 0.273 0.329 0.209Analysis of Leverage- Short-Term LiquidityCurrent Ratio 0.434 0.284 0.279 0.237 0.322Quick Ratio 0.122 0.141 0.139 0.150 0.235EBIT Interest Coverage 4.284 3.354 2.836 2.362 2.911EBITDA Interest Coverage 6.081 4.814 4.027 3.481 4.071
Company NameCommon Shares Outstand<strong>in</strong>gCARNIVAL CORP595,448 (<strong>in</strong> 000s at most recent fiscal year end)Estimated Price/Share=$47.28Actual Actual Actual Actual ActualFiscal Year End (MM/DD/YY) 11/30/1994 11/30/1995 11/30/1996 11/30/1997 11/30/<strong>1998</strong>Income StatementSales (Net) 1,806,016 1,998,150 2,212,572 2,447,468 3,009,306Cost of Goods Sold (1,028,475) (1,131,113) (1,241,269) (1,322,669) (1,619,377)Gross Profit 777,541 867,037 971,303 1,124,799 1,389,929R&D Expense 0 0 0 0 0SG&A Expense (223,272) (248,566) (274,855) (296,533) (369,469)EBITDA 554,269 618,471 696,448 828,266 1,020,460Depreciation & Amortization (110,595) (128,433) (144,987) (167,287) (200,668)EBIT 443,674 490,038 551,461 660,979 819,792Interest Expense (51,378) (63,080) (64,092) (55,898) (57,772)Non-Operat<strong>in</strong>g Income (Loss) (478) 33,507 87,978 67,202 88,782EBT 391,818 460,465 575,347 672,283 850,802Income Taxes (10,053) (9,374) (9,045) (6,233) (3,815)M<strong>in</strong>ority Interest <strong>in</strong> Earn<strong>in</strong>gs 0 0 0 0 (11,102)O<strong>the</strong>r Income (Loss) 0 0 0 0 0Net Income Be<strong>for</strong>e Ext. Items 381,765 451,091 566,302 666,050 835,885Ext. Items & Disc. Ops. 0 0 0 0 0Preferred Dividends 0 0 0 0 0Net Income (available to common) 381,765 451,091 566,302 666,050 835,885Balance SheetOperat<strong>in</strong>g Cash and Market. Sec. 124,220 103,760 124,115 149,727 143,229Receivables 20,789 33,080 38,109 57,090 60,837Inventories 45,122 48,820 53,281 54,970 75,449O<strong>the</strong>r Current Assets 50,318 70,718 75,428 74,238 90,764Total Current Assets 240,449 256,378 290,933 336,025 370,279PP&E (Net) 3,071,431 3,414,823 4,099,038 4,327,413 5,768,114Investments 47,514 51,794 430,330 479,329 546,693Intangibles 233,553 226,571 219,589 212,607 437,464O<strong>the</strong>r Assets 76,876 155,921 61,998 71,401 56,773Total Assets 3,669,823 4,105,487 5,101,888 5,426,775 7,179,323Current Debt 84,644 72,752 66,369 59,620 67,626Accounts Payable 86,750 90,237 84,748 106,783 168,546Income Taxes Payable 0 0 0 0 0O<strong>the</strong>r Current Liabilities 393,563 431,721 511,625 619,739 898,941Total Current Liabilities 564,957 594,710 662,742 786,142 1,135,113Long-Term Debt 1,161,904 1,150,031 1,316,632 1,015,294 1,563,014O<strong>the</strong>r Liabilities 14,028 15,873 0 0 0Deferred Taxes 0 0 91,630 20,241 63,036M<strong>in</strong>ority Interest 0 0 0 0 132,684Total Liabilities 1,740,889 1,760,614 2,071,004 1,821,677 2,893,847Preferred Stock 0 0 0 0 0Paid <strong>in</strong> Common Capital (Net) 538,345 592,733 823,103 873,885 905,848Reta<strong>in</strong>ed Earn<strong>in</strong>gs 1,390,589 1,752,140 2,207,781 2,731,213 3,379,628Total Common Equity 1,928,934 2,344,873 3,030,884 3,605,098 4,285,476Total Liabilities and Equity 3,669,823 4,105,487 5,101,888 5,426,775 7,179,323Statement of Reta<strong>in</strong>ed Earn<strong>in</strong>gsBeg. Reta<strong>in</strong>ed Earn<strong>in</strong>gs 1,390,589 1,752,140 2,207,781 2,731,213+Net Income 451,091 566,302 666,050 835,885-Common Dividends (85,098) (103,877) (130,456) (178,458)+/-Clean Surplus Plug (Ignore) (4,442) (6,784) (12,162) (9,012)=End. Reta<strong>in</strong>ed Earn<strong>in</strong>gs 1,390,589 1,752,140 2,207,781 2,731,213 3,379,628
Company NameCARNIVAL CORPActual Actual Actual Actual ActualFiscal Year End Date 11/30/1994 11/30/1995 11/30/1996 11/30/1997 11/30/<strong>1998</strong>Annual Growth RatesSales 10.6% 10.7% 10.6% 23.0%Assets 11.9% 24.3% 6.4% 32.3%Common Equity 21.6% 29.3% 18.9% 18.9%Earn<strong>in</strong>gs 18.2% 25.5% 17.6% 25.5%Free Cash Flow to Investors -292.3% #N/A -179.4%Susta<strong>in</strong>able Growth Rate 17.2% 16.1% 16.7%ProfitabilityReturn on Equity 0.211 0.211 0.201 0.212Return on Equity (b4 non-recurr<strong>in</strong>g) 0.196 0.178 0.181 0.189Return on Net Operat<strong>in</strong>g Assets 0.152 0.158 0.159 0.169Basic Dupont ModelNet Profit Marg<strong>in</strong> 0.211 0.226 0.256 0.272 0.278x Total Asset Turnover 0.514 0.481 0.465 0.477x Total Leverage 1.819 1.713 1.587 1.598= Return on Equity 0.211 0.211 0.201 0.212Advanced Dupont ModelNet Operat<strong>in</strong>g Marg<strong>in</strong> 0.239 0.257 0.284 0.295 0.297x Net Operat<strong>in</strong>g Asset Turnover 0.593 0.554 0.538 0.568= Return on Net Operat<strong>in</strong>g Assets 0.152 0.158 0.159 0.169Net Borrow<strong>in</strong>g Cost (NBC) 0.050 0.048 0.045 0.043Spread (RNOA - NBC) 0.102 0.109 0.114 0.126F<strong>in</strong>ancial Leverage (LEV) 0.578 0.485 0.370 0.343ROE = RNOA + LEV*Spread 0.211 0.211 0.201 0.212Marg<strong>in</strong> AnalysisGross Marg<strong>in</strong> 0.431 0.434 0.439 0.460 0.462EBITDA Marg<strong>in</strong> 0.307 0.310 0.315 0.338 0.339EBIT Marg<strong>in</strong> 0.246 0.245 0.249 0.270 0.272Net Operat<strong>in</strong>g Marg<strong>in</strong> (b4 non-rec.) 0.239 0.240 0.245 0.268 0.268Net Operat<strong>in</strong>g Marg<strong>in</strong> 0.239 0.257 0.284 0.295 0.297Turnover AnalysisNet Operat<strong>in</strong>g Asset Turnover 0.593 0.554 0.538 0.568Net Work<strong>in</strong>g Capital Turnover (7.907) (7.750) (7.034) (5.533)Avge Days to Collect Receivables 4.920 5.872 7.099 7.152Avge Inventory Hold<strong>in</strong>g Period 15.157 15.012 14.936 14.698Avge Days to Pay Payables 28.650 25.820 26.461 31.426PP&E Turnover 0.616 0.589 0.581 0.596Analysis of Leverage-Long-Term Capital StructureDebt to Equity Ratio 0.646 0.521 0.456 0.298 0.381FFO to Total Debt 0.471 0.604 0.620 0.896CFO to Total Debt 0.475 0.650 0.710 1.118Analysis of Leverage- Short-Term LiquidityCurrent Ratio 0.426 0.431 0.439 0.427 0.326Quick Ratio 0.257 0.230 0.245 0.263 0.180EBIT Interest Coverage 8.635 7.769 8.604 11.825 14.190EBITDA Interest Coverage 10.788 9.805 10.866 14.817 17.664