Spain Caja Espana de Inversiones, Caja de Ahorros ... - Caja España
Spain Caja Espana de Inversiones, Caja de Ahorros ... - Caja España
Spain Caja Espana de Inversiones, Caja de Ahorros ... - Caja España
You also want an ePaper? Increase the reach of your titles
YUMPU automatically turns print PDFs into web optimized ePapers that Google loves.
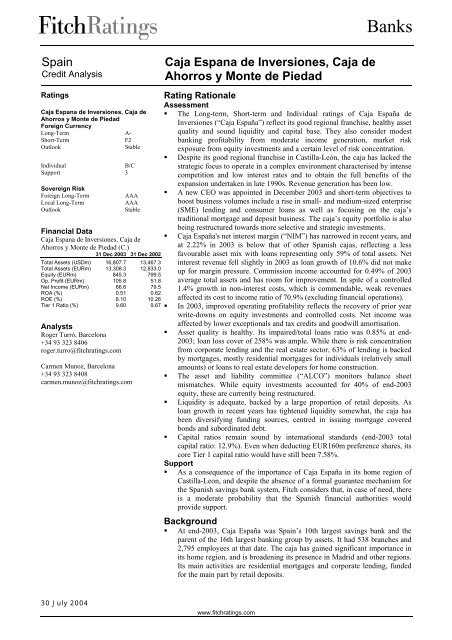
Banks<strong>Spain</strong>Credit AnalysisRatings<strong>Caja</strong> <strong>Espana</strong> <strong>de</strong> <strong>Inversiones</strong>, <strong>Caja</strong> <strong>de</strong><strong>Ahorros</strong> y Monte <strong>de</strong> PiedadForeign CurrencyLong-Term A-Short-TermF2OutlookStableIndividualB/CSupport 3Sovereign RiskForeign Long-TermLocal Long-TermOutlookAAAAAAStableFinancial Data<strong>Caja</strong> <strong>Espana</strong> <strong>de</strong> <strong>Inversiones</strong>, <strong>Caja</strong> <strong>de</strong><strong>Ahorros</strong> y Monte <strong>de</strong> Piedad (C.)31 Dec 2003 31 Dec 2002Total Assets (USDm) 16,807.7 13,467.3Total Assets (EURm) 13,308.3 12,833.0Equity (EURm) 845.3 799.5Op. Profit (EURm) 105.8 51.8Net Income (EURm) 66.6 79.5ROA (%) 0.51 0.62ROE (%) 8.10 10.26Tier 1 Ratio (%) 9.60 9.67AnalystsRoger Turró, Barcelona+34 93 323 8406roger.turro@fitchratings.comCarmen Munoz, Barcelona+34 93 323 8408carmen.munoz@fitchratings.com<strong>Caja</strong> <strong>Espana</strong> <strong>de</strong> <strong>Inversiones</strong>, <strong>Caja</strong> <strong>de</strong><strong>Ahorros</strong> y Monte <strong>de</strong> PiedadRating RationaleAssessment• The Long-term, Short-term and Individual ratings of <strong>Caja</strong> España <strong>de</strong><strong>Inversiones</strong> (“<strong>Caja</strong> España”) reflect its good regional franchise, healthy assetquality and sound liquidity and capital base. They also consi<strong>de</strong>r mo<strong>de</strong>stbanking profitability from mo<strong>de</strong>rate income generation, market riskexposure from equity investments and a certain level of risk concentration.• Despite its good regional franchise in Castilla-León, the caja has lacked thestrategic focus to operate in a complex environment characterised by intensecompetition and low interest rates and to obtain the full benefits of theexpansion un<strong>de</strong>rtaken in late 1990s. Revenue generation has been low.• A new CEO was appointed in December 2003 and short-term objectives toboost business volumes inclu<strong>de</strong> a rise in small- and medium-sized enterprise(SME) lending and consumer loans as well as focusing on the caja’straditional mortgage and <strong>de</strong>posit business. The caja’s equity portfolio is alsobeing restructured towards more selective and strategic investments.• <strong>Caja</strong> España's net interest margin (“NIM”) has narrowed in recent years, andat 2.22% in 2003 is below that of other Spanish cajas, reflecting a lessfavourable asset mix with loans representing only 59% of total assets. Netinterest revenue fell slightly in 2003 as loan growth of 10.6% did not makeup for margin pressure. Commission income accounted for 0.49% of 2003average total assets and has room for improvement. In spite of a controlled1.4% growth in non-interest costs, which is commendable, weak revenuesaffected its cost to income ratio of 70.9% (excluding financial operations).• In 2003, improved operating profitability reflects the recovery of prior yearwrite-downs on equity investments and controlled costs. Net income wasaffected by lower exceptionals and tax credits and goodwill amortisation.• Asset quality is healthy. Its impaired/total loans ratio was 0.85% at end-2003; loan loss cover of 258% was ample. While there is risk concentrationfrom corporate lending and the real estate sector, 63% of lending is backedby mortgages, mostly resi<strong>de</strong>ntial mortgages for individuals (relatively smallamounts) or loans to real estate <strong>de</strong>velopers for home construction.• The asset and liability committee (“ALCO”) monitors balance sheetmismatches. While equity investments accounted for 40% of end-2003equity, these are currently being restructured.• Liquidity is a<strong>de</strong>quate, backed by a large proportion of retail <strong>de</strong>posits. Asloan growth in recent years has tightened liquidity somewhat, the caja hasbeen diversifying funding sources, centred in issuing mortgage coveredbonds and subordinated <strong>de</strong>bt.• Capital ratios remain sound by international standards (end-2003 totalcapital ratio: 12.9%). Even when <strong>de</strong>ducting EUR160m preference shares, itscore Tier 1 capital ratio would have still been 7.58%.Support• As a consequence of the importance of <strong>Caja</strong> España in its home region ofCastilla-Leon, and <strong>de</strong>spite the absence of a formal guarantee mechanism forthe Spanish savings bank system, Fitch consi<strong>de</strong>rs that, in case of need, thereis a mo<strong>de</strong>rate probability that the Spanish financial authorities wouldprovi<strong>de</strong> support.Background• At end-2003, <strong>Caja</strong> España was <strong>Spain</strong>’s 10th largest savings bank and theparent of the 16th largest banking group by assets. It had 538 branches and2,795 employees at that date. The caja has gained significant importance inits home region, and is broa<strong>de</strong>ning its presence in Madrid and other regions.Its main activities are resi<strong>de</strong>ntial mortgages and corporate lending, fun<strong>de</strong>dfor the main part by retail <strong>de</strong>posits.30 July 2004www.fitchratings.com
Banks• PROFILE• Medium-sized regional Spanish savingsbank with presence in Madrid• Seeking to shift asset mix to focus oninterest-earning business and torestructure equity investments<strong>Caja</strong> España, headquartered in León, was establishedin 1990 through a merger between five cajas fromthe provinces of León, Palencia, Valladolid andZamora. Following a period of merger-relateddifficulties, it was relaunched in 1997 with anambitious strategic plan to expand beyond itsrelatively sparsely-populated home region, andconsolidate the 104 branches acquired from Banco<strong>de</strong> Fomento in the early 1990s. Following theopening of 81 branches in 2000, the expansion hassince then slowed, particularly in 2003. Branchopenings appear to have picked up speed again in2004 (six in 1H04 and a further 10 planned in thesecond half of the year), albeit selectivelyun<strong>de</strong>rtaken.While benefiting from a good franchise in its homeregion, for many years the caja had lacked thestrategic focus to operate in a complex operatingenvironment characterised by intense competitionand low interest rates. This could be largelyattributable to a series of internal changes within thecaja’s board of directors. A new CEO was appointedin December 2003 who has already implementedshort-term measures which inclu<strong>de</strong> increasingincome generation from traditional caja business aswell as from SME and consumer loans, a moreproactive human resource management system andrestoring reputational difficulties encountered. Thecaja’s board appears to be set to leave past problemsbehind and management appears to be on the righttrack. The success of these initiatives will beimportant in restoring the caja’s profitability. <strong>Caja</strong>España is also reshaping its equity investmentportfolio. Strategic investments are likely toconcentrate on those supporting core activities (realestate and regional companies) while capital marketactivities may be scaled back to focus ongovernment and private fixed income securities.Like all cajas <strong>Caja</strong> España channels part of its yearlysurplus back into the community by means of socialand cultural projects fun<strong>de</strong>d by an on-balance sheetfund, Fondo Obra Benefico Social (“FOBS”; 23% of2003 unconsolidated net income).In 2001 the caja sold 50% of its life insurer <strong>Caja</strong>España Vida (“CEV”) to Aviva (formerly CGNU),allowing Aviva to distribute its products through thecaja’s branch network. Un<strong>de</strong>r the agreement, <strong>Caja</strong>España receives commissions on every policy soldand 50% of CEV’s profits. Capital gains ofEUR129m from the <strong>de</strong>al were entirely consigned tobuilding up general reserves (line K in the attachedspreadsheet) thus having a negligible impact on 2001results. We un<strong>de</strong>rstand that EUR62m of thesereserves have been earmarked to cover potentialpenalty claims from Aviva should the caja not meetcertain objectives inclu<strong>de</strong>d in the agreement.• PERFORMANCE• Core profitability constrained by lowrevenues, tight NIM and high costs• Bottom line profitability affected bylower exceptionals, goodwillamortisation and lower tax credits<strong>Spain</strong>’s buoyant economy (GDP growth of 2.4% in2003), together with low interest rates, has spurredloan <strong>de</strong>mand (primarily for resi<strong>de</strong>ntial mortgages),which has proved instrumental in supporting netinterest revenue at most banks. However, in the caseof <strong>Caja</strong> España, loan growth of 10.6% in 2003(2002: 10%) was more mo<strong>de</strong>rate than at otherSpanish banks and was not sufficient to support netinterest revenue, which <strong>de</strong>clined by 1.2%. Thisreflects a competitive and low interest rateenvironment, a sparsely-populated home region withlimited business opportunities and the strategicdifficulties encountered. The latter two resulted inlower lending volumes. <strong>Caja</strong> España’s NIM isaffected by a less favourable asset mix than at otherPerformance<strong>Caja</strong> EspañaPeer Group Average*Large & Medium Sized <strong>Caja</strong>s 2003 2002 2001 2000 2003 2002 2001 2000Net Income/Av Equity 8.10 10.26 10.18 13.95 12.38 12.37 13.3 14.39Net Income/Av Assets 0.51 0.62 0.61 0.86 0.95 0.96 1.02 1.08Operating Profit/Av Assets 0.80 0.40 0.30 1.42 1.20 1.12 1.31 1.21Op. Prof. bef. Prov/Av Assets 1.10 0.61 0.70 1.37 1.55 1.44 1.69 1.47Cost/Income 64.34 75.40 73.76 61.04 57.00 59.60 56.27 60.48Cost/Income Ex Fin. Ops. 70.88 70.23 73.12 73.64 61.39 60.65 61.01 62.52Costs/Av Assets 1.93 1.95 2.02 2.18 1.83 1.89 1.96 2.09NIM 2.22 2.30 2.28 2.43 2.41 2.55 2.68 2.69Equity/Assets 6.35 6.23 5.81 5.81 7.91 7.81 7.71 7.61* Cataluña, Bancaja, BBK, España, CAM, Galicia, Unicaja, Ibercaja, Kutxa, Duero, CaixanovaSource: <strong>Caja</strong> España and financial statements of the banks inclu<strong>de</strong>d in the peer group<strong>Caja</strong> <strong>Espana</strong> <strong>de</strong> <strong>Inversiones</strong>, <strong>Caja</strong> <strong>de</strong> <strong>Ahorros</strong> y Monte <strong>de</strong> Piedad: July 20042
Bankscajas, with loans representing only 59% of totalassets at end-2003. This, coupled with a low level ofcommissions and write-downs on the caja’s equitysecurities portfolio between 2000 and 2002, resultedin a below peer group average pre-provisionoperating profitability. It is worth noting that, since2003, operating profit has recovered an upward trendthanks to growing commission income, recovery inthe financial markets and good cost control.While operating profitability has evolved well in2003, the 16% <strong>de</strong>cline in net income is attributableto lower extraordinary items, accelerated goodwillamortisation and much lower tax credits. Tax creditsrelating to the sale of CEV and the outsourcing ofpension commitments explain the positive tax effectin 2001 and 2002. It is worth noting that 2002 netincome was also boosted by the release of EUR51mfrom special reserves, helping to temper the effect oflarge write-downs from equity investments. In 2003,<strong>Caja</strong> España recor<strong>de</strong>d EUR20m in acceleratedgoodwill amortisation on equity investments.Table 2 - Other Operating Income(EURm) 2003 2002 2001Commission Income 72.6 67.8 63.4Investment Fund Management 24.5 22.5 21.1Collection + Payment Handling 36.5 34.5 31.0Securities Brokerage 4.6 4.1 4.0Guarantees 4.9 4.7 4.5Other Fees 2.1 2.0 2.8Commission Paid 7.8 8.6 8.8Net Commission Income 64.8 59.2 54.6Income from Fin. Mkt. Ops 36.5 -24.5 -2.8- of which Eq. inv recovery 13.2 -52.1 -18.5(write-down)Other Income 1.4 1.6 1.6Share in Profits from Equity4.3 -3.6 -1.8Accounted AffiliatesTotal Non-Interest Income 107.0 32.7 51.6Source: <strong>Caja</strong> EspañaNet interest revenue remains the main source ofrevenues, accounting for 73% of total operatingincome in 2003, while net commission incomeaccounted for a further 16% of revenues. In terms ofincome from financial market operations, while 2001and 2002 results were dampened by unfavourablemarket conditions as reflected in Table 2, in 2003,the recovery in the equity markets assisted in thereversal of previous write-downs (EUR13.2m). Thecaja also benefited from gains on the sale of fixedincome securities (EUR16.6m). Net commissionincome has been growing in recent years (9.5% in2003), mainly from commissions on collection andpayment-handling services. Investment fundmanagement income held up well in 2003. However,commission income only represented 0.49% ofaverage total assets at end-2003 and has room toimprove.Its cost/income ratio excluding financial operationsreflects poor cost efficiency, un<strong>de</strong>rlining weak coreincome generation and a relatively high cost basefrom strong expansion in the late 1990s and 2000.The success in management’s efforts to increaserevenues and a more dynamic management of humanresources will be vital in improving cost efficiency.Prospects: Any improvement in <strong>Caja</strong> España’sLong-term rating and profitability will be highly<strong>de</strong>pen<strong>de</strong>nt on its ability to improve core incomegeneration (including recurrent commission income),reduce exposure to volatile financial markets, honeefficiency and achieve a more focused strategy whilecapitalising on a good franchise. It is clear thatefforts are being ma<strong>de</strong> by new management toaddress these issues immediately and is a positivestep forward, although it is still too soon to say howeffective these measures are. In 1H04, while a 16%rise in commission income ma<strong>de</strong> up for a <strong>de</strong>cline innet interest revenue (NIM narrowed to 2.08%), itscost to income ratio, excluding financial operations,was still high at 71% and un<strong>de</strong>rlying profitabilityremained low. Fitch will closely monitor the<strong>de</strong>ployment of strategic measures.• RISK MANAGEMENT• Healthy asset quality and loan lossreserve coverage, though some riskconcentration still exists• Restructuring equity investments butmarket risk exposure is still highThe Board of Directors, together with seniormanagement, is responsible for overall riskmanagement policies, including the <strong>de</strong>finition of<strong>de</strong>legated loan approval authorities as well as settingmarket risk policies, <strong>de</strong>legated to the ALCO, whichmeets monthly. The caja is principally exposed tocredit risk from customer and interbank lending.Exposure to market risk inclu<strong>de</strong>s structural balancesheet mismatches and a large equity investmentportfolio. Derivatives are principally employed ashedging instruments or as a service to clients.Overall risk management and investment policies areun<strong>de</strong>r review, given the arrival of new seniorexecutives. The caja is participating in a global riskmanagement project, spearhea<strong>de</strong>d by CECA in or<strong>de</strong>rto be able to comply with Basel II requirements forcalculating capital a<strong>de</strong>quacy.Credit Risk: Loan approvals are ma<strong>de</strong> on ahierarchical basis, with increasing levels of <strong>de</strong>legatedauthority at branches, regional offices, the centralrisk committee and, ultimately, executive level.Unsecured loans over EUR2m and mortgages overEUR5m are approved at executive level. Advancesun<strong>de</strong>r EUR30,000 are processed via the scoring<strong>Caja</strong> <strong>Espana</strong> <strong>de</strong> <strong>Inversiones</strong>, <strong>Caja</strong> <strong>de</strong> <strong>Ahorros</strong> y Monte <strong>de</strong> Piedad: July 20043
BanksAsset Quality Indicators – <strong>Caja</strong> España2003 2002 2001 2000 1999Past Due & Doubtful Loans (EURm) 66.9 70.9 65.10 57.10 67.90Past Due & Doubtful Loans/Total Loans (%) 0.85 0.99 1.00 0.98 1.45Loan Loss Reserves/Past Due & Doubtful Loans (%) 258.00 199.44 195.24 138.88 110.60Net Charge-Offs/Av Gross Loans (%) 0.09 0.11 0.00 (0.10) (0.17)Repossessed Properties (EURm) 20.45 20.28 24.50 27.20 33.00Assets Written-Off (EURm) 204.4 200.6 198.30 226.50 241.20Source: <strong>Caja</strong> Españasystem. At end-2003, the caja’s loan portfolio wassplit 48% individuals, 35% SMEs, 13% largecorporates and 4% public-sector. Secured loansrepresented around 63% of lending (of which c.60%comprised resi<strong>de</strong>ntial facilities and one third was toreal estate <strong>de</strong>velopers). The maximum loan-to value(“LTV”) ratio on resi<strong>de</strong>ntial properties is 80%, whilefor commercial property, it is 70%. The maturityprofile of the portfolio was essentially long-term,with 66% of exposures maturing in over five years.The bulk of the corporate loan portfolio is brokendown by sector as follows: construction and realestate 50%, manufacturing and utilities 17%,commerce and services 11%, agriculture 6% andtransport and telecommunications 6%. In terms ofrisk concentration, 37% of total exposures(combined credit and market risk) at end-2003related to facilities of less than EUR150,000 and42% (end-2002 43%) to more than EUR3m. Thisrelatively high concentration reflects the significantproportion of corporate and syndicated loans in theportfolio, the latter representing 10% of end-2003lending, as well as equity investments in some ofthese companies. Its 20 largest exposures at end-2003 represented 16% (2002: 17.6%) of total risk.The eight largest exposures each excee<strong>de</strong>d 10% ofend-2003 equity (2002: 7%), also highlightingconcentration, although none excee<strong>de</strong>d 18% ofequity. Of the largest risks, three related tocompanies where <strong>Caja</strong> España has equity stakes(Ebro-Puleva, Fa<strong>de</strong>sa and Retecal; see Market Risk,below), seven to real estate <strong>de</strong>velopers and three tothe public sector. While exposure to the constructionand real estate sectors have increased over the yearsand is concentrated by sector, some comfort can betaken from the fact that this is closely monitored andthat a large proportion of lending to <strong>de</strong>velopersultimately converts into individual resi<strong>de</strong>ntialmortgages and is aimed at gaining individual clients.In line with buoyant economic conditions in <strong>Spain</strong>,asset quality indicators improved in 2003. Past dueand doubtful loans to total loans fell again, to thelowest level in recent years, while loan lossprovisions increased to meet the statistical loan lossreserve requirement introduced by the Bank of <strong>Spain</strong>in July 2000.<strong>Caja</strong> España is a net len<strong>de</strong>r in the interbank market,reflecting comfortable liquidity levels. By policy,bank counterparties have Long-term ratings of ‘A-’or above and are mostly from <strong>Spain</strong> and the EU.<strong>Caja</strong> España has a relatively large fixed-incomesecurities portfolio, a large proportion of whichrelates to government <strong>de</strong>bt, which accounted for19% of total assets at end-2003. These are aimed toprotect net interest margin and the majority aretemporarily sold to banks and <strong>de</strong>positors withrepurchase agreements. Its private fixed-incomeportfolio accounted for 3% of total assets at end-2003. The portfolio largely relates to Spanish andEuropean investment gra<strong>de</strong> issuers and thebreakdown by sector is roughly as follows: 32%securitisation vehicles (highly rated tranches), 24%TMT and 21% utilities. Unrealised capital gainsfrom the government securities portfolio totalledEUR97m at end-2003, while for the private fixedincome portfolio this amount was EUR18.6m,largely stemming from the TMT and utilitiesportfolios.Market Risk: Interest rate, foreign currency andliquidity risks are managed by the ALCO, whichuses scenario, duration, stress-testing and sensitivityanalyses. Balance sheet mismatches are generallydue to short-term <strong>de</strong>posits funding long-term lending.The risk is minimised by having a large proportionof loans at floating-rate and EUR-<strong>de</strong>nominated andby asset and liability management. Managementestimates that a 1% <strong>de</strong>crease/increase in interest rateswould lead to a 2.8% <strong>de</strong>crease/increase in netinterest margin, respectively.Equity investments represented 40% of end-2003equity. A basic Value at Risk (“VaR”) system is inuse to control equity investments, although it isworth pointing out that this, as well as policiesbehind equity investments, are un<strong>de</strong>r review bymanagement. Strategic equity holdings are structuredun<strong>de</strong>r a holding called Invergestion (gross holdingsof around EUR250m at end-2003). A largeproportion of these are equity-accounted affiliatesincluding Ebro-Puleva (5%; agribusiness), BancoPastor (4.9%, a Spanish regional bank) andFADESA (2003: 5.5%; 1H04: 3.3%; an important<strong>Caja</strong> <strong>Espana</strong> <strong>de</strong> <strong>Inversiones</strong>, <strong>Caja</strong> <strong>de</strong> <strong>Ahorros</strong> y Monte <strong>de</strong> Piedad: July 20044
BanksSpanish real estate company). Invergestion alsoholds some of the caja’s stakes in regionalcompanies as well as in specialised companiesclosely related to the caja’s business (such as CEV).Of the remaining investments, around EUR100mwere holdings in shares of a broad range of Spanishand international companies and EUR46m wereholdings in a variety of investment funds. Withregards to the total portfolio, the main sectors inwhich investments had been ma<strong>de</strong> at end-2003 were:telecoms 23%, banks 18%, agribusiness 15%,electricity utilities 14% and construction and realestate 9%. Unrealised losses from the equityportfolio totalled EUR56m at end-2003 whileunrealised gains totalled EUR45.3m. Unrealisedlosses are fully covered by reserves, reflecting theabsence of unbreachable stop-loss limits. The limitsof EUR30m and EUR300m on equity trading andlisted investment portfolios respectively are currentlyun<strong>de</strong>r review.• FUNDING AND CAPITAL• Strong retail <strong>de</strong>positor base• Ample core capital<strong>Caja</strong> España’s main funding source is retail <strong>de</strong>posits,accounting for 59% of end-2003 total liabilities an<strong>de</strong>quity, which grew by 6% in 2003. ‘Other’ <strong>de</strong>positsand money market funding largely relate togovernment securities sold to banks and <strong>de</strong>positorswith repurchase agreements; EUR125m of thiscaption related to commercial paper issues. Liquidityis good, supported by a large proportion of stable<strong>de</strong>posits and active management. Nevertheless,growth in lending outpaced that of <strong>de</strong>posits in 2003and resulted in a need to access alternative fundingsources. Like with most cajas, this has mainly beenthrough covered bond issuance in 2003. By year end,<strong>Caja</strong> España had issued EUR945m in CédulasHipotecarias (mortgage covered bonds, of whichEUR600m was to the institutional market throughmulti-originator programmes and EUR300m issuedin 2003) and EUR100m in Cédulas Territoriales(public sector covered bonds). There has been acertain <strong>de</strong>gree of <strong>de</strong>pen<strong>de</strong>nce on one funding source,although financial costs were favourable and this hashelped to lengthen the maturity structure of itsliabilities, tempering the effects of short-term<strong>de</strong>posits funding long-term loans. While coveredbond issuance potentially weakens the position of thesenior unsecured creditors, the caja had issuedagainst 47% of the eligible portfolio at end-2003which is below the 90% regulatory limit.Furthermore the amount issued only accounted foraround 18% of the caja’s total mortgage book andsignificant collateral is still available for both thesecured and unsecured creditors.The caja reported total and tier 1 capital ratios of12.91% and 9.6%, respectively, at end-2003. Equityinclu<strong>de</strong>d EUR160m preference shares that Fitchregards as a weaker form of capital. Nevertheless,even excluding these preference shares (24% ofcommon equity at end-2003), the caja is wellcapitalised with a core Tier 1 ratio of 7.58%.<strong>Caja</strong> <strong>Espana</strong> <strong>de</strong> <strong>Inversiones</strong>, <strong>Caja</strong> <strong>de</strong> <strong>Ahorros</strong> y Monte <strong>de</strong> Piedad: July 20045
BanksBalance Sheet AnalysisCAJA ESPANA DE INVERSIONES, CAJA DE AHORROS Y MONTE DE PIEDAD (C.)31 Dec 2003 31 Dec 2002 31 Dec 2001 31 Dec 2000Year End Year End As % of Average Year End As % of Year End As % of Year End As % ofUSDm EURm Assets EURm EURm Assets EURm Assets EURm AssetsOriginal Original Original Original Original Original Original Original Original OriginalA. LOANS1. Commercial Loans & Bills 374.0 296.1 2.22 305.9 315.7 2.46 337.9 2.62 327.7 2.932. Other Loans 2,837.8 2,247.0 16.88 2,258.2 2,269.4 17.68 2,326.2 18.02 2,409.9 21.583. Secured Loans 6,322.9 5,006.5 37.62 4,580.7 4,154.8 32.38 3,429.1 26.56 2,686.9 24.064. Public Sector Loans 411.8 326.1 2.45 355.7 385.2 3.00 377.2 2.92 376.8 3.375. Loans to Non Resi<strong>de</strong>nts 36.0 28.5 0.21 24.4 20.2 0.16 20.1 0.16 30.1 0.276. (Loan Loss Reserves) 218.0 172.6 1.30 157.0 141.4 1.10 127.1 0.98 79.3 0.71TOTAL A 9,764.6 7,731.6 58.10 7,367.8 7,003.9 54.58 6,363.4 49.29 5,752.1 51.52B. OTHER EARNING ASSETS1. Deposits with Banks 1,595.9 1,263.6 9.49 1,366.3 1,468.9 11.45 1,612.6 12.49 1,007.1 9.022. Bank of <strong>Spain</strong> 0.0 0.0 0.00 0.0 0.0 0.00 0.0 0.00 0.0 0.003. Government Securities 3,231.4 2,558.6 19.23 2,620.0 2,681.4 20.89 2,630.5 20.37 2,589.2 23.194. Other Fixed Int Securities 559.6 443.1 3.33 421.6 400.1 3.12 419.2 3.25 449.1 4.025. Equity Investments 430.3 340.7 2.56 332.4 324.1 2.53 391.8 3.03 428.4 3.84TOTAL B 5,817.1 4,606.0 34.61 4,740.3 4,874.5 37.98 5,054.1 39.15 4,473.8 40.07C. TOTAL EARNING ASSETS (A+B) 15,581.7 12,337.6 92.71 12,108.0 11,878.4 92.56 11,417.5 88.43 10,225.9 91.58D. FIXED ASSETS 353.4 279.8 2.10 268.1 256.3 2.00 275.8 2.14 291.8 2.61E. NON-EARNING ASSETS1. Due from Banks 88.2 69.8 0.52 54.2 38.5 0.30 572.3 4.43 77.3 0.692. Bank of <strong>Spain</strong> 305.8 242.1 1.82 238.6 235.0 1.83 181.2 1.40 147.0 1.323. Other 478.7 379.0 2.85 401.9 424.8 3.31 464.3 3.60 423.8 3.80F. TOTAL ASSETS 16,807.7 13,308.3 100.00 13,175.5 12,833.0 100.00 12,911.1 100.00 11,165.8 100.00G. DEPOSITS & MONEY MARKET FUNDING1. Demand Deposits 1,763.6 1,396.4 10.49 1,303.0 1,209.6 9.43 1,108.9 8.59 1,021.9 9.152. Savings Deposits 3,442.0 2,725.4 20.48 2,598.6 2,471.8 19.26 2,314.2 17.92 2,103.7 18.843. Time Deposits 4,627.4 3,664.0 27.53 3,680.0 3,696.0 28.80 3,223.4 24.97 2,938.8 26.324. Interbank Deposits 284.9 225.6 1.70 264.7 303.8 2.37 551.4 4.27 876.0 7.855. Other 3,293.3 2,607.6 19.59 2,726.4 2,845.2 22.17 2,747.3 21.28 2,465.8 22.08TOTAL G 13,411.2 10,619.0 79.79 10,572.7 10,526.4 82.03 9,945.2 77.03 9,406.2 84.24H. OTHER FUNDING1. Subordinated Debt 324.1 256.6 1.93 206.6 156.6 1.22 156.6 1.21 156.6 1.402. Other Borrowings 1,349.5 1,068.5 8.03 930.2 791.8 6.17 908.3 7.04 456.8 4.093. Hybrid Capital 0.0 0.0 0.00 0.0 0.0 0.00 0.0 0.00 0.0 0.00I. OTHER (Non-Interest Bearing) 428.8 339.5 2.55 352.6 365.7 2.85 919.0 7.12 375.0 3.36J. LOAN LOSS RESERVES (See A Above)K. SPECIAL RESERVES 226.6 179.4 1.35 186.2 193.0 1.50 231.7 1.79 122.1 1.09L. EQUITY1. Preference Shares 203.5 161.1 1.21 160.5 159.9 1.25 160.0 1.24 100.0 0.902. Common Equity 864.1 684.2 5.14 661.9 639.6 4.98 590.3 4.57 549.1 4.92TOTAL L 1,067.6 845.3 6.35 822.4 799.5 6.23 750.3 5.81 649.1 5.81M. TOTAL LIABILITIES & EQUITY 16,807.7 13,308.3 100.00 13,175.5 12,833.0 100.00 12,911.1 100.00 11,165.8 100.00Exchange Rate USD1 = EUR 0.7918 USD1 = EUR 0.9536 USD1 = EUR 1.1347 USD1 = EUR 1.0747<strong>Caja</strong> <strong>Espana</strong> <strong>de</strong> <strong>Inversiones</strong>, <strong>Caja</strong> <strong>de</strong> <strong>Ahorros</strong> y Monte <strong>de</strong> Piedad: July 20046
BanksIncome Statement AnalysisCAJA ESPANA DE INVERSIONES, CAJA DE AHORROS Y MONTE DE PIEDAD (C.)31 Dec 2003 31 Dec 2002 31 Dec 2001 31 Dec 2000Income As % of Income As % of Income As % of Income As % ofExpenses Total AV Expenses Total AV Expenses Total AV Expenses Total AVEURm Earning Assts EURm Earning Assts EURm Earning Assts EURm Earning AsstsOriginal Original Original Original Original Original Original Original1. Interest Income 495.9 4.10 558.7 4.80 575.4 5.32 466.3 4.962. Interest Expense 202.9 1.68 262.1 2.25 307.2 2.84 223.0 2.373. NET INTEREST REVENUE 293.0 2.42 296.6 2.55 268.2 2.48 243.3 2.594. Net Fees & Commissions 64.8 0.54 59.2 0.51 54.6 0.50 51.3 0.555. Other Operating Income 42.2 0.35 -26.5 -0.23 -3.0 -0.03 62.9 0.676. Personnel Expenses 158.9 1.31 150.2 1.29 141.0 1.30 130.4 1.397. Other Operating Expenses 95.7 0.79 100.8 0.87 96.2 0.89 87.5 0.938. Loan Loss Provisions 39.6 0.33 26.5 0.23 47.0 0.43 -2.6 -0.039. OPERATING PROFIT 105.8 0.87 51.8 0.44 35.6 0.33 142.2 1.5110. Other Income and Expenses -33.5 -0.28 -13.4 -0.12 -10.5 -0.10 -3.8 -0.0411. PROFIT BEFORE EXCEPTIONAL ITEMS 72.3 0.60 38.4 0.33 25.1 0.23 138.4 1.4712. Exceptional Items 12.0 0.10 36.3 0.31 40.4 0.37 -21.8 -0.2313. PRE-TAX PROFIT 84.3 0.70 74.7 0.64 65.5 0.61 116.6 1.2414. Taxes 17.7 0.15 -4.8 -0.04 -5.7 -0.05 30.5 0.3215. Published Net Income Including Minorities 66.6 0.55 79.5 0.68 71.2 0.66 86.1 0.9116. FITCH NET INCOME before Appropriationsand Extraordinary Items 66.6 0.55 79.5 0.68 71.2 0.66 86.1 0.91Ratio Analysis31 Dec 2003 31 Dec 2002 31 Dec 2001 31 Dec 2000Original Original Original OriginalI. PROFITABILITY LEVEL1. Net Income/Equity (av) % 8.10 10.26 10.18 13.952. Net Income less PreferenceDivi<strong>de</strong>nd/Common Equity (av) % 8.90 11.68 11.59 15.673. Net Income/Total Assets (av) % 0.51 0.62 0.61 0.864. Pre-Tax Profit/Total Assets (av) % 0.64 0.58 0.56 1.175. Operating Profit/Total Assets (av) % 0.80 0.40 0.30 1.426. Cost/Income % 64.34 75.40 73.76 61.047. Net Interest Rev/Total Assets (av) % 2.22 2.30 2.28 2.43II. CAPITAL ADEQUACY (Year End)1. Internal Capital Generation % 5.34 6.59 6.79 9.532. Equity/Total Assets % 6.35 6.23 5.81 5.813. Common Equity/Total Assets % 5.14 4.98 4.57 4.924. Free Capital/Banking Assets % 13.53 10.98 11.34 8.255. Capital/Risks - Tier 1 % 9.60 9.67 8.96 9.226. Capital/Risks - Total % 12.91 12.22 11.78 11.62III. LIQUIDITY (Year End)1. Liquid Assets/Deposits & Money Mkt Funding % 30.30 29.60 29.60 38.212. Liquid Assets & Marketable DebtSecurities/Deposits & Money Mkt Funding % 43.10 42.03 50.24 40.623. Gross Loans/Deposits Excl. Money Mkt Funds % 101.52 96.85 97.65 96.16IV. ASSET QUALITY1. Provisions for Loan Losses/Gross Loans (av) % 0.53 0.39 0.76 -0.052. Provisions for Loan Losses/Profitbefore Provisions and taxes % 31.96 26.19 41.78 -2.283. Loan Loss Reserves/Impaired Loans % 258.00 199.44 195.24 138.884. Loan Loss Reserves/Gross Loans % 2.18 1.98 1.96 1.365. Gross Impaired Loans/Gross Loans % 0.85 0.99 1.00 0.986. Net Impaired Loans/Equity % -12.50 -8.82 -8.26 -3.427. Net Charge-Offs/Gross Loans (av) % 0.09 0.11 0.00 -0.10<strong>Caja</strong> <strong>Espana</strong> <strong>de</strong> <strong>Inversiones</strong>, <strong>Caja</strong> <strong>de</strong> <strong>Ahorros</strong> y Monte <strong>de</strong> Piedad: July 20047
BanksSPREAD SHEET ANNEXCAJA ESPANA DE INVERSIONES CAMP(EURm) 2003 2002 2001 20001. MOVEMENT IN COMMON EQUITYBalance at 1 st January 639.6 590.3 549.1 485.0Retained earnings 43.9 49.3 43.8 60.3Transfer to pension allowance 0.0 0.0 0.0 (9.0)Other (net) 0.7 0.0 2.6 12.8Balance at 31 st December 684.2 639.6 590.3 549.12. EU CAPITAL ADEQUACY DATATier 1 Capital 766.7 697.1 621.6 572.3Total Capital 1,031.6 880.7 816.9 720.9Weighted Risks - Total 7,988.8 7,209.5 6,934.6 6,201.63. DISTRIBUTIONS DEDUCTED FROM EQUITYAND INTERNAL CAPITAL GENERATIONWelfare fund 15.0 22.2 22.2 22.2Preference share divi<strong>de</strong>nd 7.7 7.7 5.1 5.04. NET INCOME IN USDm AT YEAR-ENDRATES 84.1 83.4 64.4 80.15. PROVISIONS FOR LOAN LOSSESLoan loss provisions (net of reversals) 39.3 29.6 51.4 19.0Recovery of loans previously written-off (3.2) (6.8) (5.3) (22.2)Amortisation 1.6 2.9 1.7 2.1Other 1.9 0.8 (0.8) 4.1Total 39.6 26.5 47.0 3.16. MOVEMENT IN LOAN LOSS RESERVESBalance at 1 st January 141.4 127.1 79.3 75.1Loan loss provisions (net of reversals) 39.3 29.6 51.4 19.0Amounts charged-off (8.1) (15.3) (3.5) (14.8)Transfer (to)/from equity 0.0 0.0 0.0 0.0Balance at 31 st December 172.6 141.4 127.1 79.37. FUNDS UNDER MANAGEMENTMutual funds 1,826.6 1,552.5 1,552.8 1,377.1Pension funds 325.1 249.8 220.3 n.a.8. EXTERNAL AUDITORS: Deloitte9. PRESENTATION OF ACCOUNTSImpaired lending per Spanish accounting inclu<strong>de</strong>s all past due and doubtful loans. Past due loans inclu<strong>de</strong> any payment(interest and/or repayment instalment) on a loan which is more than 90 days overdue. The full loan is classified as past duewhen overdue payments exceed 25% of the outstanding principal and when any payment is more than 12 months overdue (6months for loans to individuals). In addition, all the bank's exposure to a particular group of borrowers is classified as pastdue when the sum of its past due exposures to that group exceeds 25% of the total group exposure. Doubtful loans inclu<strong>de</strong>any loan for which there is reasonable doubt of payment. Once any payment becomes past due, non-paid interest is ad<strong>de</strong>d tothe loan and then all interest is then placed on a non-accrual basis.<strong>Caja</strong> <strong>Espana</strong> <strong>de</strong> <strong>Inversiones</strong>, <strong>Caja</strong> <strong>de</strong> <strong>Ahorros</strong> y Monte <strong>de</strong> Piedad: July 20048
BanksCopyright © 2004 by Fitch, Inc., Fitch Ratings Ltd. and its subsidiaries. One State Street Plaza, NY, NY 10004.Telephone: 1-800-753-4824, (212) 908-0500. Fax: (212) 480-4435. Reproduction or retransmission in whole or in part is prohibited except by permission. All rights reserved. All of theinformation contained herein is based on information obtained from issuers, other obligors, un<strong>de</strong>rwriters, and other sources which Fitch believes to be reliable. Fitch does not audit orverify the truth or accuracy of any such information. As a result, the information in this report is provi<strong>de</strong>d “as is” without any representation or warranty of any kind. A Fitch rating is anopinion as to the creditworthiness of a security. The rating does not address the risk of loss due to risks other than credit risk, unless such risk is specifically mentioned. Fitch is notengaged in the offer or sale of any security. A report providing a Fitch rating is neither a prospectus nor a substitute for the information assembled, verified and presented to investors bythe issuer and its agents in connection with the sale of the securities. Ratings may be changed, suspen<strong>de</strong>d, or withdrawn at anytime for any reason in the sole discretion of Fitch. Fitch doesnot provi<strong>de</strong> investment advice of any sort. Ratings are not a recommendation to buy, sell, or hold any security. Ratings do not comment on the a<strong>de</strong>quacy of market price, the suitability ofany security for a particular investor, or the tax-exempt nature or taxability of payments ma<strong>de</strong> in respect to any security. Fitch receives fees from issuers, insurers, guarantors, otherobligors, and un<strong>de</strong>rwriters for rating securities. Such fees generally vary from US$1,000 to US$750,000 (or the applicable currency equivalent) per issue. In certain cases, Fitch will rateall or a number of issues issued by a particular issuer, or insured or guaranteed by a particular insurer or guarantor, for a single annual fee. Such fees are expected to vary from US$10,000to US$1,500,000 (or the applicable currency equivalent). The assignment, publication, or dissemination of a rating by Fitch shall not constitute a consent by Fitch to use its name as anexpert in connection with any registration statement filed un<strong>de</strong>r the United States securities laws, the Financial Services and Markets Act of 2000 of Great Britain, or the securities laws ofany particular jurisdiction. Due to the relative efficiency of electronic publishing and distribution, Fitch research may be available to electronic subscribers up to three days earlier than toprint subscribers.<strong>Caja</strong> <strong>Espana</strong> <strong>de</strong> <strong>Inversiones</strong>, <strong>Caja</strong> <strong>de</strong> <strong>Ahorros</strong> y Monte <strong>de</strong> Piedad: July 20049


