Integration Of Water Losses In Veolia Water's ... - Iwa-waterloss.org
Integration Of Water Losses In Veolia Water's ... - Iwa-waterloss.org
Integration Of Water Losses In Veolia Water's ... - Iwa-waterloss.org

You also want an ePaper? Increase the reach of your titles
YUMPU automatically turns print PDFs into web optimized ePapers that Google loves.
<strong><strong>In</strong>tegration</strong> <strong>Of</strong> <strong>Water</strong> <strong>Losses</strong> <strong>In</strong> <strong>Veolia</strong> <strong>Water</strong>’s Drinking<strong>Water</strong> Networks Asset Management Strategy And ToolsM Le Quiniou*, AC Sandraz**Technical Division - <strong>Veolia</strong> <strong>Water</strong>, 1 rue Giovanni Battista Pirelli, Immeuble Battista B, 94410 Saint Maurice,FRANCEKeywords: <strong>Water</strong> loss; Natural Rate of Rise (NRR); optimization tool; investment and operational planningAbstractThe management of water losses and continuity of supply on a drinking water networks is one ofthe principal tasks of drinking water network operators. If several tools and methodologies alreadyexist to manage each of these topics on the short term, a new methodology, asset management,has to be created to integrate them in a long term approach. <strong>In</strong>deed, taken one by one, thetechnical procedures for optimization on each of the performance axes supposes good knowledgeand control of networks at a local level. Simultaneous management on all axes is more complexbut can provide many technical and economical optimization possibilities between investments andoperations in the short and in the long term.This article presents integration of water loss management in <strong>Veolia</strong> <strong>Water</strong>’s Asset Management(AM) strategy and introduces an innovative tool for AM of drinking water networks, VISION.INTRODUCTIONThe technical performance of a drinking water distribution network may be evaluated onthe basis of three main criteria which are:- distribution of excellent quality water,- continuity of water distribution at a sufficient pressure,- preservation of water resources.On the short term operational practices can contribute to maintain and even improvethe network’s technical performance. On the long term, performance management impliesother stakes as maintenance will not be able to compensate indefinitely for the network’s“natural” ageing. <strong>In</strong> this context, any renewal effort granted today is a guarantee fortomorrow’s performance. However, in simultaneous management of these performanceobjectives, any unbalanced focus on one of the axes could lead to decisions potentiallydamageable to the other axes. Simultaneous management of these performanceobjectives implies continuous technical and economical choices between renewal andmaintenance solutions and is therefore at the centre of an asset management strategy.<strong><strong>In</strong>tegration</strong> of water loss in an asset management strategyActive Leakage Control (ALC) and leak repairs are necessary to tackle real losses.However this has to be done efficiently to save the maximum volume of water whilelimiting operational expenditures. To manage water loss efficiently, operators needmethods and tools to program ALC level and to evaluate the means needed to reach agiven performance. On the short term, the analysis of the Natural Rate of Rise (NRR)(UKWIR, 2006) in leakage on each District Metered Area (DMA) can bring usefulinformation to do this.The calculation of both types of NRR (detectable and total NRR) for each of the network’sDMA allows the evaluation of savings in terms of water volume made thanks to the ALCand repair policy. By comparing these savings with the costs induced by ALC and repairs,it is possible to evaluate the efficiency of the actions undertaken and then to define the- 1 -
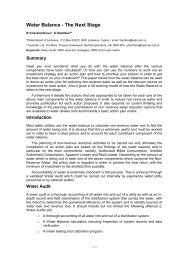
ALC strategy for each DMA. Besides, at the network level, it allows the evaluation of coststo achieve performance targets (on the short term).Analysis of water losses over the last past yearsThe analysis of what has been done and what has been achieved in terms of ALC is anunavoidable step to improve short-term strategy of ALC and to elaborate a long-termmodel. This analysis at the DMA level will allow to:- define the water balance of each DMA to calculate the real loss level,- study the repair time,- calculate the cost of ALC and repairs,- have a first overlook of the asset conditions of the DMA,- make a technical and economical balance of ALC policy and repairs,- link the level of ALC and the number of reported and detected leaks repairs.Evaluation of the asset condition regarding water lossesThe first overlook of the asset condition of the DMA consists in comparing for each DMA:- the level of ALC,- the rate of failure (both reported and detected leaks 1 , on connections and mains),- the water loss performance.Without the information of level of ALC it would be impossible to determine if a high rate offailure is due to very bad asset condition or to a high level of ALC. An example of theresults obtained is shown on the following figure. On this example:- DMA 3 to DMA 6 have poor asset condition, indeed despite a high level of ALCand a high failure rate (and thus rate of repairs), the water loss performance is low.- DMA 21 to DMA 24 have good condition asset, indeed the level of ALC and thefailure rate are low and the water loss performance is high.<strong>In</strong> terms of ALC strategy and networks survey, this means that on good condition DMA,the ALC should only be curative; no systematic actions need to be undertaken. Thus, ALCcould be shared among the other DMAs and especially the ones with poor assetcondition.Figure 1.1 Overlook of the asset condition of the DMAs1 The Technical Division of <strong>Veolia</strong> <strong>Water</strong> has established the definition for reported and detected leaks in order to allowthe operators to make the difference in the reporting database.- A reported leak is a leak that would have been repaired even if no ALC have been done. It could be sometimesnecessary to use ALC device in order to locate precisely the leaks in the street.- A detected leak is a leak that would have not been repaired if no ALC have been done. The number of detectedleaks is directly linked to the ALC level.The term “failure” is used to describe a leak without knowing if it is a reported or a detected one.- 2 -
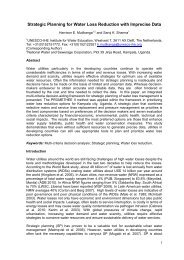
Technical and economical analysis of ALC benefitsThis first technical analysis has to be completed by an economical one. Only aneconomical and technical study can help to share the ALC among the critical DMAs, itconsists in comparing the savings made thanks to ALC and detected leaks repairs to theircosts.The data needed to complete this part of the study are the following ones for all DMA:- Marginal costs of water. An average cost for all the networks is not differential. TheDMA approach takes into account the re-pumping stations between the waterproduction plant and the DMA. <strong>In</strong> general, energy represents the most importantpart of the marginal cost of water.- ALC costs. There could have different type of ALC on a DMA :o Preventive ALC done according to a specific program in order to inspect allthe network (or at least a high proportion of the network),o Curative ALC done because of an increase of Minimum Night Flow (MNF),for instance,o Or to precise location of reported leaks.A specific reporting has to be done to calculate ALC costs at the DMA level. If it isonly done at the network level, a method has to be used to share the global costsamong all the DMAs.- Repairs cost (on connection and mains).The evaluation of the savings made is done by the calculation of the NRR. Themethod of calculation is the one recommended by UKWIR (UKWIR, 2006) based on thenightline approach. It consists in measuring the average growth of the nightline betweentwo repairs date of detected leaks (the detectable NRR) or between all the repairs dates,both reported and detected leaks (the total NRR).Thus, the detectable NRR represents the growth of the nightline if no detected leak hasbeen repaired while the total NRR represents the growth of the nightline if no leak (neitherdetected, nor reported leak) has been repaired on the DMA.By integrated the difference between both NRR calculations and the nightline, it ispossible to evaluate the water savings by repairing detected and reported leaks as shownon the following picture.Figure 1.2 Quantification of water volume savings thanks to ALC and leaks repairsThe next figure illustrates the results obtained on some DMAs. It shows that despitelot of water savings, ALC and repairs is not always economical (i.e. the costs are superiorto the cost of the water savings).- 3 -
Figure 1.3 Technical and economical balance of ALC and detected leaks repairsShort-term ALC strategy should take into account several factors that are often veryspecific for each drinking water network (and sometimes for each DMA of a network):- <strong>Water</strong> scarcity depends on the water loss performance of the network/DMA,- Marginal cost of water, above all if water is purchased to another drinking waternetworks or if there are a lot of pumping stations to supply water on the consideredDMA,- Other environmental problems like zones where:oThere are geotechnics risks so where the smallest leak can lead to alandslide for instance,o The pipes are located in water sheet and it is necessary to step in quicklyto have a chance to detect it (above all while using acoustic method)whatever the size of the leak.This list of priority is then adjusted by defining the optimal frequency of ALC per DMA.<strong>In</strong>deed knowing the natural rate of rise in leakage, it is possible to define the time at whichthe cost of the water lost would be equal to the costs of ALC campaign on a DMA. Thistime is the Economic Frequency of <strong>In</strong>tervention (Lambert and Fantozzi, 2005).This approach could be efficient to maintain or to improve the performance of theDMAs and the global one of the networks. However, on long-term, ALC cannot bescheduled without taken into account the aging of the mains. The long-term assetmanagement strategy should take into account these both parameters, for that purpose,the tool VISION has been developed.VISION, an innovative tool for asset management of drinkingwater networksTo define a long term strategy based on the optimization of operations and renewals aswell as dealing with the question of simultaneous leakage and continuity of supply, <strong>Veolia</strong><strong>Water</strong> has developed an innovative tool: VISION. This tool takes into account severalmodels for the evolution of water networks’ performance and the impact of both renewalsand operations on performance. The methodology could be defined in five steps:- data collection and the resulting performance of the networks,- the evolution of each performance axis if nothing is done,- the impact of investments on this evolution,- the impact of operational actions on this evolution,- 4 -
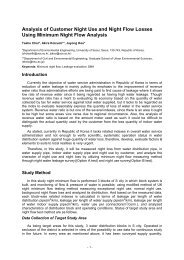
Detected leaks / Repaired leaksAnnual reported leaks rate(u/km/year)least 5 years. More comprehensive data relative to the environment of pipes (type of soil,traffic density, etc.) will help make the results more accurate.This statistical approach uses all leaks which occurred on the network, be theydetected or reported. However ALC endeavour has an important impact on the number ofdetected leaks and reported leaks. Thus the previous scenarios of future failure rate or ofthe renewal rate are only relevant for unchanging ALC levels.Impact of ALC level on continuity of supplyThe analysis of the leak rate over a period of several years provides trends concerning theimpact ALC level on the number of detected and reported leaks. The ratio of reportedleaks related to failures enables the calculation of the future number of reported leakswithout preventive and curative ALC.On average for all DMAs, the number of reported leaks decreases with the ALCintensity.Figure 2.3 <strong>In</strong>fluence of active leakage control level on reported leaks rate0.140.120.10.080.060.040.020Evolution of reported leaks according to active leakage control level0 0.5 1 1.5 2 2.5 3 3.5Active leakage detection levelWith the historical data available for each DMA, it is possible to model the evolution ofthe detected leaks according to the reported leaks and the ALC level.Figure 2.4 <strong>In</strong>fluence of active leakage control level on detected leaksPercentage of detected leaks according to active leakage control level80%70%60%50%40%30%20%10%0%0 0.5 1 1.5 2 2.5 3 3.5Active leakage detection levelThis approach defines the evolution of discontinuity of supply if nothing is done aswell as the impact that ALC has on it.- 6 -