PUMPKIN PATCH LIMITED & SUBSIDIARIESNOTES TO AND FORMING PART OF THE FINANCIAL STATEMENTSFOR THE 6 MONTHS ENDED 31 JANUARY 2004 (CONTINUED)(b)Fair ValuesThe estimated fair values of the Group’s financial assets and liabilities which differ from the carrying values arenoted below:31 January 2004 31 July 2003 31 December 2002Carrying Fair Carrying Fair Carrying FairValue Value Value Value Value Value$000 $000 $000 $000 $000 $000AssetsInvestments 4 4 4 4 3 3UnrecognisedForeign exchange contracts - (1,814) - (1,369) - (2,988)The Group anticipates that Term Liabilities will be held to maturity and that settlement at fair value is unlikely.The following methods and assumptions were used to estimate the fair values <strong>for</strong> each class of financialinstrument.Debtors, Trade Creditors and Bank OverdraftThe carrying value of these items is equivalent to their fair value and there<strong>for</strong>e they are excluded from the tableshown above.InvestmentsThe fair value of listed investments is estimated based on quoted market prices at balance date. The fair valueof unlisted investments is estimated to be the net asset backing, as there are no quoted market pricesavailable.Term LiabilitiesThe fair value of the Group’s term liabilities is estimated based on current market rates available to the Group<strong>for</strong> debt of similar maturity.Foreign Exchange ContractsThe fair value of these instruments is estimated based on the quoted market price of these instruments.Guarantees and Overdraft FacilitiesThe fair value of these instruments is estimated on the basis that management do not expect settlement atface value to arise. The carrying value and fair value of these instruments is nil.22. Significant Events After Balance DateSince balance date the company has entered into an agreement to purchase the inventory, fixed assets, andcertain employee related obligations of the HBK Girl retail operation. In addition the company is also takingover the ongoing lease obligations of the operations. Settlement date was 3 May 2004.66
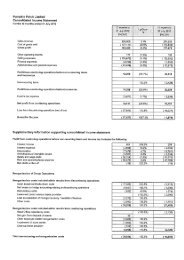
summary historical financial in<strong>for</strong>mationBasis of preparationThe historical financial in<strong>for</strong>mation summarised below is derived from the audited consolidated financialstatements of <strong>Pumpkin</strong> <strong>Patch</strong> Limited <strong>for</strong> the financial years ended 31 December 1999, 2000, 2001, 2002, theseven months ended 31 July 2003, and the six months ended 31 January 2004. <strong>Pumpkin</strong> <strong>Patch</strong> changed itsfinancial year end from December to July in 2003. There<strong>for</strong>e the 2003 financial statements are only <strong>for</strong> a sevenmonth period.The accounting policies as set out on pages 49 to 52 have been consistently applied [except where statedbelow] <strong>for</strong> all the financial periods presented.Audited31 December 31 July 31 January12 Months 7 Months 6 Months1999 2000 2001 2002 2003 2004$000 $000 $000 $000 $000 $000Operating revenue 103,033 132,890 161,293 181,919 111,750 99,730Other revenue 3,006 5 34 23 17 6Total revenue (excluding interest) 106,039 132,895 161,327 181,942 111,767 99,736Expenditure (excluding depreciation) 94,873 119,630 149,776 167,732 103,436 86,681Group EBITDA (earnings be<strong>for</strong>e interest,tax, depreciation and amortisation) 11,166 13,265 11,551 14,210 8,331 13,055Depreciation 2,737 2,997 4,833 6,012 3,821 3,497Group EBIT (earnings be<strong>for</strong>e interest and taxation) 8,429 10,268 6,718 8,198 4,510 9,558Net interest expense 1,385 970 2,725 2,552 1,871 1,329Net profit be<strong>for</strong>e tax and extraordinary items 7,044 9,298 3,993 5,646 2,639 8,229Income tax expense 1,658 3,240 1,090 3,296 1,482 2,766Net profit be<strong>for</strong>e extraordinary items 5,386 6,058 2,903 2,350 1,157 5,463Extraordinary items - - - - - -Net profit 5,386 6,058 2,903 2,350 1,157 5,463Minority interest 305 - - - - -Dividends paid or payable 3,409 3,596 1,499 2,401 1,801 1,203Net profit (deficit) retained in group 1,672 2,462 1,404 (51) (644) 4,260Dividends – cents per share 284.0 299.8 125.0 200.0 144.2 93.8Audited31 December 31 July 31 January12 Months 7 Months 6 Months1999 2000 2001 2002 2003 2004$000 $000 $000 $000 $000 $000Total tangible assets 37,416 53,280 74,098 78,294 78,686 73,683Total assets 38,329 53,400 74,240 78,495 78,893 73,885Total liabilities 20,723 33,873 53,257 57,521 58,563 49,295Total equity 17,606 19,526 20,983 20,974 20,330 24,590Net tangible assets (‘NTA’) 16,693 19,407 20,841 20,772 20,123 24,389Number of ordinary shares issued (000s) 1,200 1,199 1,199 1,202 1,249 1,283NTA backing per share – cents 1,391 1,619 1,738 1,728 1,611 1,901Adjusted NTA N/A N/A N/A N/A N/A N/AAdjusted and diluted NTA N/A N/A N/A N/A N/A N/A67