prospectus for - Pumpkin Patch investor relations
prospectus for - Pumpkin Patch investor relations
prospectus for - Pumpkin Patch investor relations
- No tags were found...

You also want an ePaper? Increase the reach of your titles
YUMPU automatically turns print PDFs into web optimized ePapers that Google loves.
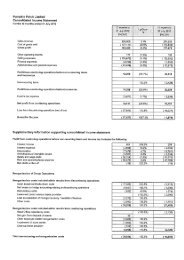
financial summaryThe financial summary below has been prepared to enable <strong>investor</strong>s to compare <strong>for</strong>ecast financial in<strong>for</strong>mationwith the three year historical per<strong>for</strong>mance of the underlying business of <strong>Pumpkin</strong> <strong>Patch</strong>.Financial Per<strong>for</strong>mance <strong>for</strong> 12 months ended 31 July 2001 2002 2003 2004 2005$000 $000 $000 $000 $000(Pro <strong>for</strong>ma) (Pro <strong>for</strong>ma)Note (Unaudited) (Unaudited) (Audited) (Forecast) (Forecast)Operating Revenue 150,238 174,534 193,510 213,524 246,774Group EBITDA Be<strong>for</strong>e Costs of Restructuring Employee Share Schemes 11,038 14,096 16,655 26,717 31,199Depreciation 4,403 5,631 6,536 7,224 8,164Group EBITA Be<strong>for</strong>e Costs of Restructuring Employee Share Schemes 6,635 8,465 10,119 19,493 23,035Amortisation/Impairment of UK goodwill 2 - 1,538 - - -Group EBIT Be<strong>for</strong>e Costs of Restructuring Employee Share Schemes 6,635 6,927 10,119 19,493 23,035Costs of restructuring employee share schemes 5 - - - 7,450 -Group EBIT 1 6,635 6,927 10,119 12,043 23,035Net interest expense* 2,610 490Operating Profit Be<strong>for</strong>e Income Tax* 9,433 22,545Income tax expense* 5,397 7,214Net Profit After Income Tax* 4,036 15,331Cash Flow SummaryOperating Cash Flow 3 (13,293) 5,809 13,109 12,452 22,099Capital expenditure 4 9,906 5,065 7,972 5,421 4,450Operating Cash Flow After Capital Expenditure (23,199) 744 5,137 7,031 17,649* Pro <strong>for</strong>ma (31 July 2001 and 31 July 2002) and audited (31 July 2003) historical financial per<strong>for</strong>mance numbers are notincluded <strong>for</strong> these items as they are not relevant following the completion of the Share Offer.EBIT means earnings be<strong>for</strong>e interest and tax; EBITA means earnings be<strong>for</strong>e interest, tax and amortisation; EBITDA meansearnings be<strong>for</strong>e interest, tax, depreciation and amortisation.Summary Statement of Financial Position Jan 2004 July 2004 July 2005$000 $000 $000Note (Audited) (Forecast) (Forecast)Current assets 43,593 52,379 67,137Non-current assets 30,292 33,105 27,811Total Assets 73,885 85,484 94,948Borrowings (including overdraft facility) 6 32,093 1,652 -Other current liabilities 14,886 15,294 15,525Non-current liabilities 2,316 3,959 1,913Total Liabilities 49,295 20,905 17,438Net Assets 24,590 64,579 77,51034