

Reports - California Cooperative Oceanic Fisheries Investigations
Reports - California Cooperative Oceanic Fisheries Investigations
Reports - California Cooperative Oceanic Fisheries Investigations

Create successful ePaper yourself
Turn your PDF publications into a flip-book with our unique Google optimized e-Paper software.
FISHERIES REVIEW<br />
CalCOFI Rep., Vol. 47, 2006<br />
the Commission instituted a deep-water Tanner Crab<br />
fishery and created transferable lobster operator permits.<br />
Coastal Pelagic Finfish<br />
Pacific sardine (Sardinops sagax), Pacific mackerel<br />
(Scomber japonicus), jack mackerel (Trachurus symmetricus),<br />
and northern anchovy (Engraulis mordax) form a complex<br />
known as coastal pelagic species (CPS) finfish, all<br />
of which are jointly managed by the PFMC and NOAA<br />
<strong>Fisheries</strong>. In 2005, combined commercial landings of<br />
CPS finfish totaled 49,219 t (tab. 1), and the ex-vessel<br />
value exceeded $4.8 million (U.S.). The Pacific sardine<br />
fishery is the most valuable fishery among these four<br />
species, contributing 70% of the total tonnage and 65%<br />
of the total ex-vessel value.<br />
Pacific Sardine. The Pacific sardine fishery extends<br />
from British Columbia, Canada, southward into Baja<br />
<strong>California</strong>, México (BCM). Although historically the<br />
bulk of the catch has been landed in southern <strong>California</strong><br />
and Ensenada, BCM, landings in the Pacific Northwest<br />
have been increasing. In 2005, Oregon landings surpassed<br />
those of <strong>California</strong> for the first time since the sardine<br />
fishery expanded.<br />
The Pacific sardine harvest guideline (HG) for each<br />
calendar year is determined from the previous year’s<br />
stock biomass estimate (the number of age 1+ fish on<br />
1 July) in U.S. and Mexican waters. The 1 July 2004<br />
10<br />
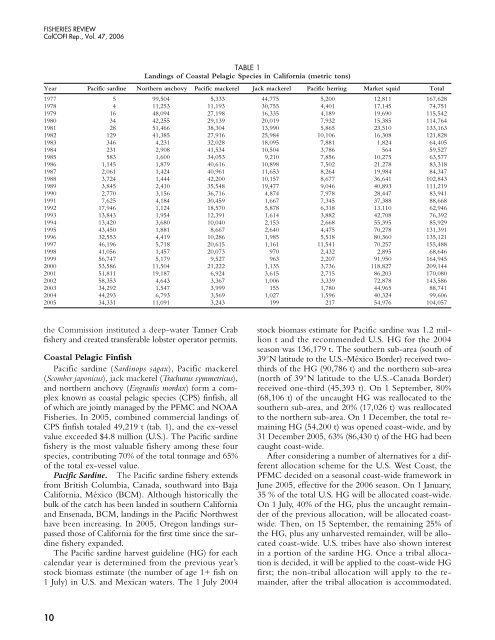
TABLE 1<br />
Landings of Coastal Pelagic Species in <strong>California</strong> (metric tons)<br />
Year Pacific sardine Northern anchovy Pacific mackerel Jack mackerel Pacific herring Market squid Total<br />
1977 5 99,504 5,333 44,775 5,200 12,811 167,628<br />
1978 4 11,253 11,193 30,755 4,401 17,145 74,751<br />
1979 16 48,094 27,198 16,335 4,189 19,690 115,542<br />
1980 34 42,255 29,139 20,019 7,932 15,385 114,764<br />
1981 28 51,466 38,304 13,990 5,865 23,510 133,163<br />
1982 129 41,385 27,916 25,984 10,106 16,308 121,828<br />
1983 346 4,231 32,028 18,095 7,881 1,824 64,405<br />
1984 231 2,908 41,534 10,504 3,786 564 59,527<br />
1985 583 1,600 34,053 9,210 7,856 10,275 63,577<br />
1986 1,145 1,879 40,616 10,898 7,502 21,278 83,318<br />
1987 2,061 1,424 40,961 11,653 8,264 19,984 84,347<br />
1988 3,724 1,444 42,200 10,157 8,677 36,641 102,843<br />
1989 3,845 2,410 35,548 19,477 9,046 40,893 111,219<br />
1990 2,770 3,156 36,716 4,874 7,978 28,447 83,941<br />
1991 7,625 4,184 30,459 1,667 7,345 37,388 88,668<br />
1992 17,946 1,124 18,570 5,878 6,318 13,110 62,946<br />
1993 13,843 1,954 12,391 1,614 3,882 42,708 76,392<br />
1994 13,420 3,680 10,040 2,153 2,668 55,395 85,929<br />
1995 43,450 1,881 8,667 2,640 4,475 70,278 131,391<br />
1996 32,553 4,419 10,286 1,985 5,518 80,360 135,121<br />
1997 46,196 5,718 20,615 1,161 11,541 70,257 155,488<br />
1998 41,056 1,457 20,073 970 2,432 2,895 68,646<br />
1999 56,747 5,179 9,527 963 2,207 91,950 164,945<br />
2000 53,586 11,504 21,222 1,135 3,736 118,827 209,144<br />
2001 51,811 19,187 6,924 3,615 2,715 86,203 170,080<br />
2002 58,353 4,643 3,367 1,006 3,339 72,878 143,586<br />
2003 34,292 1,547 3,999 155 1,780 44,965 88,741<br />
2004 44,293 6,793 3,569 1,027 1,596 40,324 99,606<br />
2005 34,331 11,091 3,243 199 217 54,976 104,057<br />
stock biomass estimate for Pacific sardine was 1.2 million<br />
t and the recommended U.S. HG for the 2004<br />
season was 136,179 t. The southern sub-area (south of<br />
39˚N latitude to the U.S.-México Border) received twothirds<br />
of the HG (90,786 t) and the northern sub-area<br />
(north of 39˚N latitude to the U.S.-Canada Border)<br />
received one-third (45,393 t). On 1 September, 80%<br />
(68,106 t) of the uncaught HG was reallocated to the<br />
southern sub-area, and 20% (17,026 t) was reallocated<br />
to the northern sub-area. On 1 December, the total remaining<br />
HG (54,200 t) was opened coast-wide, and by<br />
31 December 2005, 63% (86,430 t) of the HG had been<br />
caught coast-wide.<br />
After considering a number of alternatives for a different<br />
allocation scheme for the U.S. West Coast, the<br />
PFMC decided on a seasonal coast-wide framework in<br />
June 2005, effective for the 2006 season. On 1 January,<br />
35 % of the total U.S. HG will be allocated coast-wide.<br />
On 1 July, 40% of the HG, plus the uncaught remainder<br />
of the previous allocation, will be allocated coastwide.<br />
Then, on 15 September, the remaining 25% of<br />
the HG, plus any unharvested remainder, will be allocated<br />
coast-wide. U.S. tribes have also shown interest<br />
in a portion of the sardine HG. Once a tribal allocation<br />
is decided, it will be applied to the coast-wide HG<br />
first; the non-tribal allocation will apply to the remainder,<br />
after the tribal allocation is accommodated.


