Development and validation of a chromatographic ... - Springer
Development and validation of a chromatographic ... - Springer
Development and validation of a chromatographic ... - Springer

Create successful ePaper yourself
Turn your PDF publications into a flip-book with our unique Google optimized e-Paper software.
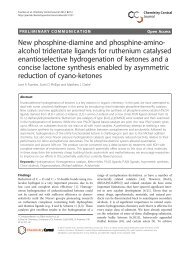
Zhou et al. Chemistry Central Journal 2012, 6:150 Page 4 <strong>of</strong> 11http://journal.chemistrycentral.com/content/6/1/1501.10(3H, s, Me-24), 1.06(3H, s, Me-26), 0.94(3H, s, Me-25), 0.87(3H, s, Me-30), 0.85(3H, s, Me-29). The downfieldshift <strong>of</strong> C-3 <strong>and</strong> the upfield shift <strong>of</strong> C-28 suggested thatthe hydroxyl group <strong>of</strong> C-3 <strong>and</strong> the carbonyl group <strong>of</strong> C-28were both glycosydated. The chemical shift <strong>of</strong> C-23 movedto the downfield at δ 63.96 because <strong>of</strong> the hydroxylation.The acid hydrolysis showed the presence <strong>of</strong> arabinose,glucose, rhamnose <strong>and</strong> ribose. Compared with the data inthe literature [5], the exact sugar sequence <strong>and</strong> its linkageposition to the aglycone were solved by a detailed analysis<strong>of</strong> the 2D NMR spectra. The HMBC spectrum showedthe correlations from H-Rha’-1 to C-Glc’-6, H-Ara-1 toC-3; H-Ara-2 to C-Rha-1; H-Rha-1 to C-Ara-2; H-Rha-3to C-Rib-1; H-Glc-1 to C-Rib-4; H-Glc’-1 to C-Glc-4;H-Glc”-1 to C-28; H-Glc”’-1 to C-Glc”-6; H-Rha”-1 toC-Glc”’-4. Based on these analyses, the structure <strong>of</strong> thiscompound was elucidated as 3-O-β-[(O-α-L-rhamnopyranosyl-(1→6)-O-β-D-glucopyranosyl-(1→4)-O-β-Dglucopyranosyl-(1→4)-O-β-D-ribopyranosyl-(1→3)-Oα-L–rhamnopyranosyl-(1→2)-α-L-arabinopyranosyl)oxy]hederagenin 28-O-α-L- rhamnopyranosyl-(1→4)-O-β-Dglucopyanosyl-(1→6)-β-D-glucopyanosyl ester. The spectradataassignmentswereshowninTable1.Structure elucidation <strong>of</strong> impurities 1, 3, 4, 5Impurities 1, 3, 4, 5 were obtained as white, amorphouspowders. The TOF-MS revealed impurities 1, 3, 4 havedouble charged molecular ion at m/z 933.4001, 852.3874,794.3646, <strong>and</strong> gave impurity 5 has molecular ion at m/z1335.6913, which corresponds to a molecular formula <strong>of</strong>C 82 H 134 O 44 , C 76 H 124 O 39 , C 69 H 124 O 34 , <strong>and</strong> C 64 H 104 O 29 ,respectively. Their chemical structures were suggested asclematichinenoside AR 6 [3], clematom<strong>and</strong>shurica saponinC [4], clematichinenoside C [16], <strong>and</strong> clematichinenosideAR 2 [5] by comparing their mass spectral data with thosepublished in the literature. The structures <strong>of</strong> these relatedsubstances were further confirmed by the same retentiontime in HPLC chromatogram with each <strong>of</strong> their referencesubstances shown above. The chemical structures <strong>of</strong> theserelated substances are shown in Figure 1.<strong>Development</strong> <strong>and</strong> <strong>validation</strong> <strong>of</strong> HPLC methodA simple, efficient <strong>and</strong> reliable method was developed toexamine AR <strong>and</strong> five impurities in bulk samples. AR <strong>and</strong>its related impurities all showed maximum absorption at203 nm. Therefore, the detection wavelength was set at203 nm, flow rate <strong>and</strong> column temperature were optimizedin order to achieve the desired resolution <strong>and</strong> tailing factor<strong>of</strong> closely eluting impurities using simple <strong>chromatographic</strong>conditions. Under this condition, all the peaks were clearlyseparated. The proposed method was validated with respectto system suitability, specificity, robustness, linearity, accuracy,precision, LOD <strong>and</strong> LOQ. Figure 2 showed a typicalchromatogram <strong>of</strong> AR <strong>and</strong> five potential impurities. Goodpeak symmetries <strong>and</strong> resolutions were observed for AR <strong>and</strong>all spiked impurity components in 20 min. Results weresummarized in Table 2.Effect <strong>of</strong> three C18 columnsTo investigate the effect <strong>of</strong> the HPLC column on theseparation <strong>and</strong> tailing factor under the optimized conditions,octyldecyl silica gel columns from three differentvendors were evaluated for the analysis <strong>of</strong> AR <strong>and</strong>its impurities. These HPLC columns included: (1)Thermo ODS Hypersil (4.6 mm × 150 mm, 5 μm, USA);(2)Diamonsil C18(4.6 mm × 150 mm, 5 μm, China) (3)Agilent TC-C18(4.6mm × 150mm, 5 μm, USA). Basedon the results from the laboratory HPLC system, allthe resolutions were more than 1.50, but the AgilentTC-C18 provided the best resolutions. The tailing factors<strong>of</strong> AR <strong>and</strong> impurities obtained on the Agilent TC-18 column were between 0.8 <strong>and</strong> 1.2, which indicatedgood peak shapes for all compounds. Tailing factors <strong>of</strong>Imp-1, 5 on the Diamonsil C18 column were less than0.8 <strong>and</strong> the numbers <strong>of</strong> theoretical plates for Imp-2, 3,4 <strong>and</strong> AR were less than those obtained on the AgilentTC-C18. Besides, the tailing factors <strong>of</strong> Imp-1, 5 werebigger than 1.5 <strong>and</strong> was not suitable for tailing factorrequirement on the Thermo ODS Hypersil. Thus, theAgilent TC-C18 column demonstrated the desirableperformance <strong>and</strong> was selected for further studies. Theresults were listed in Table 3.System suitabilityThe system suitability tests were conducted using theworking solution containing AR (1.0 mg/mL) <strong>and</strong> fiveimpurities (each at 0.05 mg/mL) by five repeated injectionswith the optimized method. It was observed thatthe tailing factors for all compounds were between 0.8<strong>and</strong> 1.2, <strong>and</strong> the resolutions were greater than 1.50.These results met the HPLC method requirements forseparation <strong>and</strong> quantification <strong>of</strong> AR <strong>and</strong> related impuritiesin bulk samples.SpecificityThe specificity <strong>of</strong> the related compounds <strong>and</strong> AR wasassessed using the forced degradation studies underconditions described in the literature [17]. Basic, acidic,oxidative, photolytic <strong>and</strong> thermal degradation were conductedin 0.1 N NaOH at 60°C for 40 min, 1N HCl at60°C for 30 min, 3% H 2 O 2 at 60°C for 1 h, illumination<strong>of</strong> 1.2 million lux hours for 10 days <strong>and</strong> heat at 60°C for8 h, respectively. Photolytic <strong>and</strong> thermal studies wereconducted by exposing the samples both in solution(1.0 mg/mL) <strong>and</strong> in solid state. Samples were withdrawnat the appropriate times, the pH was adjusted to neutral<strong>and</strong> the samples were subjected to HPLC analysis aftersuitable dilution (1.0 mg/mL) to evaluate the ability <strong>of</strong> the
Zhou et al. Chemistry Central Journal 2012, 6:150 Page 5 <strong>of</strong> 11http://journal.chemistrycentral.com/content/6/1/150R1 R2 R3 R4ClematichinenosideH H S1 S3ARImp-1 OH H S1 S3Imp-2 H HO S1 S3Imp-3 H H S1 S2Imp-4 H H S1 S4Imp-5 H H H S3Figure 1 The chemical structures <strong>of</strong> Clematichinenoside AR <strong>and</strong> its related impurities.
Zhou et al. Chemistry Central Journal 2012, 6:150 Page 7 <strong>of</strong> 11http://journal.chemistrycentral.com/content/6/1/150Table 3 Comparison <strong>of</strong> three columns under optimized conditionsColumns Compounds Rs As α k’ NTPThermo ODS Hypersil Imp-1 - 1.681 - 0.279 8610(4.6mm ×150mm, 5 μm) Imp −2 3.62 1.281 1.234 0.579 3280AR 9.49 0.879 2.583 2.178 3162Imp-3 1.60 1.036 1.119 2.559 3255Imp-4 1.63 0.934 1.116 2.979 3615Imp-5 40.03 2.778 3.215 10.974 127412Diamonsil C18(4.6mm ×150mm, 5 μm) Imp-1 - 0.707 - 0.237 5722Imp-2 3.37 1.135 1.283 0.586 2009AR 9.41 0.878 3.051 2.786 2167Imp-3 1.52 0.977 1.135 3.297 2448Imp-4 1.90 0.951 1.157 3.977 2948Imp-5 27.88 0.691 2.341 10.740 159346Agilent TC-C18(4.6mm×150mm,5 μm) Imp-1 - 1.124 - 0.693 4009Imp-2 6.79 1.047 1.872 1.630 3889AR 18.33 0.838 2.856 5.547 10299Imp-3 1.99 0.964 1.080 6.032 14992Imp-4 2.06 0.974 1.070 6.492 19418Imp-5 26.91 1.012 1.686 11.335 248207Rs, resolution; As, tailing factor; α, selectivity; k’, capacity factor; NTP, number <strong>of</strong> theoretical plates.recorded. The mean analyte recoveries <strong>and</strong> their recoveryrates obtained for each level are described in detail inTable 2. The accuracy <strong>and</strong> recovery results were suitablefor the quantitative HPLC method.RobustnessFor an analytical method to be robust, it must be able toproduce quantitative results despite small changes in theexperimental parameters, which may occur in a typicaltesting laboratory. The robustness <strong>of</strong> the method was studiedby employing an experimental design, where thetemperature <strong>of</strong> the column (25°C −35°C) <strong>and</strong> the flow rate<strong>of</strong> the mobile phase (0.8-1.2mL·min -1 ) were purposelysubjected to small modifications. The temperature, the flowrate <strong>and</strong> the combined effects as the three factors werestudied on the characteristics <strong>of</strong> the chromatogram <strong>of</strong> AR<strong>and</strong> its impurities. The tailing factors for all compoundswere between 0.8 <strong>and</strong> 1.2 <strong>and</strong> the resolutions were greaterthan 1.50.Application <strong>of</strong> correction factorsCalculation <strong>of</strong> correction factorDue to the difficulties <strong>and</strong> expenses to prepare all therelated reference st<strong>and</strong>ards, the application <strong>of</strong> the externalst<strong>and</strong>ard method was limited, so correction factor wasused in the quantification <strong>of</strong> related substances. Accordingto ICH guiding principles, if the response factors <strong>of</strong> drugsubstance <strong>and</strong> relevant impurity are not close, we can usethe drug substance as a st<strong>and</strong>ard to estimate the levels <strong>of</strong>impurities with providing a correction factor. The method<strong>of</strong> calculating correction factor is the same as conversionfactor [18]. The correction factor (f) was the ratio <strong>of</strong>responses between internal st<strong>and</strong>ard substance (As/Cs)<strong>and</strong> st<strong>and</strong>ard substance(A R /C R ).f ¼A s=C sA R= C RAs: peak area <strong>of</strong> internal st<strong>and</strong>ard substance; Cs:concentration <strong>of</strong> internal st<strong>and</strong>ard substance; A R: peakarea <strong>of</strong> st<strong>and</strong>ard substance; Cs: concentration <strong>of</strong> st<strong>and</strong>ardsubstanceIn this study, AR was selected as internal st<strong>and</strong>ard, <strong>and</strong>each related impurity was as st<strong>and</strong>ard. The correctionfactor <strong>of</strong> each substance was obtained as the mean valuescalculated from five different concentrations. The resultsfrom five gradient concentrations showed that the correctionfactors <strong>of</strong> Imp-1 (F1) was 1.00 ± 0.04, the Imp-2 (F2)was 1.13 ± 0.02, the Imp-3 (F3) was 1.00 ± 0.02, the Imp-4(F4) was 0.90 ± 0.04,<strong>and</strong> the Imp-5 (F5) was 0.61 ± 0.02.The RSDs for corrections for all compounds were below5%. Additionally, there were other two approaches used tocalculate the correction factors. The first one was calculatedby the ratio <strong>of</strong> equation slope <strong>of</strong> AR <strong>and</strong> its impurities. F1was 1.00; F2 was 1.01; F3 was 0.95; F4 was 0.82 <strong>and</strong> F5 was0.59. The above results showed that F1 <strong>and</strong> F5 were similar
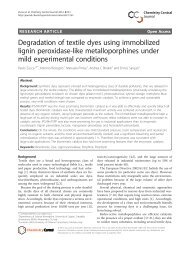
Zhou et al. Chemistry Central Journal 2012, 6:150 Page 8 <strong>of</strong> 11http://journal.chemistrycentral.com/content/6/1/150Figure 3 Typical chromatogram <strong>of</strong> clematichinenoside AR under stress conditions: (a) oxidative degradation, (b) acid hydrolysis, (c)base hydrolysis, (d) thermal degradation, (e) photolytic degradation.
Zhou et al. Chemistry Central Journal 2012, 6:150 Page 9 <strong>of</strong> 11http://journal.chemistrycentral.com/content/6/1/150Table 4 Correction factors <strong>of</strong> related impuritiesImp-1(μg/mL) F1 Imp-2(μg/mL) F2 AR(μg/mL) F0 Imp-3(μg/mL) F3 Imp-4(μg/mL) F4 Imp-5(μg/mL) F51 6.41 0.96 6.26 1.15 9.52 1 9.83 1.01 6.50 0.94 5.98 0.602 12.82 0.97 12.53 1.13 19.05 1 19.66 1.02 13.01 0.91 11.95 0.603 26.70 1.00 26.10 1.13 39.68 1 40.96 0.99 27.10 0.89 24.90 0.634 40.05 1.02 39.15 1.11 59.52 1 61.44 1.00 40.65 0.89 37.35 0.615 53.40 1.03 52.20 1.12 79.36 1 81.92 0.99 54.20 0.89 49.80 0.60RSD(%) 3.06 1.31 1.30 2.42 2.14Average 1.00 1.13 1.00 0.90 0.61while the others had significant difference. The linearitydata showed that the interception <strong>of</strong> impurities 2 <strong>and</strong> 4were not less than 1. This indicated that we couldn't neglectthe influence <strong>of</strong> interception. The second one was only byone single concentration solution. But Table 4 clearlyshowed that the value <strong>of</strong> F1 increased with the increase <strong>of</strong>concentration, the change <strong>of</strong> F5 was exact contrary. F2 wasmore stable when the concentration was above 10 μg/mL.The reason may relate with the extremely low absorptionvalue <strong>of</strong> saponins. When the concentration <strong>of</strong> analytes waslower than 10 μg/mL, the RSD would increase. Thus, wesuggest that the correction factor should be applied in arelative stable range <strong>of</strong> concentrations, if the concentration<strong>of</strong> impurity 2 was too low in the bulk sample, the externalst<strong>and</strong>ard method would be desirable.Ruggedness <strong>and</strong> robustnessIn the quality control <strong>of</strong> this natural product, the value<strong>of</strong> correction factor may change greatly if it wasperformed in different laboratories. Therefore, the stability<strong>of</strong> correction factor was investigated by ruggedness<strong>and</strong> robustness tests. In ruggedness test, five columns(three different Agilent TC-18 columns, Thermo ODSHypersil <strong>and</strong> Diamonsil C18) were investigated. All thesecolumns meet with the requirements <strong>of</strong> system suitabilityTable 5 Results <strong>of</strong> ruggedness <strong>and</strong> robustness testImp-1 Imp-2 Imp-3 Imp-4 Imp-5Diamonsil 0.98 1.02 0.92 0.80 0.58Thermo 1.08 1.12 1 0.9 0.77206 nm 1.03 1.11 0.99 0.89 0.66200 nm 1.02 1.07 0.99 0.89 0.7235°C 1.04 1.1 0.99 0.89 0.6825°C 1.02 1.16 0.99 0.89 0.711.2 ml/min 0.99 1.10 0.98 0.88 0.680.8 ml/min 1.03 1.16 0.99 0.90 0.67TC-C18 0.99 1.12 1.00 0.90 0.63TC-C18 1.02 1.12 0.99 0.90 0.62TC-C18 1.00 1.13 1.00 0.90 0.61parameters which was shown in Table 3. In robustnesstests, three related factors were studied, the temperature<strong>of</strong> the column (25°C-35°C), the flow rate <strong>of</strong> the mobilephase (0.8-1.2 mL·min -1 ) <strong>and</strong> the UV detection wavelength(200 nm-206 nm). The results were shown in Table 5. Onall Agilent TC-C18 columns, the mean correction factor<strong>of</strong> five impurities was 1.00, 1.12, 1.00, 0.90 <strong>and</strong> 0.62,respectively. The result revealed that all the correction factorswere stable on different Agilent TC-C18 columns. Besides,the value <strong>of</strong> F3 <strong>and</strong> F4 were stable when it wasperformed in different br<strong>and</strong>s <strong>of</strong> <strong>chromatographic</strong> columns<strong>and</strong> modified experimental parameters, the reasonmay be the structure <strong>of</strong> Imp – 3 <strong>and</strong> Imp - 4 was veryclose to AR. Factors regarding the flow rate <strong>and</strong> columntemperature have some influence on the Imp-2. When theflow rate was decreased from 1.2 to 0.8, the correction factor<strong>of</strong> Imp-2 was increased from 1.10 to 1.16. Regardingcolumn temperature, when the temperature was increasedfrom 25°C to 35°C, the correction factor <strong>of</strong> Imp-2 wasdecreased from 1.16 to 1.1. The possible reason may relatewith the integration parameters, the peak area changed atthe same integration parameters when there were smallchanges in experimental parameters.Analysis <strong>of</strong> three batches <strong>of</strong> clematichinenoside AR bulksamplesThe validated method was applied to quantitate impuritiesin three batches <strong>of</strong> AR bulk samples by using two methods:external st<strong>and</strong>ard method as method I, <strong>and</strong> single referencest<strong>and</strong>ard by five correction factors were used to determinethe impurities <strong>of</strong> the same samples as method II. The samplesolutions were prepared at 1 mg/mL. The contents <strong>of</strong>impurities relative to AR were summarized in Table 6. TheRSDs <strong>of</strong> sum contents <strong>of</strong> the five compound obtained bythe two methods <strong>of</strong> each sample were less than 2%. Andthe RSDs <strong>of</strong> Imp-1, Imp- 4, Imp-5 were more than 5%. Thereason might relate with the low concentration <strong>of</strong> impuritiesin samples. However, the difference can be neglectedfor quality control because the RSDs <strong>of</strong> sum contents meetthe requirements. Therefore, single reference st<strong>and</strong>ard bycorrection factors could be used in the quality control <strong>of</strong>
Zhou et al. Chemistry Central Journal 2012, 6:150 Page 10 <strong>of</strong> 11http://journal.chemistrycentral.com/content/6/1/150Table 6 The contents <strong>of</strong> clematichinenoside AR <strong>and</strong> its related impurities in three batches <strong>of</strong> bulk samplesBulk-1 Bulk-2 Bulk-3methodI methodII RSD methodI methodII RSD methodI methodII RSDImp-1(%) 0.65 0.67 2.14 1.11 0.99 8.08 - - -Imp-2(%) - - - - - - 2.47 2.36 3.22clematichinenoside AR(%) 93.01 - - 92.22 - - 95.03 - -Imp-3(%) 4.38 4.57 3.00 4.17 4.34 2.83 2.08 2.12 1.35Imp-4(%) 1.24 1.35 6.01 1.22 1.39 9.21 - - -Imp-5(%) 1.02 0.89 9.63 1.03 0.94 6.46 - - -Sum(%) 7.28 7.48 1.92 7.53 7.66 1.21 4.55 4.48 1.10related impurities. According to the regulation <strong>of</strong> StateFood <strong>and</strong> Drug Administration, the content <strong>of</strong> AR shouldnot be less than 90.0%. So, all the samples comply withthe limit.ConclusionsThe quality <strong>of</strong> bulk drug not only depends on theadopted procedure, but also on the side-reactionproducts, unreacted raw materials <strong>and</strong> intermediates,because they may render unwanted toxicological effects.Hence, thorough examination <strong>of</strong> related impurities playsa very important role in controlling the quality <strong>of</strong> bulkdrug in the final product [14,19]. The impurities wereisolated from AR bulk samples by column chromatography<strong>and</strong> semi-preparative HPLC methods. Five relatedimpurities were characterized, including a new compoundconfirmed as 3-O-β-[(O-α-L-rhamnopyranosyl-(1→6)-Oβ-D-glucopyranosyl-(1→4)-O-β-D-glucopyranosyl-(1→4)-O-β-D-ribopyra-nosyl-(1→3)-O-α-L–rhamnopyranosyl-(1→2) -α-L-arabinopyranosyl)oxy] hederagenin 28-O-α-Lrhamnopyranosyl-(1→4)-O-β-D-glucopyanosyl-(1→6)-β-D- glucopyanosyl ester. Imp-1,3,4,5 were four knowntriterpenoid saponins isolated from Rhizoma Clematidis(Wei-Ling-Xian), Imp-2 (clematom<strong>and</strong>shurica saponin F)was a new triterpenoid saponins firstly found in AR bulksamples, it might be derived from the crude drug. In thispaper, a simple gradient RP-HPLC method was developed<strong>and</strong> validated for the simultaneous determination <strong>of</strong>AR<strong>and</strong>itsrelatedimpuritiesinbulksamples.Byusingexperimental designs, optimum separation was successfullyachieved <strong>and</strong> five impurities <strong>of</strong> AR could beseparated in 20 minutes with satisfactory resolution,linearity, <strong>and</strong> sensitivity. Furthermore, two methodsincluding external st<strong>and</strong>ard method <strong>and</strong> single referencest<strong>and</strong>ard with correction factor were applied to determineimpurities in three batches <strong>of</strong> AR bulk samples. In order toensure the accuracy <strong>of</strong> the determination, speed up the analysis,<strong>and</strong> reduce the cost <strong>of</strong> experimental procedure, thecorrection factor was better for the determination <strong>of</strong> relatedsubstances in a relative stable range <strong>of</strong> concentrations,which could be very helpful for the quality control <strong>of</strong> ARbulk sample <strong>and</strong> the safe clinical use in the future.AbbreviationsHPLC: High-performance liquid chromatography; ICH: InternationalConference on Harmonization; UV: Ultraviolet; LOD: Limit <strong>of</strong> detection;LOQ: Limit <strong>of</strong> quantification; SD: St<strong>and</strong>ard deviation; RSD: Relative st<strong>and</strong>arddeviation; ELSD: Evaporative Light Scattering Detector; RP-HPLC: Reversephase high-performance liquid chromatography; LC-MS/MS: Liquidchromatography-t<strong>and</strong>em mass spectrometry; TOF-MS: Time-<strong>of</strong>-flight massspectrometry nuclear magnetic resonance; HMBC: Heteronuclear MultipleBond Correlation; HR-ESI MS: High resolution electrospray ionization massspectrometry; Rs: Resolution; As: Tailing factor; α: Selectivity; k’: Capacityfactor; NTP: Number <strong>of</strong> theoretical plates; AR: Clematichinenoside AR.Competing interestsThe authors declare that they have no competing interests.Authors’ contributionsLFL planed <strong>and</strong> supervised the whole work, YZ carried out the experiments<strong>and</strong> analyzed the data statistically, YG, JS, XLZ <strong>and</strong> LY participated in writingthe manuscript. All authors read <strong>and</strong> approved the final manuscript.AcknowledgementsFinancial support from the “The Creation for Significant New Drugs” a majorscientific <strong>and</strong> technological initiative for “Eleventh Five-Year Plan” (No.2009ZX09103-371), National Natural Science Foundation <strong>of</strong> China (ProjectNo. 30772770) <strong>and</strong> Qing Lan Project (2010) are gratefully acknowledged.Received: 24 September 2012 Accepted: 27 November 2012Published: 8 December 2012References1. The State Pharmacopoeia Commission <strong>of</strong> The People’s Republic <strong>of</strong> China:Pharmacopoeia <strong>of</strong> the People’s Republic <strong>of</strong> China. China Medical Science2010, Volume 1:234.2. Shi S, Jiang D, Zhao M, et al: Preparative isolation <strong>and</strong> purification <strong>of</strong>triterpene saponins from Clematis m<strong>and</strong>shurica by high-speed countercurrentchromatography coupled with evaporative light scatteringdetection. J Chromatogr B 2007, 852:679–683.3. Mimaki Y, Yokosuka A, Hamanaka M, et al: Triterpene saponins from theroots <strong>of</strong> Clematis chinensis. J Nat Prod 2004, 67:1511–1516.4. Shi S, Jiang D, Dong C, et al: Triterpene saponins from Clematism<strong>and</strong>shurica. J Nat Prod 2006, 69:1591–1595.5. Liu L, Ma X, Wang YX, et al: Triterpenoid saponins from the roots <strong>of</strong>Clematis chinensis Osbeck. J Asian Nat Prod Res 2009, 11:389–396.6. Wu W, Xu X, Dai Y, et al: Therapeutic effect <strong>of</strong> the saponin fraction fromclematis chinensis osbeck roots on osteoarthritis induced bymonosodium iodoacetate through protecting articular cartilage.Phytother Res 2010, 24:538–546.7. Fu Q, Zan K, Zhao M, et al: Triterpene saponins from clematis chinensis <strong>and</strong>their potential anti-inflammatory activity. J Nat Prod 2010, 73:1234–1239.
Zhou et al. Chemistry Central Journal 2012, 6:150 Page 11 <strong>of</strong> 11http://journal.chemistrycentral.com/content/6/1/1508. Peng C, Perera PK, Li Y, et al: Anti-inflammatory effects <strong>of</strong> Clematischinensis Osbeck extract(AR-6) may be associated with NF-kB, TNF-a,<strong>and</strong> COX-2 in collagen-induced arthritis in rat. Rheumatol Int 2012,32:3119–3125.9. Lu X, Fang W, Li Y, et al: Analgesic <strong>and</strong> anti-inflammatory effect <strong>of</strong>clematichinenoside. Chinese Journal <strong>of</strong> New Drugs 2009, 18:1535–1539.10. Sun S, Li Y, Fang W, et al: Effect <strong>and</strong> mechanism <strong>of</strong> AR-6 in experimentalrheumatoid arthritis. Clin Exp Med 2010, 10:113–121.11. Dong C, Liu L, Li M, et al: The preparation <strong>and</strong> preliminarypharmacodynamics <strong>of</strong> clematichinenoside microemulsion. ChineseTraditional Patent Medicine 2011, 33(7):1159–1163.12. Ma X, Xie L, Liu L, et al: Simultaneous quantification <strong>of</strong> seven maintriterpenoid saponins in Radix et Rhizoma Clematidis by LC–ELSD.Chromatographia 2009, 69:437–443.13. Wang D, Li F, Li P, et al: Validated LC-MS/MS assay for the quantitativedetermination <strong>of</strong> clematichinenoside AR in rat plasma <strong>and</strong> itsapplication to a pharmacokinetic study. Biomed Chromatogr 2012,26(10):1282–1285.14. ICH: Q3A Impurities in New Drug Substances. In Proceedings <strong>of</strong> theinternational conference on harmonization. 2006:1–22.15. Kizu H, Shimana H, Tommimori T: Studies on the constituents constituents<strong>of</strong> Clematis Species IV. The Constituents <strong>of</strong> Clematis stans Sieb. Et Zucc.Chem Pharm Bull 1995, 43(12):2187–2194.16. Shao B, Qin G, Xu R, et al: Triterpenoid saponins fromClematis chinensis.Phytochemistry 1995, 38(6):1473–1479.17. ICH: Q1A Stability Testing <strong>of</strong> New Drug Substances <strong>and</strong> Products. InProceedings <strong>of</strong> the international conference on harmonization. 2003:1–15.18. Hou J, Wua W, Da J, et al: Ruggedness <strong>and</strong> robustness <strong>of</strong> conversionfactors in method <strong>of</strong> simultaneous determination <strong>of</strong> multi-componentswith single reference st<strong>and</strong>ard. J Chromatogr A 2011, 1218:5618–5627.19. ICH: Q3B Impurities in New Drug Substances. In Proceedings <strong>of</strong> theinternational conference on harmonization. 2006:1–12.doi:10.1186/1752-153X-6-150Cite this article as: Zhou et al.: <strong>Development</strong> <strong>and</strong> <strong>validation</strong> <strong>of</strong> a<strong>chromatographic</strong> method for determining Clematichinenoside AR <strong>and</strong>related impurities. Chemistry Central Journal 2012 6:150.Publish with ChemistryCentral <strong>and</strong> everyscientist can read your work free <strong>of</strong> chargeOpen access provides opportunities to ourcolleagues in other parts <strong>of</strong> the globe, by allowinganyone to view the content free <strong>of</strong> charge.W. Jeffery Hurst, The Hershey Company.available free <strong>of</strong> charge to the entire scientific communitypeer reviewed <strong>and</strong> published immediately upon acceptancecited in PubMed <strong>and</strong> archived on PubMed Centralyours you keep the copyrightSubmit your manuscript here:http://www.chemistrycentral.com/manuscript/