PDF (3.77 Mo) - Le Crédit Agricole
PDF (3.77 Mo) - Le Crédit Agricole
PDF (3.77 Mo) - Le Crédit Agricole

You also want an ePaper? Increase the reach of your titles
YUMPU automatically turns print PDFs into web optimized ePapers that Google loves.
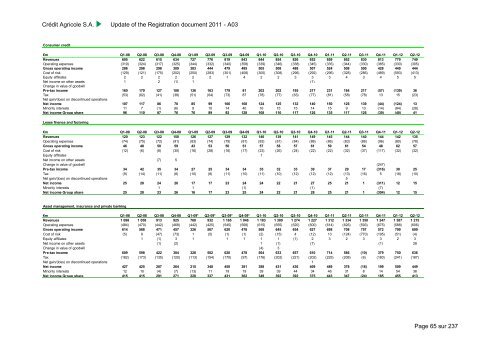
Crédit <strong>Agricole</strong> S.A.Update of the Registration document 2011 - A03Consumer credit€m Q1-08 Q2-08 Q3-08 Q4-08 Q1-09 Q2-09 Q3-09 Q4-09 Q1-10 Q2-10 Q3-10 Q4-10 Q1-11 Q2-11 Q3-11 Q4-11 Q1-12 Q2-12Revenues 605 622 615 634 727 776 819 843 844 854 826 852 859 852 830 813 779 749Operating expenses (319) (324) (317) (325) (344) (332) (340) (358) (339) (346) (338) (345) (335) (344) (330) (385) (330) (305)Gross operating income 286 298 298 309 383 444 479 485 505 508 488 507 524 508 500 428 449 444Cost of risk (129) (121) (175) (202) (250) (283) (301) (408) (305) (308) (296) (292) (296) (328) (286) (489) (593) (413)Equity affiliates 2 2 2 2 2 2 1 4 2 2 3 3 3 4 3 4 5 5Net income on other assets 1 2 (1) 1 (1)Change in value of goodwillPre-tax income 160 179 127 108 136 163 179 81 202 202 195 217 231 184 217 (57) (139) 36Tax (53) (62) (41) (38) (51) (64) (73) 87 (78) (77) (63) (77) (81) (58) (78) 13 15 (23)Net gain/(loss) on discontinued operationsNet income 107 117 86 70 85 99 106 168 124 125 132 140 150 126 139 (44) (124) 13Minority interests 11 7 (1) (6) 9 10 14 40 16 15 15 14 15 9 13 (14) (84) (28)Net income Group share 96 110 87 76 76 89 92 128 108 110 117 126 135 117 126 (30) (40) 41<strong>Le</strong>ase finance and factoring€m Q1-08 Q2-08 Q3-08 Q4-08 Q1-09 Q2-09 Q3-09 Q4-09 Q1-10 Q2-10 Q3-10 Q4-10 Q1-11 Q2-11 Q3-11 Q4-11 Q1-12 Q2-12Revenues 120 123 122 150 126 127 129 132 140 139 141 149 145 144 140 144 142 135Operating expenses (74) (75) (72) (91) (83) (74) (79) (81) (83) (81) (84) (88) (86) (83) (86) (96) (80) (78)Gross operating income 46 48 50 59 43 53 50 51 57 58 57 61 59 61 54 48 62 57Cost of risk (12) (6) (8) (30) (16) (28) (16) (17) (23) (26) (24) (22) (22) (32) (37) (117) (32) (32)Equity affiliates 1Net income on other assets (7) 5Change in value of goodwill (247)Pre-tax income 34 42 35 34 27 25 34 34 35 32 33 39 37 29 17 (316) 30 25Tax (9) (14) (11) (8) (10) (8) (11) (10) (11) (10) (12) (12) (12) (13) (16) 5 (18) (10)Net gain/(loss) on discontinued operations 5Net income 25 28 24 26 17 17 23 24 24 22 21 27 25 21 1 (311) 12 15Minority interests 1 1 (1) (1) (7)Net income Group share 25 28 23 26 16 17 23 25 24 22 21 28 25 21 1 (304) 12 15Asset management, insurance and private banking€m Q1-08 Q2-08 Q3-08 Q4-08 Q1-09* Q2-09* Q3-09* Q4-09* Q1-10 Q2-10 Q3-10 Q4-10 Q1-11 Q2-11 Q3-11 Q4-11 Q1-12 Q2-12Revenues 1 098 1 058 913 925 768 932 1 165 1 046 1 183 1 300 1 274 1 227 1 312 1 334 1 350 1 247 1 387 1 215Operating expenses (484) (470) (442) (468) (442) (425) (545) (568) (615) (655) (620) (600) (614) (626) (593) (675) (588) (606)Gross operating income 614 588 471 457 326 507 620 478 568 645 654 627 698 708 757 572 799 609Cost of risk (5) 9 (47) (73) 1 (5) (1) (1) (2) (15) 4 (12) 13 (124) (770) (195) (51) (4)Equity affiliates 1 (1) 3 1 1 1 1 1 (1) 2 3 2 3 3 2 3Net income on other assets (1) (2) 1 (1) (7) (1) 28Change in value of goodwill (4) 3Pre-tax income 609 598 422 384 328 502 620 478 564 633 657 610 714 586 (10) 379 750 636Tax (182) (173) (135) (120) (113) (154) (170) (97) (176) (202) (221) (202) (225) (208) (6) (180) (241) (187)Net gain/(loss) on discontinued operations 1Net income 427 425 287 264 215 348 450 381 388 431 436 409 489 378 (16) 199 509 449Minority interests 12 10 (4) (7) (13) 11 19 19 39 39 44 34 46 31 8 14 54 36Net income Group share 415 415 291 271 228 337 431 362 349 392 392 375 443 347 (24) 185 455 413Page 65 sur 237