Standard Reference Material 2881 - National Institute of Standards ...
Standard Reference Material 2881 - National Institute of Standards ...
Standard Reference Material 2881 - National Institute of Standards ...
Create successful ePaper yourself
Turn your PDF publications into a flip-book with our unique Google optimized e-Paper software.
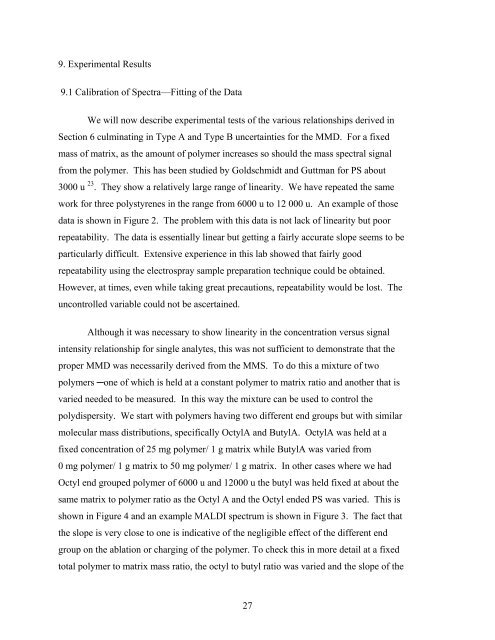
9. Experimental Results9.1 Calibration <strong>of</strong> Spectra—Fitting <strong>of</strong> the DataWe will now describe experimental tests <strong>of</strong> the various relationships derived inSection 6 culminating in Type A and Type B uncertainties for the MMD. For a fixedmass <strong>of</strong> matrix, as the amount <strong>of</strong> polymer increases so should the mass spectral signalfrom the polymer. This has been studied by Goldschmidt and Guttman for PS about3000 u 23 . They show a relatively large range <strong>of</strong> linearity. We have repeated the samework for three polystyrenes in the range from 6000 u to 12 000 u. An example <strong>of</strong> thosedata is shown in Figure 2. The problem with this data is not lack <strong>of</strong> linearity but poorrepeatability. The data is essentially linear but getting a fairly accurate slope seems to beparticularly difficult. Extensive experience in this lab showed that fairly goodrepeatability using the electrospray sample preparation technique could be obtained.However, at times, even while taking great precautions, repeatability would be lost. Theuncontrolled variable could not be ascertained.Although it was necessary to show linearity in the concentration versus signalintensity relationship for single analytes, this was not sufficient to demonstrate that theproper MMD was necessarily derived from the MMS. To do this a mixture <strong>of</strong> twopolymers ─one <strong>of</strong> which is held at a constant polymer to matrix ratio and another that isvaried needed to be measured. In this way the mixture can be used to control thepolydispersity. We start with polymers having two different end groups but with similarmolecular mass distributions, specifically OctylA and ButylA. OctylA was held at afixed concentration <strong>of</strong> 25 mg polymer/ 1 g matrix while ButylA was varied from0 mg polymer/ 1 g matrix to 50 mg polymer/ 1 g matrix. In other cases where we hadOctyl end grouped polymer <strong>of</strong> 6000 u and 12000 u the butyl was held fixed at about thesame matrix to polymer ratio as the Octyl A and the Octyl ended PS was varied. This isshown in Figure 4 and an example MALDI spectrum is shown in Figure 3. The fact thatthe slope is very close to one is indicative <strong>of</strong> the negligible effect <strong>of</strong> the different endgroup on the ablation or charging <strong>of</strong> the polymer. To check this in more detail at a fixedtotal polymer to matrix mass ratio, the octyl to butyl ratio was varied and the slope <strong>of</strong> the27


