Standard Reference Material 2881 - National Institute of Standards ...
Standard Reference Material 2881 - National Institute of Standards ...
Standard Reference Material 2881 - National Institute of Standards ...
Create successful ePaper yourself
Turn your PDF publications into a flip-book with our unique Google optimized e-Paper software.
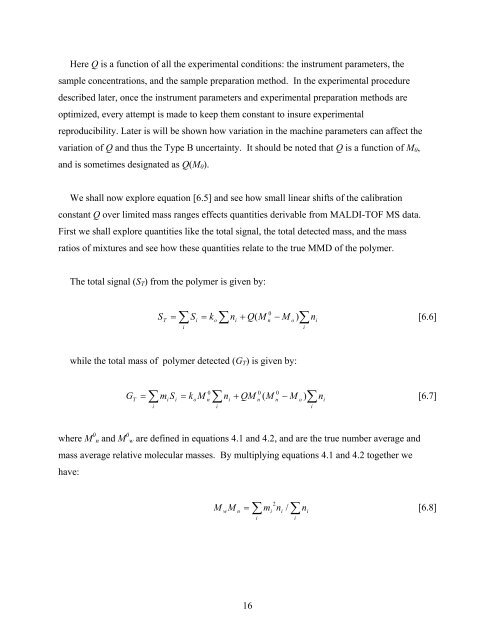
Here Q is a function <strong>of</strong> all the experimental conditions: the instrument parameters, thesample concentrations, and the sample preparation method. In the experimental proceduredescribed later, once the instrument parameters and experimental preparation methods areoptimized, every attempt is made to keep them constant to insure experimentalreproducibility. Later is will be shown how variation in the machine parameters can affect thevariation <strong>of</strong> Q and thus the Type B uncertainty. It should be noted that Q is a function <strong>of</strong> M 0 ,and is sometimes designated as Q(M 0 ).We shall now explore equation [6.5] and see how small linear shifts <strong>of</strong> the calibrationconstant Q over limited mass ranges effects quantities derivable from MALDI-TOF MS data.First we shall explore quantities like the total signal, the total detected mass, and the massratios <strong>of</strong> mixtures and see how these quantities relate to the true MMD <strong>of</strong> the polymer.The total signal (S T ) from the polymer is given by:∑∑0S = S = k n + Q(M − M )Tiioino∑ini[6.6]while the total mass <strong>of</strong> polymer detected (G T ) is given by:∑∑00 0G = m S = k M n + QM ( M − M )Tiiioniinno∑ini[6.7]where M 0 n and M 0 w are defined in equations 4.1 and 4.2, and are the true number average andmass average relative molecular masses. By multiplying equations 4.1 and 4.2 together wehave:∑M M = m n /wni2ii∑ini[6.8]16


