Power Point Presentation (PDF)
Power Point Presentation (PDF)
Power Point Presentation (PDF)

Create successful ePaper yourself
Turn your PDF publications into a flip-book with our unique Google optimized e-Paper software.
Preliminary ResultsParameters Studied – Fall 2004Substrate Concentration (g/L)20151050Substrate ConcentrationTA ResultsEthanol Concentration0 500 1000 1500Time (min)Results of the base line study (20 g/L of glucose and 4 g/L yeast) at 36°CpH kept between 5.5 and 4.0Samples taken every 45 minutes109876543210Ethanol Concentration (g/L)The students proposed to achieve in an interactive manner the followinggoals:1) Study and analyze the ethanol yield at different initial glucoseconcentrations2) Review the yeast fermentation kinetic models available in the literature,with and without substrate and product inhibitionThe students suggested to study the effect of the following sugar (substrate)concentrations according to the table below:GroupsGroup 1Group 2Group 3Group 4Group 5Concentration50 g/l of sugar100 g/l of sugar150 g/l of sugar200 g/l of sugar250 g/l of sugarTemperature = 36ºCpH = 4.0-5.5Yeast = Saccharomyces cerevisiaeAgitation = 92.5 rpmSuch different set of conditions allow the groups to share their experimentaldata to discuss the effect of substrate concentration and inhibition on ethanolproductionChemical Reaction Engineering LaboratoryChemical Reaction Engineering LaboratoryStudent’s Sample ResultsStudent’s Sample ResultsYeast concentration inside thereactor (g/L)10.90.80.70.60.50.40.30.20.10Glucose 50 g/LGlucose 100 g/LGlucose 150 g/LGlucose 200 g/LGlucose 250 g/L0 10 20 30 40 50Time (hr)Yeast concentration inside the fermentor throughoutthe experimentation timeThe plot shows that at high initial glucose concentrations thegrowth of the yeast gets affected and thus, the yeast takes longertime to inhibit the growth.Chemical Reaction Engineering LaboratoryEthanol Concentration insidethe reactor (g/L)876543210Glucose 50 g/LGlucose 100 g/LGlucose 150 g/LGlucose 200 g/LGlucose 250 g/L0 10 20 30 40 50Time (hr)Ethanol production throughout the experimentationtimeYeast was not incubated prior to experiment which explains the delay inthe production of ethanol for all groupsFrom the figure initial glucose concentrations of 50, 100, and 150 g/Lallowed fermentor to reach its maximum capacityFor the 2 highest glucose concentrations students believe that the time forthe experiment was not long enoughChemical Reaction Engineering Laboratory
Problems EncounteredGroup 1 (50 g/L):1. Errors given by the analytical equipment2. Error in reading gas meterGroup 2 (100 g/L):1. Water bath stopped working after 30 hours2. Error given by misuse of analyzerGroup 3 (150 g/L):1. faulty impeller motor shaft2. faulty pumpsBioethanol Production/ Kinetics RateThe rates of microorganisms’ growth, the consumption ofglucose, and the formation of products are:YYdXdtdPdtdS= rSdt= rX = µ X (1)= r q X (2)P =Yqµ =1 dX=µ Smx dt K + SXPSS= !PPX=dX X !=XodS S ! SdP P != =PodS S ! SoP/SS1o(3)(4)(5)(6)Rate of reaction relative to cell massconcentrationRate of reaction relative to ethanolconcentrationRate of reaction relative to glucoseconcentrationSpecific growth rate without inhibition effectMonod’s modelYield coefficient (X w.r.t. S)Yield coefficient (P w.r.t. S)Chemical Reaction Engineering LaboratoryChemical Reaction Engineering LaboratoryOther ModelsTA Results With Modeling_ mXSPq PY P/Sµ Sµ =(5)Km2S1+ S + S / KSI1Substrate inhibition (Haldane Model)()11mSSekPKSµµ=!+()22PPSSqekPKS!="+ (6 & 7) Aiba Model (Aiba et al, 1968)112211ammSbppmSSPPKSSPqPKSµµ!"#$%=&'()*++,'(-."#$%=&'()*++,'(-.(8 & 9) Luong Model ( Loung, 1985)= maximum specific growth rate Ks1= saturation coefficient for cell growth on glucose= cell mass concentration Ks2 = saturation coefficient for ethanol on glucose= glucose concentrationK1 = Aiba’s exponent for cell formation (L/g)= ethanol concentrationK2 = Aiba’s exponent for ethanol formation (L/g)= specific ethanol production rate a = Luong constant for cell formation (L/hour)= ethanol yield factorb = Luong’s constant for ethanol formation (g/L)Substrate Concentration (g/L)2015105Glucose and Ethanol Concentration vs Time000 500 1000 1500Time (min)Substrate Concentration Model-SEthanol Concentration Model-P10987654321Ethanol Concentration (g/L)dXdtdSdtdPdt= r= rX= µS= !Experimental data consistent with basic Monod modelKinetic parameters are obtained from Baltes, M.(1994, Biotechnol. Prog.)Analytical technique to measure cell concentration not available at thetime_ mK Iq Pq SqXSXµmSµ =K + Sµ = 0.386q= r =S= 12.44PqPXq = 5. 2mK = 0.1= maximum specific growth rate= saturation coefficient for cell growth= specific ethanol production rate= specific glucose production rateIPIChemical Reaction Engineering LaboratoryChemical Reaction Engineering Laboratory
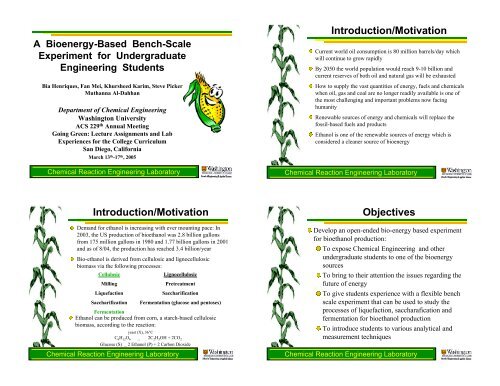
SummaryFuture WorkFlexible experimental setup has been developed and tested foran open-ended study to produce ethanol as a bioenergy sourceAn interactive learning approach to teach a laboratoryexperiment for undergraduate Chemical Engineering and otherstudents has been establishedThe effect of substrate concentration on corn syrupfermentation using a specific strain of Saccharomycescerevisiae has been studied during Fall 2004Future students will be able to study different parameters suchas temperature, degree of agitation, pH range, different culturetypes (yeast strains) and others or repeat questionable resultsExtend the utilization of the bioreactor setup to investigate in thefuture liquefaction, saccharification and Simultaneoussaccharification and fermentation (SSF) processesElucidate the nature of the fermentation process, its biological,chemical, or physical basisModify the bioreactor setup for automatic pH controlReferences:http://www.meadmadecomplicated.org/science/fermentation.htmlhttp://www.andrew.cmu.edu/user/jitkangl/Fermentation%20of%20Ethanol/Fermentation%20of%20Ethanol.htmhttp://www.ifp.fr/IFP/en/IFP02OGS.nsf/(VNoticesOGST)/FDD676FDF98DDE0EC1256CDE00582457/$file/ogiers_v54n1.pdf?openelementChemical Reaction Engineering LaboratoryChemical Reaction Engineering Laboratory