Thermal Expansion Coefficients - Galileo and Einstein
Thermal Expansion Coefficients - Galileo and Einstein
Thermal Expansion Coefficients - Galileo and Einstein
- No tags were found...

You also want an ePaper? Increase the reach of your titles
YUMPU automatically turns print PDFs into web optimized ePapers that Google loves.
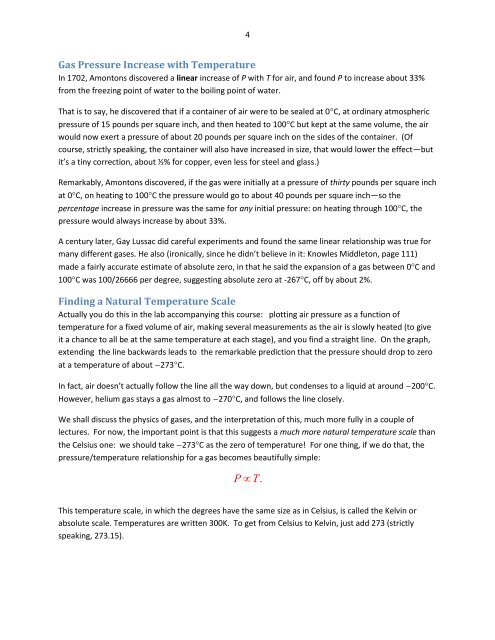
4Gas Pressure Increase with TemperatureIn 1702, Amontons discovered a linear increase of P with T for air, <strong>and</strong> found P to increase about 33%from the freezing point of water to the boiling point of water.That is to say, he discovered that if a container of air were to be sealed at 0C, at ordinary atmosphericpressure of 15 pounds per square inch, <strong>and</strong> then heated to 100C but kept at the same volume, the airwould now exert a pressure of about 20 pounds per square inch on the sides of the container. (Ofcourse, strictly speaking, the container will also have increased in size, that would lower the effect—butit’s a tiny correction, about ½% for copper, even less for steel <strong>and</strong> glass.)Remarkably, Amontons discovered, if the gas were initially at a pressure of thirty pounds per square inchat 0C, on heating to 100C the pressure would go to about 40 pounds per square inch—so thepercentage increase in pressure was the same for any initial pressure: on heating through 100C, thepressure would always increase by about 33%.A century later, Gay Lussac did careful experiments <strong>and</strong> found the same linear relationship was true formany different gases. He also (ironically, since he didn’t believe in it: Knowles Middleton, page 111)made a fairly accurate estimate of absolute zero, in that he said the expansion of a gas between 0C <strong>and</strong>100C was 100/26666 per degree, suggesting absolute zero at -267C, off by about 2%.Finding a Natural Temperature ScaleActually you do this in the lab accompanying this course: plotting air pressure as a function oftemperature for a fixed volume of air, making several measurements as the air is slowly heated (to giveit a chance to all be at the same temperature at each stage), <strong>and</strong> you find a straight line. On the graph,extending the line backwards leads to the remarkable prediction that the pressure should drop to zeroat a temperature of about 273C.In fact, air doesn’t actually follow the line all the way down, but condenses to a liquid at around 200C.However, helium gas stays a gas almost to 270C, <strong>and</strong> follows the line closely.We shall discuss the physics of gases, <strong>and</strong> the interpretation of this, much more fully in a couple oflectures. For now, the important point is that this suggests a much more natural temperature scale thanthe Celsius one: we should take 273C as the zero of temperature! For one thing, if we do that, thepressure/temperature relationship for a gas becomes beautifully simple:PT.This temperature scale, in which the degrees have the same size as in Celsius, is called the Kelvin orabsolute scale. Temperatures are written 300K. To get from Celsius to Kelvin, just add 273 (strictlyspeaking, 273.15).