Chapter I Regional Demographic and Land Use Analysis
Chapter I Regional Demographic and Land Use Analysis
Chapter I Regional Demographic and Land Use Analysis
- No tags were found...

Create successful ePaper yourself
Turn your PDF publications into a flip-book with our unique Google optimized e-Paper software.
Florida Statewide<strong>Regional</strong> EvacuationStudy Program<strong>Regional</strong><strong>Demographic</strong> <strong>and</strong>L<strong>and</strong> <strong>Use</strong> <strong>Analysis</strong>
Volume 1-11Technical Data ReportSouth Florida Region<strong>Chapter</strong> I<strong>Regional</strong> <strong>Demographic</strong> <strong>and</strong>L<strong>and</strong> <strong>Use</strong> <strong>Analysis</strong>
Volume 1-11 South FloridaStatewide <strong>Regional</strong> Evacuation Studies ProgramThis page intentionally left blank.<strong>Chapter</strong> I<strong>Regional</strong> <strong>Demographic</strong> <strong>and</strong> L<strong>and</strong> <strong>Use</strong> <strong>Analysis</strong>
Statewide <strong>Regional</strong> Evacuation Studies ProgramVolume 1-11 South FloridaTable of ContentsA. Population Characteristics <strong>and</strong> Their Implications for Evacuation Dynamics ......................I-11. Overall Population ...................................................................................................I-12. Group Quarters Population.......................................................................................I-23. Housing Units by Type.............................................................................................I-24. Occupied Housing Units (Households) ......................................................................I-35. Household Size .......................................................................................................I-36. Seasonal Dwelling Units...........................................................................................I-37. Vehicles per Household............................................................................................I-38. Age Composition .....................................................................................................I-49. Race / Ethnicity.......................................................................................................I-410. Place of Birth <strong>and</strong> Citizenship ...................................................................................I-411. Linguistic Isolation ..................................................................................................I-512. Labor Force ............................................................................................................I-513. Poverty Status.........................................................................................................I-514. Small Area Dwelling Unit <strong>and</strong> Population Data...........................................................I-5B. Future L<strong>and</strong> <strong>Use</strong> <strong>Analysis</strong> ..............................................................................................I-6<strong>Regional</strong> <strong>Demographic</strong> <strong>and</strong> L<strong>and</strong> <strong>Use</strong> <strong>Analysis</strong><strong>Chapter</strong> I – Table of Contents
Volume 1-11 South FloridaStatewide <strong>Regional</strong> Evacuation Studies ProgramList of TablesTable Title PageI-1a Resident Population by Age, April 1, 2006, 2010 <strong>and</strong> 2015 ...................................I-8I-1b Change in Resident Population by Age, 2006-10, 2010-15 <strong>and</strong> 2006-15 ................I-8I-2a Resident Population by Race/Ethnicity, April 1, 2006, 2010 <strong>and</strong> 2015....................I-9I-2b Change in Resident Population by Race/Ethnicity, 2006-10, 2010-15 <strong>and</strong>2006-15 ............................................................................................................I-9I-3 Licensed Public Lodging Facilities, 2007............................................................. I-10I-4a Housing Units by Vacancy Status <strong>and</strong> Tenure by Units in Structure, 2000............ I-11I-4b Housing Units by Vacancy Status <strong>and</strong> Tenure by Units in Structure, 2006............ I-11I-5a Residents by Tenure by Units in Structure, 2000................................................ I-12I-5b Residents by Tenure by Units in Structure, 2006................................................ I-12I-6a Number of Vacant Units by Vacancy Status, 2000 .............................................. I-13I-6b Number of Vacant Units by Vacancy Status, 2006 .............................................. I-13I-7a Occupied Housing Units by Tenure by Vehicles Available, 2000........................... I-14I-7b Occupied Housing Units by Tenure by Vehicles Available, 2006........................... I-14I-8a Number of Vehicles by Tenure <strong>and</strong> Vehicles per Occupied Unit, 2000.................. I-14I-8b Number of Vehicles by Tenure <strong>and</strong> Vehicles per Occupied Unit, 2006.................. I-14I-9a Resident Population by Gender <strong>and</strong> Age, 2000................................................... I-15I-9b Resident Population by Gender <strong>and</strong> Age, 2006................................................... I-15I-10a Resident Population by Race <strong>and</strong> Ethnicity, 2000 ............................................... I-16I-10b Resident Population by Race <strong>and</strong> Ethnicity, 2006 ............................................... I-16I-11a Resident Population by Age, Household Type <strong>and</strong> Relationship, 2000.................. I-17I-11b Resident Population by Age, Household Type <strong>and</strong> Relationship, 2006.................. I-17I-12a Resident Population by Place of Birth <strong>and</strong> Citizenship Status, 2000 ..................... I-18I-12b Resident Population by Place of Birth <strong>and</strong> Citizenship Status, 2006 ..................... I-18I-13a Households by Language <strong>and</strong> Linguistic Isolation, 2000 ..................................... I-19I-13b Households by Language <strong>and</strong> Linguistic Isolation, 2006 ..................................... I-19I-14a Civilian Non-Institutionalized Population 5 Years <strong>and</strong> Over by DisabilityStatus, 2000.................................................................................................... I-20I-14b Civilian Non-Institutionalized Population 5 Years <strong>and</strong> Over by DisabilityStatus, 2006.................................................................................................... I-20I-15a Resident Population 16 Years <strong>and</strong> Over by Gender <strong>and</strong> Employment Status,I-15b2000 ............................................................................................................... I-21Resident Population 16 Years <strong>and</strong> Over by Gender <strong>and</strong> Employment Status,2006 ............................................................................................................... I-21I-16a Resident Population by Poverty Status <strong>and</strong> by Age, 2000 ................................... I-22I-16b Resident Population by Poverty Status <strong>and</strong> by Age, 2006 ................................... I-22I-17 Generalized Future L<strong>and</strong> <strong>Use</strong>s, 2006 ................................................................. I-23<strong>Chapter</strong> I – Table of Contents<strong>Regional</strong> <strong>Demographic</strong> <strong>and</strong> L<strong>and</strong> <strong>Use</strong> <strong>Analysis</strong>
Statewide <strong>Regional</strong> Evacuation Studies ProgramVolume 1-11 South FloridaList of MapsMap Title PageH1 Number of Vacant Seasonal Housing Units ........................................................ I-24H4 Average Household Size ................................................................................... I-25H5 Number of Mobile Homes ................................................................................. I-26H8 Number of Households with No Vehicle ............................................................. I-27P1 Residents per square mile ................................................................................ I-28P5 Percent of Population Living in Group Quarters.................................................. I-29P6 Population Over Age 65 Living Alone................................................................. I-30P8 Number of Linguistically Isolated Households - Other Languages ........................ I-31FLUM Generalized Future L<strong>and</strong> <strong>Use</strong>, 2006................................................................... I-32List of AppendicesIAIBIC<strong>Demographic</strong> <strong>and</strong> L<strong>and</strong> <strong>Use</strong> <strong>Analysis</strong> – Broward County<strong>Demographic</strong> <strong>and</strong> L<strong>and</strong> <strong>Use</strong> <strong>Analysis</strong> – Miami-Dade County<strong>Demographic</strong> <strong>and</strong> L<strong>and</strong> <strong>Use</strong> <strong>Analysis</strong> – Monroe County<strong>Regional</strong> <strong>Demographic</strong> <strong>and</strong> L<strong>and</strong> <strong>Use</strong> <strong>Analysis</strong><strong>Chapter</strong> I – Table of Contents
Volume 1-11 South FloridaStatewide <strong>Regional</strong> Evacuation Studies ProgramThis page intentionally left blank.<strong>Chapter</strong> I – Table of Contents<strong>Regional</strong> <strong>Demographic</strong> <strong>and</strong> L<strong>and</strong> <strong>Use</strong> <strong>Analysis</strong>
Statewide <strong>Regional</strong> Evacuation Studies ProgramVolume 1-11 South FloridaCHAPTER IREGIONAL DEMOGRAPHIC AND LAND USEANALYSISA. Population Characteristics <strong>and</strong> Their Implications forEvacuation Dynamics1. Overall Population 1In February 2007, the University of Florida’s Bureau of Economic <strong>and</strong> Business Research(BEBR) estimated that the permanent resident population of South Florida on April 1, 2006(Table I-1a), was 4,270,694, up by 314,725 (8.0%) from the 2000 Census. Although SouthFlorida is the most populous region in Florida (23.3% of the total), it placed third in absolutegrowth in the State over that period, behind East Central Florida <strong>and</strong> Tampa Bay. BEBRprojects the population will reach 4,519,383 in 2010 <strong>and</strong> 4,806,794 in 2015, whichrepresents increases of 14.2% <strong>and</strong> 21.5%, respectively, in comparison to the 2000 Census.The projection for 2015 also represents an increase of more than 536,000 (12.6%) abovethe baseline population in 2006, which would place South Florida second in the State,behind East Central Florida, in absolute growth for the period.Over two-thirds of the l<strong>and</strong> <strong>and</strong> water area of South Florida is set aside as part of theEverglades system, with growth concentrated in the coastal areas to the east (Map P1),1Population estimates <strong>and</strong> projections customarily distinguish between the permanent residentpopulation in a jurisdiction (people who reside in the location year-round or at least half of the time) <strong>and</strong>the seasonal population (people who reside in the location only a portion of the year or who are visitors,such as tourists). The permanent resident population is further broken into those who reside inhouseholds (occupied housing units) <strong>and</strong> those who are in group quarters, such as correctional facilities,nursing homes, military quarters, group homes, etc. The decennial census <strong>and</strong> the Census Bureau’s newAmerican Community Survey (ACS) present results for the permanent resident population, but not for theseasonal population. However, both the census <strong>and</strong> the ACS present data on vacant housing units,including those that are for seasonal use. Typically, local jurisdictions use these seasonal housing unitestimates, along with hotel <strong>and</strong> motel inventories, to prepare estimates <strong>and</strong> projections of the seasonalpopulation for planning purposes. The estimates <strong>and</strong> projections prepared by the University of Florida’sBureau of Economic <strong>and</strong> Business Research (BEBR) also refer to the permanent resident population.Most of the data presented in this section is drawn from the sample portion of the 2000 Census ofPopulation <strong>and</strong> Housing (Summary File 3) <strong>and</strong> from the 2006 ACS. The latter was tabulated only for the40 counties that had a 2006 population of at least 65,000 permanent residents, so there is no 2006 ACSdata for the 27 smallest counties in the State of Florida – in those counties, the 2006 tables will show“N.A.” in all cells. Note that the annual ACS is collected for a much smaller sample than the 2000Census, resulting in much larger margins of error. In addition, there are differences in the methodologythat can affect the meaning of the data collected. As a result, comparisons should be made with caution.In some cases, although 2006 ACS data was tabulated for a county, the small sample size resulted ininsufficient data to fill all of the cells in a given table – in those cases, the 2006 tables will show “N.A.” inselected cells. <strong>Regional</strong> summaries based on the 2006 ACS were compiled only for the 3 regions whereall counties had data: South Florida, Tampa Bay <strong>and</strong> Treasure Coast.<strong>Regional</strong> <strong>Demographic</strong> <strong>and</strong> L<strong>and</strong> <strong>Use</strong> <strong>Analysis</strong> Page I-1
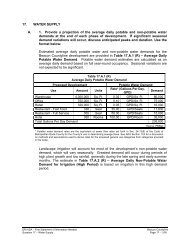
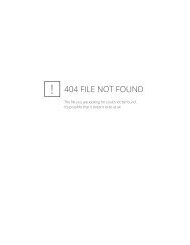
Volume 1-11 South FloridaStatewide <strong>Regional</strong> Evacuation Studies Programwhere densities reach those typical in dense urban centers. Projected population growth inSouth Florida is not evenly distributed within the region. Monroe County, an Area of CriticalState Concern, <strong>and</strong> the most vulnerable of the three counties (primarily the Florida Keys), isunder growth controls that limit the amount of residential <strong>and</strong> non-residential growth. As aresult, its resident population is projected to remain almost unchanged throughout theperiod. Miami-Dade <strong>and</strong> Broward each are expected to grow by over 250,000 between2006 <strong>and</strong> 2015, primarily through infill development <strong>and</strong> redevelopment. Areas that fall intocurrently-defined storm surge <strong>and</strong> hurricane evacuation zones in both counties are largelybuilt out, so most additional population is expected to be accommodated inl<strong>and</strong>, in areasthat are less vulnerable. Still, the region’s large <strong>and</strong> growing population will continue topresent challenges for evacuations due to other hazards (inl<strong>and</strong> flooding, nuclear accidents,terrorist attacks, etc.).2. Group Quarters PopulationIn 2000, there were 67,231 South Florida residents living in group quarters (1.7% of thepopulation); 43,296 of these were institutionalized in correctional facilities, nursing homes,<strong>and</strong> juvenile institutions, while the other 23,935 were in other group quarters, such ascollege dormitories, group homes <strong>and</strong> military quarters (Table I-11a <strong>and</strong> Map P5). Theremaining 3,888,738 residents of South Florida lived in households. Miami-Dade Countyhad the largest share of the population in group quarters (2.0%), while Broward County hadthe smallest (1.2%). The group quarters population in the Florida Keys, though smaller inabsolute terms, requires evacuation in all storm events of Category 3 or higher. In 2006,the group quarters population had increased to almost 82,000, about 1.9% of the total(Table I-11b). In addition, the age composition changed during the period – in 2006, only25.7% of the group quarters population was 65 years or older, down from 31.4% in 2000.This was similar to the proportion of elderly in group quarters in the State of Florida in 2006(24.2%). The group quarters population is a significant component of those with “specialneeds” that require special procedures in the event of an evacuation.3. Housing Units by TypeOf the 1,644,938 housing units in South Florida at the time of the 2000 Census, 42.0%were single-family, 54.6% were multi-family, <strong>and</strong> the other 3.3% were mobile homes,boats, recreational vehicles (RVs) or others used as dwelling units (Table I-4a). Of thoseunits, 178,633 (10.9%) were vacant, with the highest vacancy rates found among multifamilybuildings (condos, many of which are on the barrier isl<strong>and</strong>s) <strong>and</strong> among mobilehomes (Map H1). Mobile homes, boats <strong>and</strong> RVs are a much smaller component of thehousing stock in South Florida than in the State of Florida as a whole (where 12.0% of allunits were classified in this category) – Monroe County was the exception within the region,with 20.5% of its housing stock in this category (Map H5).According to the 2006 ACS (Table I-4b), the total number of housing units in the regionincreased by 9.6% (more than 158,000 new units), while the number of vacant units roseby 45.0% to over 259,000 (14.4% of the total). The proportion of single-family units roseto 46.3% while the proportion of multi-family fell slightly to 51.4%, which is still muchhigher than the average share of multi-family units in the State of Florida in 2006 (32.5%).In the same period, the number of mobile homes, boats, recreational vehicles <strong>and</strong> othersused as dwelling units declined, from 54,682 in 2000 to under 49,000.Page I-2<strong>Regional</strong> <strong>Demographic</strong> <strong>and</strong> L<strong>and</strong> <strong>Use</strong> <strong>Analysis</strong>
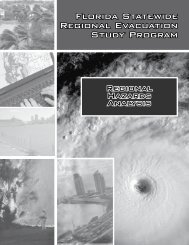
Statewide <strong>Regional</strong> Evacuation Studies ProgramVolume 1-11 South Florida4. Occupied Housing Units (Households)There were 1,466,305 occupied housing units (households) in South Florida in 2000, 63.1%of which were occupied by owners <strong>and</strong> 36.9% by renters (Table I-4a). The ownership ratioin the region was well below the State of Florida average (70.1%), due to the lower rates inMiami-Dade (57.8%) <strong>and</strong> Monroe (62.4%). By 2006 (Table I-4b), the number ofhouseholds had risen by 5.3% to almost 1,544,000, while the proportion of owner-occupiedunits in the region rose to 64.8%.5. Household SizeIn 2000, the average household size (number of persons per occupied unit) in South Floridawas 2.65 (Table I-5a), which was higher than the State of Florida average of 2.46. Theaverage household size was highest in Miami-Dade County (2.84) <strong>and</strong> lowest in MonroeCounty (2.23). Renters, who are mostly concentrated in multi-family units, had a lowerhousehold size (2.49) than owners (2.75), who are more heavily concentrated in singlefamilyunits. Average household sizes also were generally lower in the coastal areas ofMiami-Dade <strong>and</strong> Broward (Map H4). Contrasting with trends over the previous twodecades, the average household size rose in South Florida between 2000 <strong>and</strong> 2006 (Table I-5b), to 2.71 (the State average rose to 2.49). In addition, the average size of renterhouseholds narrowed the gap with owner households, rising to 2.58 in 2006. This likelyreflects such factors as the changing age composition of the population in recent years(more young families with children), as well as the increasing difficulty of finding affordablehousing (leading to delays in the decision to form new households).6. Seasonal Dwelling UnitsIn 2000 there were 93,817 vacant dwelling units in South Florida that were for seasonal,recreational or occasional use, representing 5.7% of all units (Table I-6a). By 2006 (TableI-6b), this number had increased by 23.8% to more than 116,000 units (6.4% of the total).In addition, according to licensing records of the Florida Department of Business <strong>and</strong>Professional Regulation (Table I-3), in 2007 there were 437 hotels with 57,473 rooms, 597motels with 22,312 rooms, <strong>and</strong> 57 bed <strong>and</strong> breakfast inns with 511 rooms in South Florida.Together, these units house a seasonal population that is in addition to the permanentresident population estimated above. Considering that many of these units are invulnerable areas, the proportion of seasonal units <strong>and</strong> hotel/motel units that are occupied atany point in time will have an important impact on the total population that may participatein an evacuation.7. Vehicles per HouseholdThere were 175,651 South Florida households in 2000 that had no vehicle (12.0% of allhouseholds) – roughly two-thirds of these were renters (Table I-7a <strong>and</strong> Map H8). This wasmuch higher than the average for the State of Florida as a whole (8.1%), <strong>and</strong> represents asignificant number of households that could need transportation assistance in the event of amajor evacuation. Between 2000 <strong>and</strong> 2006, the number of households with no vehicledecreased by almost 28,000 to a little less than 147,000 (Table I-7b). The number ofhouseholds with 2 or more vehicles rose from 688,237 in 2000 to 794,000 in 2006, <strong>and</strong> thetotal number of vehicles in households increased to 2.5 million, up 274,000 in 6 years. In<strong>Regional</strong> <strong>Demographic</strong> <strong>and</strong> L<strong>and</strong> <strong>Use</strong> <strong>Analysis</strong> Page I-3
Volume 1-11 South FloridaStatewide <strong>Regional</strong> Evacuation Studies Programother words, the number of vehicles per household in South Florida rose from 1.51 to 1.61between 2000 <strong>and</strong> 2006 (Tables I-8a <strong>and</strong> I-8b), which could contribute to additionalcongestion on the highways in evacuation scenarios.8. Age CompositionIn 2000, the population of South Florida included 572,303 people who were at least 65years old, which represented 14.5% of the total population (Table I-9a). This compared to17.6% for the State of Florida as a whole – all three South Florida counties were below thestate average. Over a quarter of the region’s elderly residents (153,516) lived alone (TableI-11a), <strong>and</strong> many lived in coastal areas (Map P6). Moreover, 81,384 residents (2.1% of thetotal) were at least 85 years old. By 2006 (Table I-9b), the elderly population had increasedby almost 32,000, although its share of the total population declined to only 14.2%, <strong>and</strong> thenumber living alone remained roughly constant (Table I-11b). During the same period, thenumber of children under 18 increased by 52,000, from 952,333 (24.1%) to 1,015,000(23.8%). In 2006), 729,000 South Florida children were of school age (5 to 17 years old),up from 702,019 in 2000.9. Race / EthnicityThe Hispanic or Latino population, which includes those born abroad as well as those borninto Hispanic families in the United States, included 1,575,704 residents (39.8% of the totalpopulation) in 2000 (Table I-10a), <strong>and</strong> increased by another 318,000, to 44.4% of the total,in 2006 (Table I-10b). Miami-Dade County led the region with Hispanics representing61.3% of the population in 2006, but both Broward (16.7%) <strong>and</strong> Monroe (15.7%) also hadsignificant <strong>and</strong> growing Hispanic populations. The Black or African American population,which in South Florida includes many people from the Caribbean <strong>and</strong> Central <strong>and</strong> SouthAmerica, also grew significantly, from 749,753 (19.0% of the total) in 2000 to 871,000(20.4%) in 2006 (ACS). The Hispanic population is projected to grow to almost 2.4 million(49.5% of the region’s total) in 2015 (Table I-2a). The Black or African Americanpopulation is also projected to grow significantly, reaching about 1.1 million (22.4%) in2015. The White non-Hispanic population is projected to decline from almost 1.4 million(32.2%) in 2006 to a little more than 1.2 million in 2015 (25.3%).10. Place of Birth <strong>and</strong> CitizenshipIn 2000, almost four out of every ten South Florida residents (1,569,884) were born abroad(Table I-12a). By 2006, there were another 184,000 foreign-born residents living in SouthFlorida (Table I-12b). The vast majority (87.0%) of these residents in 2000 came from theCaribbean <strong>and</strong> Central <strong>and</strong> South America – the largest groups were from Cuba (563,164),Haiti (118,649), Colombia (114,065), Jamaica (94,813) <strong>and</strong> Nicaragua (90,462). More thanhalf of the foreign-born residents in 2000 (846,159) were not citizens, a number whichincreased by more than 76,000 in the first six years of this decade. In addition, almost athird of the residents of South Florida in 2000 (31.5%) were born in other parts of theUnited States. The remaining residents (28.8%) were born somewhere in the State ofFlorida.Page I-4<strong>Regional</strong> <strong>Demographic</strong> <strong>and</strong> L<strong>and</strong> <strong>Use</strong> <strong>Analysis</strong>
Statewide <strong>Regional</strong> Evacuation Studies ProgramVolume 1-11 South Florida11. Linguistic IsolationAs a result of the growth in the diversity of the population in South Florida, the level oflinguistic isolation (households where no one 14 years or older speaks English “very well”)also is large <strong>and</strong> growing. In 2000, 229,174 households (15.6%) were classified aslinguistically isolated (Table I-13a). Spanish was spoken in 83.7% of these households –the availability of radio <strong>and</strong> television broadcasts in Spanish, as well as many serviceproviders who speak Spanish, makes this less problematic in Miami-Dade County, <strong>and</strong>increasingly elsewhere in South Florida. Still, there were 37,363 linguistically isolatedhouseholds in 2000 where a language other than Spanish was spoken (Map P8), <strong>and</strong> thisnumber increased by almost 6,000 households (15.6%) in the first six years of this decade(Table I-13b).12. Labor ForceIn 2000, there were over 1.2 million people 16 years old <strong>and</strong> over in South Florida (40.2%)who were not in the labor force (Table I-15a). This was a little less than the share of theinactive population in the State of Florida as a whole (41.3%), due at least in part to thehigher proportion of retirees in other parts of the State. In the region, the inactivepopulation was highest in Miami-Dade County (42.5%). By 2006, the inactive population inSouth Florida had fallen to 36.3% (Table I-15b), compared to 39.0% in the State of Florida.13. Poverty StatusThere were 589,561 South Florida residents in 2000 that lived in households with incomesbelow the poverty level (Table I-16a), accounting for 15.2% of the total population.Poverty rates were highest among children (20.1%), but 14.6% of elderly residents alsolived below the poverty level. Poverty rates were highest in Miami-Dade County (18.0%),which accounted for two-thirds of all of the region’s poorest residents. While the overallpoverty rate fell slightly between 2000 <strong>and</strong> 2006, to 14.1%, the rate for the elderlypopulation rose to 17.7% (Table I-16b). The poor elderly, especially those living alone, mayrepresent a significant portion of those households without vehicles, which constitutes asubstantial challenge for evacuation planning.14. Small Area Dwelling Unit <strong>and</strong> Population DataThe development of small area dwelling unit <strong>and</strong> population estimates <strong>and</strong> projections forSouth Florida, to be used in the transportation analysis, required different approaches ineach of the three counties. Both Broward <strong>and</strong> Miami-Dade Counties use Traffic <strong>Analysis</strong>Zones (TAZs) in transportation modeling, so this geography was chosen as the basis forpreparing input data for the evacuation transportation analysis. In Monroe County, forwhich TAZs have not been defined, census block groups were chosen as the basis fordeveloping the input data.The Broward County Planning Services Division produced <strong>and</strong> delivered housing unit <strong>and</strong>population estimates <strong>and</strong> projections by dwelling unit type, by TAZ, for 2006, 2010 <strong>and</strong>2015, derived from their population forecasting model. This data included occupancy ratesfor each type of dwelling unit as well.<strong>Regional</strong> <strong>Demographic</strong> <strong>and</strong> L<strong>and</strong> <strong>Use</strong> <strong>Analysis</strong> Page I-5
Volume 1-11 South FloridaStatewide <strong>Regional</strong> Evacuation Studies ProgramThe Miami-Dade County Department of Planning <strong>and</strong> Zoning provided a set of household<strong>and</strong> population estimates for 2005 <strong>and</strong> projections for 2035 by TAZ. The estimates for 2006<strong>and</strong> the projections for 2010 <strong>and</strong> 2015 were derived by interpolation, using additional dataprovided by the Miami-Dade County Department of Emergency Management <strong>and</strong> Homel<strong>and</strong>Security.Monroe County does not produce periodic small area dwelling unit <strong>and</strong> household counts forthe entire county. Therefore, the dwelling unit counts <strong>and</strong> population estimates <strong>and</strong>projections by census block group required for the transportation analysis had to bedeveloped by working with each jurisdiction separately. In general, dwelling unit counts bytype from the 2000 Census were established as the starting point, <strong>and</strong> building permits <strong>and</strong>certificates of occupancy were reviewed <strong>and</strong> allocated to census block groups to determinethe changes in dwelling units as of the end of 2009. These were extended to 2010 <strong>and</strong>2015 based on the annual dwelling unit allocations under the rate of growth regulations ineach jurisdiction.B. Future L<strong>and</strong> <strong>Use</strong> <strong>Analysis</strong>South Florida is the largest of the eleven planning regions in the State of Florida, with atotal area of almost 4.8 million acres (7,488 square miles), of which 4,148 square miles arel<strong>and</strong> area <strong>and</strong> 3,340 square miles (44.6%) are water. It is bounded on the east by theAtlantic Ocean, on the north <strong>and</strong> west by Palm Beach County, Hendry County <strong>and</strong> CollierCounty, <strong>and</strong> on the south <strong>and</strong> west by the Gulf of Mexico. The region is home to a totalresident population of 4.3 million in 2006, the majority of which lives within the boundariesof 71 municipalities. The unincorporated portions of the counties were home to 1.2 millionresidents in 2006, about 27.2% of the regional total.Approximately 1.9 million acres of the l<strong>and</strong> area (71.7%) of the three counties aredesignated for conservation. These areas include Everglades National Park <strong>and</strong> Big CypressNational Preserve, the Water Conservation Areas that are part of the larger Evergladessystem, Biscayne National Park <strong>and</strong> Dry Tortugas National Park, four national wildliferefuges (Great White Heron, National Key Deer, Key West <strong>and</strong> Crocodile Lake) <strong>and</strong> fifteenstate parks, all of which help to preserve habitat for threatened <strong>and</strong> endangered species(see Table I-17 <strong>and</strong> Map FLUM).Monroe County includes both the mainl<strong>and</strong> portion of the County <strong>and</strong> the Florida Keys, thelong string of isl<strong>and</strong>s extending 110 miles from Key Largo southwest to the City of KeyWest. The County also is home to the Florida Keys National Marine Sanctuary, created toprotect North America’s only coral reef, the third largest coral reef system in the world.The developed portion of Broward <strong>and</strong> Miami-Dade Counties is largely built out, <strong>and</strong>additional growth in the Florida Keys is subject to environmental <strong>and</strong> public safetyconstraints. This means that future development in the region will be based mostly on infill<strong>and</strong> redevelopment. Residential future l<strong>and</strong> uses account for over 351,000 acres (7.3% ofthe total area), most of which (239,000 acres) is reserved for medium-density. Another74,000 acres is classified as low-density residential <strong>and</strong> the other 38,000 acres is for highdensityresidential. Residential uses are spread throughout the region, although most of thelow-density can be found in the western suburbs, while a significant amount of high-densityresidential l<strong>and</strong> can be found to the east, including on or adjacent to the barrier isl<strong>and</strong>.Page I-6<strong>Regional</strong> <strong>Demographic</strong> <strong>and</strong> L<strong>and</strong> <strong>Use</strong> <strong>Analysis</strong>
Statewide <strong>Regional</strong> Evacuation Studies ProgramVolume 1-11 South FloridaSouth Florida also has a significant inventory of agricultural future l<strong>and</strong> use, with 107,000acres, most of which is in south Miami-Dade County. Industrial future l<strong>and</strong> uses occupyalmost 111,000 acres (2.3% of the total), followed by commercial/office with 54,000 acres(1.1%), institutional/government with 24,000 acres (0.5%), <strong>and</strong> mixed-use with 12,000acres (0.3%).<strong>Regional</strong> <strong>Demographic</strong> <strong>and</strong> L<strong>and</strong> <strong>Use</strong> <strong>Analysis</strong> Page I-7
Volume 1-11 South FloridaStatewide <strong>Regional</strong> Evacuation Studies ProgramTable I-1a. Resident Population 2 by Age, April 1, 2006, 2010 <strong>and</strong> 2015South Florida Absolute Number % of Total PopulationAge Categories 2006 2010 2015 2006 2010 2015Age under 5 years 280,358 287,701 297,672 6.56% 6.37% 6.19%Age 5 to 17 years 742,939 773,981 805,848 17.40% 17.13% 16.76%Age 18 to 24 years 372,602 398,941 411,873 8.72% 8.83% 8.57%Age 25 to 34 years 568,403 591,773 637,093 13.31% 13.09% 13.25%Age 35 to 44 years 664,086 652,908 653,241 15.55% 14.45% 13.59%Age 45 to 54 years 605,348 669,875 688,047 14.17% 14.82% 14.31%Age 55 to 64 years 438,299 504,968 585,281 10.26% 11.17% 12.18%Age 65 to 74 years 292,545 322,469 390,886 6.85% 7.14% 8.13%Age 75 to 84 years 213,495 214,576 222,707 5.00% 4.75% 4.63%Age 85 years <strong>and</strong> over 92,619 102,191 114,146 2.17% 2.26% 2.37%Total 4,270,694 4,519,383 4,806,794 100.00% 100.00% 100.00%Age under 18 years 1,023,297 1,061,682 1,103,520 23.96% 23.49% 22.96%Age 65 years <strong>and</strong> over 598,659 639,236 727,739 14.02% 14.14% 15.14%Source: Florida Legislature, Office of Economic <strong>and</strong> <strong>Demographic</strong> Research (August 2007).Table I-1b. Change in Resident Population by Age, 2006-10, 2010-15 <strong>and</strong> 2006-15South Florida Absolute Change % Change in the PeriodAge Categories 2006-10 2010-15 2006-15 2006-10 2010-15 2006-15Age under 5 years 7,343 9,971 17,314 2.62% 3.47% 6.18%Age 5 to 17 years 31,042 31,867 62,909 4.18% 4.12% 8.47%Age 18 to 24 years 26,339 12,932 39,271 7.07% 3.24% 10.54%Age 25 to 34 years 23,370 45,320 68,690 4.11% 7.66% 12.08%Age 35 to 44 years -11,178 333 -10,845 -1.68% 0.05% -1.63%Age 45 to 54 years 64,527 18,172 82,699 10.66% 2.71% 13.66%Age 55 to 64 years 66,669 80,313 146,982 15.21% 15.90% 33.53%Age 65 to 74 years 29,924 68,417 98,341 10.23% 21.22% 33.62%Age 75 to 84 years 1,081 8,131 9,212 0.51% 3.79% 4.31%Age 85 years <strong>and</strong> over 9,572 11,955 21,527 10.33% 11.70% 23.24%Total 248,689 287,411 536,100 5.82% 6.36% 12.55%Age under 18 years 38,385 41,838 80,223 3.75% 3.94% 7.84%Age 65 years <strong>and</strong> over 40,577 88,503 129,080 6.78% 13.85% 21.56%Source: Florida Legislature, Office of Economic <strong>and</strong> <strong>Demographic</strong> Research (August 2007).2Official state <strong>and</strong> county estimates <strong>and</strong> projections published by the University of Florida’s Bureau ofEconomic <strong>and</strong> Business Research (BEBR) were released in database format by the Florida Legislature’sOffice of Economic <strong>and</strong> <strong>Demographic</strong> Research (EDR) in August 2007, with age, gender <strong>and</strong> race/ethnicdetail, <strong>and</strong> interpolations for every quarter of every single year from 1960 (Q2) to 2030 (Q2).Page I-8<strong>Regional</strong> <strong>Demographic</strong> <strong>and</strong> L<strong>and</strong> <strong>Use</strong> <strong>Analysis</strong>
Statewide <strong>Regional</strong> Evacuation Studies ProgramVolume 1-11 South FloridaTable I-2a. Resident Population by Race/Ethnicity, April 1, 2006, 2010 <strong>and</strong> 2015South Florida Absolute Number % of Total PopulationRace/Ethnic Categories 2006 2010 2015 2006 2010 2015White Non-Hispanic 1,373,381 1,285,115 1,215,357 32.16% 28.44% 25.28%Black or African American (NH) 912,719 986,647 1,075,667 21.37% 21.83% 22.38%Other race <strong>and</strong> 2 or more races 105,041 119,509 137,882 2.46% 2.64% 2.87%Hispanic or Latino (all races) 1,879,553 2,128,112 2,377,888 44.01% 47.09% 49.47%Total 4,270,694 4,519,383 4,806,794 100.00% 100.00% 100.00%Source: Florida Legislature, Office of Economic <strong>and</strong> <strong>Demographic</strong> Research (August 2007).Table I-2b. Change in Resident Population by Race/Ethnicity, 2006-10, 2010-15 <strong>and</strong> 2006-15South Florida Absolute Change % Change in the PeriodRace/Ethnic Categories 2006-10 2010-15 2006-15 2006-10 2010-15 2006-15White Non-Hispanic -88,266 -69,758 -158,024 -6.43% -5.43% -11.51%Black or African American (NH) 73,928 89,020 162,948 8.10% 9.02% 17.85%Other race <strong>and</strong> 2 or more races 14,468 18,373 32,841 13.77% 15.37% 31.26%Hispanic or Latino (all races) 248,559 249,776 498,335 13.22% 11.74% 26.51%Total 248,689 287,411 536,100 5.82% 6.36% 12.55%Source: Florida Legislature, Office of Economic <strong>and</strong> <strong>Demographic</strong> Research (August 2007).<strong>Regional</strong> <strong>Demographic</strong> <strong>and</strong> L<strong>and</strong> <strong>Use</strong> <strong>Analysis</strong> Page I-9
Volume 1-11 South FloridaStatewide <strong>Regional</strong> Evacuation Studies ProgramTable I-3. Licensed Public Lodging Facilities, 2007Type of Absolute Number %Lodging Facility Facilities Rooms/Units Facilities Rooms/UnitsHotels 437 57,473 3.98% 15.58%Motels 597 22,312 5.44% 6.05%Non-Transient Apartments 8,693 270,860 79.22% 73.40%Transient Apartments 384 4,536 3.50% 1.23%Non-Transient Rooming Houses 62 1,253 0.57% 0.34%Transient Rooming Houses 79 886 0.72% 0.24%Bed <strong>and</strong> Breakfast Inns 57 511 0.52% 0.14%Resort Condominiums - Single 217 848 1.98% 0.23%Resort Condominiums - Group 129 7,082 1.18% 1.92%Resort Condominiums - Collective 39 1,281 0.36% 0.35%Resort Dwellings - Single 228 494 2.08% 0.13%Resort Dwellings - Group 12 255 0.11% 0.07%Resort Dwellings - Collective 39 1,214 0.36% 0.33%Total 10,973 369,005 100.00% 100.00%Source: Florida Department of Business <strong>and</strong> Professional Regulation, Division of Hotels <strong>and</strong> Restaurants (March 13,2007).Page I-10<strong>Regional</strong> <strong>Demographic</strong> <strong>and</strong> L<strong>and</strong> <strong>Use</strong> <strong>Analysis</strong>
Statewide <strong>Regional</strong> Evacuation Studies ProgramVolume 1-11 South FloridaTable I-4a. Housing Units 3 by Vacancy Status <strong>and</strong> Tenure by Units in Structure, 2000South Florida Occupied Units Vacant Total VacantUnits in Structure Owner Renter Total Units Units %1, detached 577,016 78,243 655,259 36,159 691,418 5.23%1, attached 92,181 44,142 136,323 10,007 146,330 6.84%2 8,829 32,016 40,845 3,824 44,669 8.56%3 or 4 13,456 49,666 63,122 6,377 69,499 9.18%5 to 9 18,526 59,012 77,538 9,064 86,602 10.47%10 to 19 21,939 74,305 96,244 13,949 110,193 12.66%20 to 49 61,601 76,667 138,268 25,977 164,245 15.82%50 or more 100,247 117,773 218,020 59,280 277,300 21.38%Mobile home 31,147 8,226 39,373 12,613 51,986 24.26%Boat, RV, van, etc. 916 397 1,313 1,383 2,696 51.30%Total 925,858 540,447 1,466,305 178,633 1,644,938 10.86%% Single Family 62.32% 14.48% 44.69% 20.24% 42.03%% Multi-Family 34.21% 83.93% 52.54% 71.92% 54.64%% Mobile Home 3.36% 1.52% 2.69% 7.06% 3.16%% Boat, RV, Van, etc. 0.10% 0.07% 0.09% 0.77% 0.16%Source: US Bureau of the Census, 2000 Census of Population <strong>and</strong> Housing (Summary File 3).Table I-4b. Housing Units by Vacancy Status <strong>and</strong> Tenure by Units in Structure, 2006South Florida Occupied Units Vacant Total VacantUnits in Structure Owner Renter Total Units Units %1, detached 627,031 87,640 714,671 52,818 767,489 6.88%1, attached 93,955 49,462 143,417 13,711 157,128 8.73%2 8,843 31,467 40,310 4,972 45,282 10.98%3 or 4 16,136 46,563 62,699 9,156 71,855 12.74%5 to 9 23,412 57,376 80,788 14,784 95,572 15.47%10 to 19 30,553 75,106 105,659 22,395 128,054 17.49%20 to 49 64,939 83,357 148,296 40,027 188,323 21.25%50 or more 107,537 104,366 211,903 88,653 300,556 29.50%Mobile home 26,288 8,385 34,673 12,536 47,209 26.55%Boat, RV, van, etc. 1,003 493 1,496 0 1,496 0.00%Total 999,697 544,215 1,543,912 259,052 1,802,964 14.37%% Single Family 62.72% 16.10% 46.29% 20.39% 42.57%% Multi-Family 34.55% 82.26% 51.37% 74.77% 54.73%% Mobile Home 2.63% 1.54% 2.25% 4.84% 2.62%% Boat, RV, Van, etc. 0.10% 0.09% 0.10% 0.00% 0.08%Source: US Bureau of the Census, 2006 American Community Survey.3 A housing unit is a house, an apartment, a mobile home, a group of rooms, or a single room occupied(or if vacant, intended for occupancy) as separate living quarters. Separate living quarters are those inwhich the occupants live separately from any other people in the building <strong>and</strong> that have direct accessfrom the outside of the building or through a common hall. Both occupied <strong>and</strong> vacant housing units areincluded in the housing unit inventory. Boats, recreational vehicles (RVs), vans, tents, <strong>and</strong> the like arehousing units only if they are occupied as someone’s usual place of residence. Vacant mobile homes areincluded provided they are intended for occupancy on the site where they st<strong>and</strong>. Vacant mobile homeson dealers’ lots, at the factory, or in storage yards are excluded from the housing inventory. Alsoexcluded from the housing inventory are quarters being used entirely for nonresidential purposes, suchas a store or an office, or quarters used for the storage of business supplies or inventory.<strong>Regional</strong> <strong>Demographic</strong> <strong>and</strong> L<strong>and</strong> <strong>Use</strong> <strong>Analysis</strong> Page I-11
Volume 1-11 South FloridaStatewide <strong>Regional</strong> Evacuation Studies ProgramTable I-5a. Residents by Tenure by Units in Structure 4 , 2000South Florida Persons in Occupied Units Persons per Occupied UnitUnits in Structure Owner Renter Total Owner Renter Total1, detached 1,814,635 257,174 2,071,809 3.14 3.29 3.161, attached 249,100 134,259 383,359 2.70 3.04 2.812 21,947 87,061 109,008 2.49 2.72 2.673 or 4 32,070 125,789 157,859 2.38 2.53 2.505 to 9 39,234 137,999 177,233 2.12 2.34 2.2910 to 19 40,614 165,461 206,075 1.85 2.23 2.1420 to 49 101,326 170,529 271,855 1.64 2.22 1.9750 or more 170,454 244,392 414,846 1.70 2.08 1.90Mobile home 72,731 21,345 94,076 2.34 2.59 2.39Boat, RV, van, etc. 1,847 771 2,618 2.02 1.94 1.99Total 2,543,958 1,344,780 3,888,738 2.75 2.49 2.65Source: US Bureau of the Census, 2000 Census of Population <strong>and</strong> Housing (Summary File 3).Table I-5b. Residents by Tenure by Units in Structure, 2006South Florida Persons in Occupied Units Persons per Occupied UnitUnits in Structure Owner Renter Total Owner Renter Total1, detached or attached 2,241,840 452,915 2,694,755 3.11 3.30 3.142 to 4 58,309 209,784 268,093 2.33 2.69 2.605 or more 415,314 719,957 1,135,271 1.83 2.25 2.08Mobile home 60,672 21,810 82,482 2.31 2.60 2.38Boat, RV, van, etc. 1,552 757 2,309 1.55 1.54 1.54Total 2,777,687 1,405,223 4,182,910 2.78 2.58 2.71Source: US Bureau of the Census, 2006 American Community Survey.4 Tables I-5a <strong>and</strong> I-5b present the number of residents in the occupied housing units shown in Tables I-4a <strong>and</strong> I-4b for 2000 <strong>and</strong> 2006, respectively, by type of housing unit. They also show the averagenumber of residents by type of housing unit, which can be used in transportation models to estimate thenumber of evacuating people.Page I-12<strong>Regional</strong> <strong>Demographic</strong> <strong>and</strong> L<strong>and</strong> <strong>Use</strong> <strong>Analysis</strong>
Statewide <strong>Regional</strong> Evacuation Studies ProgramVolume 1-11 South FloridaTable I-6a. Number of Vacant Units by Vacancy Status 5 , 2000South FloridaVacantVacancy Status Units %For rent 36,014 20.16%For sale only 24,603 13.77%Rented or sold, not occupied 11,007 6.16%For seasonal, recreational, or occasional use 93,817 52.52%For migrant workers 129 0.07%Other vacant 13,063 7.31%Total 178,633 100.00%Source: US Bureau of the Census, 2000 Census of Population <strong>and</strong> Housing (Summary File 3).Table I-6b. Number of Vacant Units by Vacancy Status, 2006South FloridaVacantVacancy Status Units %For rent 36,452 14.07%Rented, not occupied 8,735 3.37%For sale only 33,701 13.01%Sold, not occupied 19,702 7.61%For seasonal, recreational, or occasional use 116,123 44.83%For migrant workers 387 0.15%Other vacant 43,952 16.97%Total 259,052 100.00%Source: US Bureau of the Census, 2006 American Community Survey.5Vacancy status <strong>and</strong> other characteristics of vacant units were determined by census enumeratorsobtaining information from l<strong>and</strong>lords, owners, neighbors, rental agents, <strong>and</strong> others. Vacant units forseasonal, recreational, or occasional use are vacant units used or intended for use only in certainseasons, for weekends, or other occasional use throughout the year. Seasonal units include those usedfor summer or winter sports or recreation, such as beach cottages <strong>and</strong> hunting cabins. Seasonal unitsalso may include quarters for such workers as herders <strong>and</strong> loggers. Interval ownership units, sometimescalled shared-ownership or time-sharing condominiums, also are included in this category. Vacantmigrant worker units include those intended for occupancy by migrant workers employed in farm workduring the crop season. (Work in a cannery, a freezer plant, or a food-processing plant is not farmwork.)<strong>Regional</strong> <strong>Demographic</strong> <strong>and</strong> L<strong>and</strong> <strong>Use</strong> <strong>Analysis</strong> Page I-13
Volume 1-11 South FloridaStatewide <strong>Regional</strong> Evacuation Studies ProgramTable I-7a. Occupied Housing Units by Tenure by Vehicles Available 6 , 2000South Florida Number of Occupied Units % of Occupied UnitsVehicles Available Owner Renter Total Owner Renter TotalNo vehicle available 59,914 115,737 175,651 6.47% 21.42% 11.98%1 vehicle available 339,080 263,337 602,417 36.62% 48.73% 41.08%2 vehicles available 381,978 133,695 515,673 41.26% 24.74% 35.17%3 vehicles available 108,179 21,571 129,750 11.68% 3.99% 8.85%4 vehicles available 28,552 4,022 32,574 3.08% 0.74% 2.22%5 or more vehicles available 8,155 2,085 10,240 0.88% 0.39% 0.70%Total 925,858 540,447 1,466,305 100.00% 100.00% 100.00%Source: US Bureau of the Census, 2000 Census of Population <strong>and</strong> Housing (Summary File 3).Table I-7b. Occupied Housing Units by Tenure by Vehicles Available, 2006South Florida Number of Occupied Units % of Occupied UnitsVehicles Available Owner Renter Total Owner Renter TotalNo vehicle available 44,436 102,274 146,710 4.44% 18.79% 9.50%1 vehicle available 338,820 264,093 602,913 33.89% 48.53% 39.05%2 vehicles available 425,624 146,363 571,987 42.58% 26.89% 37.05%3 vehicles available 141,050 24,482 165,532 14.11% 4.50% 10.72%4 vehicles available 38,867 5,408 44,275 3.89% 0.99% 2.87%5 or more vehicles available 10,900 1,595 12,495 1.09% 0.29% 0.81%Total 999,697 544,215 1,543,912 100.00% 100.00% 100.00%Source: US Bureau of the Census, 2006 American Community Survey.Table I-8a. Number of Vehicles by Tenure <strong>and</strong> Vehicles per Occupied Unit, 2000South Florida Number of Vehicles by Tenure % of Vehicles in Occupied UnitsVehicles Available Owner Renter Total Owner Renter TotalAggregate Number of Vehicles 1,587,514 624,559 2,212,073 71.77% 28.23% 100.00%Vehicles per Occupied Unit 1.71 1.16 1.51Source: US Bureau of the Census, 2000 Census of Population <strong>and</strong> Housing (Summary File 3).Table I-8b. Number of Vehicles by Tenure <strong>and</strong> Vehicles per Occupied Unit, 2006South Florida Number of Vehicles by Tenure % of Vehicles in Occupied UnitsVehicles Available Owner Renter Total Owner Renter TotalAggregate Number of Vehicles 1,825,358 660,807 2,486,165 73.42% 26.58% 100.00%Vehicles per Occupied Unit 1.83 1.21 1.61Source: US Bureau of the Census, 2006 American Community Survey.6These data show the number of passenger cars, vans, <strong>and</strong> pickup or panel trucks of 1-ton capacity orless kept at home <strong>and</strong> available for the use of household members. Vehicles rented or leased for 1month or more, company vehicles, <strong>and</strong> police <strong>and</strong> government vehicles are included if kept at home <strong>and</strong>used for non-business purposes. Dismantled or immobile vehicles are excluded. Vehicles kept at homebut used only for business purposes also are excluded.Page I-14<strong>Regional</strong> <strong>Demographic</strong> <strong>and</strong> L<strong>and</strong> <strong>Use</strong> <strong>Analysis</strong>
Statewide <strong>Regional</strong> Evacuation Studies ProgramVolume 1-11 South FloridaTable I-9a. Resident Population by Gender <strong>and</strong> Age, 2000South Florida Absolute Number % of Total PopulationAge Categories Male Female Total Male Female TotalAge under 5 years 128,127 122,187 250,314 6.70% 5.98% 6.33%Age 5 to 17 years 359,019 343,000 702,019 18.78% 16.78% 17.75%Age 18 to 24 years 161,883 162,301 324,184 8.47% 7.94% 8.19%Age 25 to 34 years 283,231 290,293 573,524 14.82% 14.20% 14.50%Age 35 to 44 years 333,071 337,681 670,752 17.42% 16.52% 16.96%Age 45 to 54 years 246,260 263,860 510,120 12.88% 12.91% 12.89%Age 55 to 64 years 166,327 186,426 352,753 8.70% 9.12% 8.92%Age 65 to 74 years 127,188 159,357 286,545 6.65% 7.79% 7.24%Age 75 to 84 years 79,888 124,486 204,374 4.18% 6.09% 5.17%Age 85 years <strong>and</strong> over 26,502 54,882 81,384 1.39% 2.68% 2.06%Total 1,911,496 2,044,473 3,955,969 100.00% 100.00% 100.00%% Age under 18 years 25.49% 22.75% 24.07%% Age 65 years <strong>and</strong> over 12.22% 16.57% 14.47%Source: US Bureau of the Census, 2000 Census of Population <strong>and</strong> Housing (Summary File 3).Table I-9b. Resident Population by Gender <strong>and</strong> Age, 2006South Florida Absolute Number % of Total PopulationAge Categories Male Female Total Male Female TotalAge under 5 years 146,569 138,885 285,454 7.07% 6.34% 6.69%Age 5 to 17 years 372,648 356,662 729,310 17.98% 16.27% 17.10%Age 18 to 24 years 192,122 189,584 381,706 9.27% 8.65% 8.95%Age 25 to 34 years 256,336 254,116 510,452 12.37% 11.59% 11.97%Age 35 to 44 years 336,279 341,047 677,326 16.22% 15.56% 15.88%Age 45 to 54 years 301,554 318,901 620,455 14.55% 14.55% 14.55%Age 55 to 64 years 216,718 238,862 455,580 10.46% 10.90% 10.68%Age 65 to 74 years 132,963 162,464 295,427 6.42% 7.41% 6.93%Age 75 to 84 years 89,682 128,008 217,690 4.33% 5.84% 5.10%Age 85 years <strong>and</strong> over 27,811 63,370 91,181 1.34% 2.89% 2.14%Total 2,072,682 2,191,899 4,264,581 100.00% 100.00% 100.00%% Age under 18 years 25.05% 22.61% 23.80%% Age 65 years <strong>and</strong> over 12.08% 16.14% 14.17%Source: US Bureau of the Census, 2006 American Community Survey.<strong>Regional</strong> <strong>Demographic</strong> <strong>and</strong> L<strong>and</strong> <strong>Use</strong> <strong>Analysis</strong> Page I-15
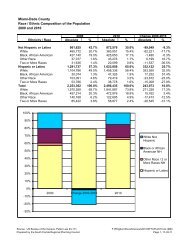
Volume 1-11 South FloridaStatewide <strong>Regional</strong> Evacuation Studies ProgramTable I-10a. Resident Population by Race <strong>and</strong> Ethnicity 7 , 2000South Florida Ethnicity – Hispanic or Latino % of Total PopulationRace Categories Non-Hisp Hispanic Total Non-Hisp Hispanic TotalWhite alone 1,468,113 1,320,747 2,788,860 61.68% 83.82% 70.50%Black or African American alone 749,753 36,089 785,842 31.50% 2.29% 19.86%Other race alone <strong>and</strong> 2+ races 162,399 218,868 381,267 6.82% 13.89% 9.64%Total 2,380,265 1,575,704 3,955,969 100.00% 100.00% 100.00%Source: US Bureau of the Census, 2000 Census of Population <strong>and</strong> Housing (Summary File 3).Table I-10b. Resident Population by Race <strong>and</strong> Ethnicity, 2006South Florida Ethnicity – Hispanic or Latino % of Total PopulationRace Categories Non-Hisp Hispanic Total Non-Hisp Hispanic TotalWhite alone 1,348,550 1,601,571 2,950,121 56.88% 84.58% 69.18%Black or African American alone 871,289 46,618 917,907 36.75% 2.46% 21.52%Other race alone <strong>and</strong> 2+ races 151,159 245,394 396,553 6.38% 12.96% 9.30%Total 2,370,998 1,893,583 4,264,581 100.00% 100.00% 100.00%Source: US Bureau of the Census, 2006 American Community Survey.7 Race <strong>and</strong> ethnicity are separate categories in both the 2000 Census <strong>and</strong> the 2006 American CommunitySurvey (ACS). For each person the surveys included two separate questions. The first asks whethereach person in the household considers himself/herself to be of Hispanic or Latino origin (ethnicity). Thesecond asks each person in the household to identify one or more racial categories that should be usedto classify his/her racial makeup. Both questions request the respondent to classify himself/herself,rather than having a Census Bureau employee assign a classification. The tables presented here arecross-tabulations of the two characteristics. Race is tabulated into three categories: (1) White personswho identified only one race (White alone); (2) Black or African American persons who identified only onerace (Black or African American alone); <strong>and</strong> (3) persons of other races who identified only one race(Other race alone) <strong>and</strong> those who identified two or more races, combined into a single category. Foreach race category, the totals were calculated for those who indicated that they were of Hispanic orLatino origin <strong>and</strong> those who indicated that they were not.Page I-16<strong>Regional</strong> <strong>Demographic</strong> <strong>and</strong> L<strong>and</strong> <strong>Use</strong> <strong>Analysis</strong>
Statewide <strong>Regional</strong> Evacuation Studies ProgramVolume 1-11 South FloridaTable I-11a. Resident Population by Age, Household 8 Type <strong>and</strong> Relationship, 2000South Florida Number of Persons, by Age % of Total PopulationHousehold Type, Relationship Under 65 65+ Total Under 65 65+ TotalIn households 3,337,517 551,221 3,888,738 98.64% 96.32% 98.30%In family households 2,913,603 377,227 3,290,830 86.11% 65.91% 83.19%In nonfamily households 423,914 173,994 597,908 12.53% 30.40% 15.11%Male householder 180,138 46,243 226,381 5.32% 8.08% 5.72%Living alone 127,882 39,828 167,710 3.78% 6.96% 4.24%Not living alone 52,256 6,415 58,671 1.54% 1.12% 1.48%Female householder 135,041 118,746 253,787 3.99% 20.75% 6.42%Living alone 103,368 113,688 217,056 3.05% 19.87% 5.49%Not living alone 31,673 5,058 36,731 0.94% 0.88% 0.93%Nonrelatives 108,735 9,005 117,740 3.21% 1.57% 2.98%In group quarters 46,149 21,082 67,231 1.36% 3.68% 1.70%Institutionalized population 28,472 14,824 43,296 0.84% 2.59% 1.09%Noninstitutionalized population 17,677 6,258 23,935 0.52% 1.09% 0.61%Total 3,383,666 572,303 3,955,969 100.00% 100.00% 100.00%Population Living Alone 231,250 153,516 384,766 6.83% 26.82% 9.73%Source: US Bureau of the Census, 2000 Census of Population <strong>and</strong> Housing (Summary File 3).Table I-11b. Resident Population by Age, Household Type <strong>and</strong> Relationship, 2006South Florida Number of Persons, by Age % of Total PopulationHousehold Type, Relationship Under 65 65+ Total Under 65 65+ TotalIn households 3,599,581 583,329 4,182,910 98.34% 96.53% 98.08%In family households 3,107,115 407,928 3,515,043 84.89% 67.50% 82.42%In nonfamily households 492,466 175,401 667,867 13.45% 29.03% 15.66%Male householder 208,409 51,957 260,366 5.69% 8.60% 6.11%Living alone 153,369 45,567 198,936 4.19% 7.54% 4.66%Not living alone 55,040 6,390 61,430 1.50% 1.06% 1.44%Female householder 155,057 111,564 266,621 4.24% 18.46% 6.25%Living alone 124,996 106,946 231,942 3.41% 17.70% 5.44%Not living alone 30,061 4,618 34,679 0.82% 0.76% 0.81%Nonrelatives 129,000 11,880 140,880 3.52% 1.97% 3.30%In group quarters 60,702 20,969 81,671 1.66% 3.47% 1.92%Institutionalized population 0.00% 0.00% 0.00%Noninstitutionalized population 0.00% 0.00% 0.00%Total 3,660,283 604,298 4,264,581 100.00% 100.00% 100.00%Population Living Alone 278,365 152,513 430,878 7.61% 25.24% 10.10%Source: US Bureau of the Census, 2006 American Community Survey.8 A household includes all of the people who occupy a housing unit. (People not living in households areclassified as living in group quarters.) A family includes a householder <strong>and</strong> one or more other peopleliving in the same household who are related to the householder by birth, marriage or adoption. Allpeople in a household who are related to the householder are regarded as members of his or her family.A family household may contain people not related to the householder, but those people are not includedas part of the householder’s family in census tabulations. Not all households contain families since ahousehold may be comprised of a group of unrelated people or of one person living alone (nonfamilyhouseholds).<strong>Regional</strong> <strong>Demographic</strong> <strong>and</strong> L<strong>and</strong> <strong>Use</strong> <strong>Analysis</strong> Page I-17
Volume 1-11 South FloridaStatewide <strong>Regional</strong> Evacuation Studies ProgramTable I-12a. Resident Population by Place of Birth <strong>and</strong> Citizenship Status, 2000South FloridaAbsolutePlace of Birth Number %Native - Born in state of residence 1,140,498 28.83%Native - Born in other state in the US 1,134,193 28.67%Native - Born outside the United States 111,394 2.82%Foreign-born - Naturalized citizen 723,725 18.29%Foreign-born - Not a citizen 846,159 21.39%Total 3,955,969 100.00%Source: US Bureau of the Census, 2000 Census of Population <strong>and</strong> Housing (Summary File 3).Table I-12b. Resident Population by Place of Birth <strong>and</strong> Citizenship Status, 2006South FloridaAbsolutePlace of Birth Number %Native - Born in state of residence 1,331,954 31.23%Native - Born in other state in the US 1,047,428 24.56%Native - Born outside the United States 130,775 3.07%Foreign-born - Naturalized citizen 832,080 19.51%Foreign-born - Not a citizen 922,344 21.63%Total 4,264,581 100.00%Source: US Bureau of the Census, 2006 American Community Survey.Page I-18<strong>Regional</strong> <strong>Demographic</strong> <strong>and</strong> L<strong>and</strong> <strong>Use</strong> <strong>Analysis</strong>
Statewide <strong>Regional</strong> Evacuation Studies ProgramVolume 1-11 South FloridaTable I-13a. Households by Language <strong>and</strong> Linguistic Isolation 9 , 2000South Florida Households by Linguistic Isolation Linguistic Isolation (%)Language Spoken in theNotNotHouseholdIsolated Isolated Total Isolated Isolated TotalEnglish 0 726,034 726,034 0.00% 100.00% 100.00%Spanish 191,811 379,800 571,611 33.56% 66.44% 100.00%Other Indo-European languages 31,031 109,783 140,814 22.04% 77.96% 100.00%Asian & Pacific Isl<strong>and</strong> languages 4,229 11,130 15,359 27.53% 72.47% 100.00%Other languages 2,103 11,350 13,453 15.63% 84.37% 100.00%Total 229,174 1,238,097 1,467,271 15.62% 84.38% 100.00%Source: US Bureau of the Census, 2000 Census of Population <strong>and</strong> Housing (Summary File 3).Table I-13b. Households by Language <strong>and</strong> Linguistic Isolation, 2006South Florida Households by Linguistic Isolation Linguistic Isolation (%)Language Spoken in theNotNotHouseholdIsolated Isolated Total Isolated Isolated TotalEnglish 0 687,718 687,718 0.00% 100.00% 100.00%Spanish 234,627 443,977 678,604 34.57% 65.43% 100.00%Other Indo-European languages 37,406 108,985 146,391 25.55% 74.45% 100.00%Asian & Pacific Isl<strong>and</strong> languages 3,968 14,238 18,206 21.80% 78.20% 100.00%Other languages 1,829 11,164 12,993 14.08% 85.92% 100.00%Total 277,830 1,266,082 1,543,912 18.00% 82.00% 100.00%Source: US Bureau of the Census, 2006 American Community Survey.9 A household in which no person 14 years old <strong>and</strong> over speaks only English <strong>and</strong> no person 14 years old<strong>and</strong> over who speaks a language other than English speaks English ‘‘very well’’ is classified as‘‘linguistically isolated.’’ In other words, a household in which all members 14 years old <strong>and</strong> over speak anon-English language <strong>and</strong> also speak English less than ‘‘very well’’ (have difficulty with English) is‘‘linguistically isolated.’’ All the members of a linguistically isolated household are tabulated aslinguistically isolated, including members under 14 years old who may speak only English.<strong>Regional</strong> <strong>Demographic</strong> <strong>and</strong> L<strong>and</strong> <strong>Use</strong> <strong>Analysis</strong> Page I-19
Volume 1-11 South FloridaStatewide <strong>Regional</strong> Evacuation Studies ProgramTable I-14a. Civilian Non-Institutionalized Population 5 Years <strong>and</strong> Over by Disability Status 10 ,2000South Florida Disability Status Disability Status (%)Age Categories With Without Total With Without Total5 to 15 years 28,817 568,769 597,586 4.82% 95.18% 100.00%16 to 20 years 37,537 204,929 242,466 15.48% 84.52% 100.00%21 to 64 years 494,687 1,766,093 2,260,780 21.88% 78.12% 100.00%65 to 74 years 93,740 190,275 284,015 33.01% 66.99% 100.00%75 <strong>and</strong> over 147,201 126,263 273,464 53.83% 46.17% 100.00%Total 801,982 2,856,329 3,658,311 21.92% 78.08% 100.00%Source: US Bureau of the Census, 2000 Census of Population <strong>and</strong> Housing (Summary File 3).Table I-14b. Civilian Non-Institutionalized Population 5 Years <strong>and</strong> Over by Disability Status 11 ,2006South Florida Disability Status Disability Status (%)Age Categories With Without Total With Without Total5 to 15 years 28,688 588,039 616,727 4.65% 95.35% 100.00%16 to 20 years 14,762 257,383 272,145 5.42% 94.58% 100.00%21 to 64 years 270,976 2,180,682 2,451,658 11.05% 88.95% 100.00%65 to 74 years 86,921 205,817 292,738 29.69% 70.31% 100.00%75 <strong>and</strong> over 160,308 137,935 298,243 53.75% 46.25% 100.00%Total 561,655 3,369,856 3,931,511 14.29% 85.71% 100.00%Source: US Bureau of the Census, 2006 American Community Survey.10The data on disability status were derived from answers to two long-form questionnaire items. Thefirst was a two-part question that asked about the existence of the following long-lasting conditions: (a)blindness, deafness, or a severe vision or hearing impairment (sensory disability) <strong>and</strong> (b) a condition thatsubstantially limits one or more basic physical activities, such as walking, climbing stairs, reaching, lifting,or carrying (physical disability). This question was asked of a sample of the population 5 years old <strong>and</strong>over. The second was a four-part question that asked if the individual had a physical, mental, oremotional condition lasting 6 months or more that made it difficult to perform certain activities. The fouractivity categories were: (a) learning, remembering, or concentrating (mental disability); (b) dressing,bathing, or getting around inside the home (self-care disability); (c) going outside the home alone toshop or visit a doctor’s office (going outside the home disability); <strong>and</strong> (d) working at a job or business(employment disability). Categories (a) <strong>and</strong> (b) were asked of a sample of the population 5 years old<strong>and</strong> over; (c) <strong>and</strong> (d) were asked of a sample of the population 16 years old <strong>and</strong> over. For data productsthat use a disability status indicator, individuals were classified as having a disability if any of thefollowing three conditions were true: (1) they were 5 years old <strong>and</strong> over <strong>and</strong> had a response of ‘‘yes’’ to asensory, physical, mental or self-care disability; (2) they were 16 years old <strong>and</strong> over <strong>and</strong> had a responseof ‘‘yes’’ to going outside the home disability; or (3) they were 16 to 64 years old <strong>and</strong> had a response of‘‘yes’’ to employment disability.11In response to evidence suggesting that mail respondents reported certain disabilities in error in the2000 Census <strong>and</strong> in the initial years of the ACS, the Census Bureau introduced changes to the ACSquestionnaire starting in 2003. Initial review of the data shows that the question redesign had theexpected effect on mail respondents, lowering the rates of disability overall by reducing over-reporting ingo-outside-home disability <strong>and</strong> employment disability after the change. This change affected primarilythe respondents in the age range from 16 to 64 years, <strong>and</strong> makes comparisons between results of the2000 Census <strong>and</strong> the 2006 ACS inappropriate. The 2006 ACS is believed to have more reliable results.Page I-20<strong>Regional</strong> <strong>Demographic</strong> <strong>and</strong> L<strong>and</strong> <strong>Use</strong> <strong>Analysis</strong>
Statewide <strong>Regional</strong> Evacuation Studies ProgramVolume 1-11 South FloridaTable I-15a. Resident Population 16 Years <strong>and</strong> Over by Gender <strong>and</strong> Employment Status, 2000South Florida Absolute Number % of Total Population 16 <strong>and</strong> OverEmployment Status Male Female Total Male Female TotalIn labor force 985,249 872,711 1,857,960 66.68% 53.55% 59.79%In Armed Forces 3,599 588 4,187 0.24% 0.04% 0.13%Civilian 981,650 872,123 1,853,773 66.43% 53.51% 59.66%Employed 918,974 802,354 1,721,328 62.19% 49.23% 55.39%Unemployed 62,676 69,769 132,445 4.24% 4.28% 4.26%Not in labor force 492,425 757,049 1,249,474 33.32% 46.45% 40.21%Total 1,477,674 1,629,760 3,107,434 100.00% 100.00% 100.00%Unemployment Rate (%) 6.36% 7.99% 7.13%Source: US Bureau of the Census, 2000 Census of Population <strong>and</strong> Housing (Summary File 3).Table I-15b. Resident Population 16 Years <strong>and</strong> Over by Gender <strong>and</strong> Employment Status, 2006South Florida Absolute Number % of Total Population 16 <strong>and</strong> OverEmployment Status Male Female Total Male Female TotalIn labor force 1,135,482 1,007,595 2,143,077 70.47% 57.54% 63.74%In Armed Forces 2,720 287 3,007 0.17% 0.02% 0.09%Civilian 1,132,762 1,007,308 2,140,070 70.30% 57.53% 63.65%Employed 1,078,651 944,229 2,022,880 66.95% 53.93% 60.17%Unemployed 54,111 63,079 117,190 3.36% 3.60% 3.49%Not in labor force 475,743 743,380 1,219,123 29.53% 42.46% 36.26%Total 1,611,225 1,750,975 3,362,200 100.00% 100.00% 100.00%Unemployment Rate (%) 4.77% 6.26% 5.47%Source: US Bureau of the Census, 2006 American Community Survey.<strong>Regional</strong> <strong>Demographic</strong> <strong>and</strong> L<strong>and</strong> <strong>Use</strong> <strong>Analysis</strong> Page I-21
Volume 1-11 South FloridaStatewide <strong>Regional</strong> Evacuation Studies ProgramTable I-16a. Resident Population by Poverty Status <strong>and</strong> by Age, 2000South Florida Income in 1999 - Poverty Status Poverty Status (%)Age Categories Below Above Total Below Above TotalUnder 5 years 49,326 196,770 246,096 20.04% 79.96% 100.00%5 years 10,405 40,650 51,055 20.38% 79.62% 100.00%6 to 11 years 66,050 260,374 326,424 20.23% 79.77% 100.00%12 to 17 years 62,088 251,298 313,386 19.81% 80.19% 100.00%18 to 64 years 320,120 2,077,135 2,397,255 13.35% 86.65% 100.00%65 to 74 years 40,003 244,012 284,015 14.08% 85.92% 100.00%75 years <strong>and</strong> over 41,569 231,895 273,464 15.20% 84.80% 100.00%Total 589,561 3,302,134 3,891,695 15.15% 84.85% 100.00%Under 18 187,869 749,092 936,961 20.05% 79.95% 100.00%65+ 81,572 475,907 557,479 14.63% 85.37% 100.00%Source: US Bureau of the Census, 2000 Census of Population <strong>and</strong> Housing (Summary File 3).Table I-16b. Resident Population by Poverty Status <strong>and</strong> by Age, 2006South Florida Income in 2006 - Poverty Status Poverty Status (%)Age Categories Below Above Total Below Above TotalUnder 5 years 59,602 221,293 280,895 21.22% 78.78% 100.00%5 years 8,062 41,525 49,587 16.26% 83.74% 100.00%6 to 11 years 49,736 268,769 318,505 15.62% 84.38% 100.00%12 to 17 years 60,355 287,797 348,152 17.34% 82.66% 100.00%18 to 64 years 309,572 2,295,561 2,605,133 11.88% 88.12% 100.00%65 to 74 years 46,605 246,133 292,738 15.92% 84.08% 100.00%75 years <strong>and</strong> over 58,106 240,137 298,243 19.48% 80.52% 100.00%Total 592,038 3,601,215 4,193,253 14.12% 85.88% 100.00%Under 18 177,755 819,384 997,139 17.83% 82.17% 100.00%65+ 104,711 486,270 590,981 17.72% 82.28% 100.00%Source: US Bureau of the Census, 2006 American Community Survey.Page I-22<strong>Regional</strong> <strong>Demographic</strong> <strong>and</strong> L<strong>and</strong> <strong>Use</strong> <strong>Analysis</strong>
Statewide <strong>Regional</strong> Evacuation Studies ProgramVolume 1-11 South FloridaTable I-17. Generalized Future L<strong>and</strong> <strong>Use</strong>s, 2006 – South FloridaCode L<strong>and</strong> <strong>Use</strong> Category Acres %AG Agriculture 107,051 2.2%COM Commercial / Office 54,381 1.1%CONS Conservation 1,904,886 39.7%IND Industrial 110,859 2.3%MU Mixed-<strong>Use</strong> 12,531 0.3%PUB Institutional, Government 23,966 0.5%REC Recreation / Open Space 89,999 1.9%RH Residential High Density 38,133 0.8%RL Residential Low Density 73,785 1.5%RM Residential Medium Density 239,334 5.0%WAT Water Bodies 2,137,279 44.6%Total 4,792,203 100.0%Source: Broward County, Miami-Dade County, Monroe County, South Florida Water Management District<strong>Regional</strong> <strong>Demographic</strong> <strong>and</strong> L<strong>and</strong> <strong>Use</strong> <strong>Analysis</strong> Page I-23
29 20 000m. N4 20 000m. E 4 304 404 504 604 704 804 905 005 105 205 305 405 505 605 705 805 90LeeSouth Florida 2000 Census Block Group DataMap H1 - Number of Vacant Seasonal Housing UnitsBoggy SloughTony Str<strong>and</strong>HendryLard Can SloughPalm BeachWyman, LakeBoca Raton, Lake29 10 29 1029 20Little Lard Can SloughCo w Bell Stran dGoddens Str<strong>and</strong>Dark Str<strong>and</strong>MK NK29 00 29 00MJ NJCollierBroward28 90 28 9028 80 28 80North LakeSouth Lake28 70 28 70Maule Lake28 60 28 60Silver Blue Lake28 50 28 50Blue LagoonCatalina, Lake28 40 28 40Everglades, TheMiami-Dade28 30 28 3028 20 28 20LegendMonroe28 10 28 10Housing Units200 - 2,390MJ NJ28 00 28 00Taylor SloughMH NH100 - 19927 90 27 9050 - 991 - 49Ingraham, LakeCattail LakesRaulerson PrairieMiddle Fox LakeEast Fox LakeBear LakeMud Lake27 80 27 80027 70 27 70BackgroundWetl<strong>and</strong>s, etc.27 60 27 600 2.5 5 10 15 20 25MilesThis map is prepared under the direction of theI27 50 Florida Division of Emergency Management for27 50the <strong>Regional</strong> Evacuation Study Update. This mapis for planning purposes only <strong>and</strong> not to be usedfor measurement or legal purposes. Pleaseconsult with your county for the latest information.Tarpon CreekCutoff, TheWest LakeSeven Palm LakeHe nry Lake27 40 27 4027 30 27 3027 20 27 2027 10 000m. N4 20 000m. E4 304 404 504 604 704 804 905 005 105 205 305 405 505 605 705 805 9027 10Sources: U.S. Census Bureau, USGS, FDEM, Miami-Dade, Broward <strong>and</strong> Monroe Counties, SFRPC.Map Printed: 10/Jan/08<strong>Regional</strong> <strong>Demographic</strong> <strong>and</strong> L<strong>and</strong> <strong>Use</strong> <strong>Analysis</strong> Page I-24
29 20 000m. N4 20 000m. E 4 304 404 504 604 704 804 905 005 105 205 305 405 505 605 705 805 90LeeSouth Florida 2000 Census Block Group DataMap H4 - Average Household SizeBoggy SloughTony Str<strong>and</strong>HendryLard Can SloughPalm BeachWyman, LakeBoca Raton, Lake29 10 29 1029 20Little Lard Can SloughCo w Bell Stran dGoddens Str<strong>and</strong>Dark Str<strong>and</strong>MK NK29 00 29 00MJ NJCollierBroward28 90 28 9028 80 28 80North LakeSouth Lake28 70 28 70Maule Lake28 60 28 60Silver Blue Lake28 50 28 50Blue LagoonCatalina, Lake28 40 28 40Everglades, TheMiami-Dade28 30 28 3028 20 28 20LegendMonroe28 10 28 10PersonsMJ NJ28 00 28 00Taylor SloughMH NH3.51 - 5.773.01 - 3.5027 90 27 902.51 - 3.002.26 - 2.50Ingraham, LakeCattail LakesRaulerson PrairieMiddle Fox LakeEast Fox LakeBear LakeMud Lake27 80 27 800.00 - 2.2527 70 27 70BackgroundWetl<strong>and</strong>s, etc.27 60 27 600 2.5 5 10 15 20 25MilesThis map is prepared under the direction of theI27 50 Florida Division of Emergency Management for27 50the <strong>Regional</strong> Evacuation Study Update. This mapis for planning purposes only <strong>and</strong> not to be usedfor measurement or legal purposes. Pleaseconsult with your county for the latest information.Tarpon CreekCutoff, TheWest LakeSeven Palm LakeHe nry Lake27 40 27 4027 30 27 3027 20 27 2027 10 000m. N4 20 000m. E4 304 404 504 604 704 804 905 005 105 205 305 405 505 605 705 805 9027 10Sources: U.S. Census Bureau, USGS, FDEM, Miami-Dade, Broward <strong>and</strong> Monroe Counties, SFRPC.Map Printed: 10/Jan/08<strong>Regional</strong> <strong>Demographic</strong> <strong>and</strong> L<strong>and</strong> <strong>Use</strong> <strong>Analysis</strong> Page I-25
29 20 000m. N4 20 000m. E 4 304 404 504 604 704 804 905 005 105 205 305 405 505 605 705 805 90LeeSouth Florida 2000 Census Block Group DataMap H5 - Number of Mobile HomesBoggy SloughTony Str<strong>and</strong>HendryLard Can SloughPalm BeachWyman, LakeBoca Raton, Lake29 10 29 1029 20Little Lard Can SloughCo w Bell Stran dGoddens Str<strong>and</strong>Dark Str<strong>and</strong>MK NK29 00 29 00MJ NJCollierBroward28 90 28 9028 80 28 80North LakeSouth Lake28 70 28 70Maule Lake28 60 28 60Silver Blue Lake28 50 28 50Blue LagoonCatalina, Lake28 40 28 40Everglades, TheMiami-Dade28 30 28 3028 20 28 20LegendMonroe28 10 28 10UnitsMJ NJ28 00 28 00Taylor SloughMH NH250 - 2,274100 - 24927 90 27 9020 - 991 - 19Ingraham, LakeCattail LakesRaulerson PrairieMiddle Fox LakeEast Fox LakeBear LakeMud Lake27 80 27 80027 70 27 70BackgroundWetl<strong>and</strong>s, etc.27 60 27 600 2.5 5 10 15 20 25MilesThis map is prepared under the direction of theI27 50 Florida Division of Emergency Management for27 50the <strong>Regional</strong> Evacuation Study Update. This mapis for planning purposes only <strong>and</strong> not to be usedfor measurement or legal purposes. Pleaseconsult with your county for the latest information.Tarpon CreekCutoff, TheWest LakeSeven Palm LakeHe nry Lake27 40 27 4027 30 27 3027 20 27 2027 10 000m. N4 20 000m. E4 304 404 504 604 704 804 905 005 105 205 305 405 505 605 705 805 9027 10Sources: U.S. Census Bureau, USGS, FDEM, Miami-Dade, Broward <strong>and</strong> Monroe Counties, SFRPC.Map Printed: 10/Jan/08<strong>Regional</strong> <strong>Demographic</strong> <strong>and</strong> L<strong>and</strong> <strong>Use</strong> <strong>Analysis</strong> Page I-26
29 20 000m. N4 20 000m. E 4 304 404 504 604 704 804 905 005 105 205 305 405 505 605 705 805 90LeeSouth Florida 2000 Census Block Group DataMap H8 - Number of Households with No VehicleBoggy SloughTony Str<strong>and</strong>HendryLard Can SloughPalm BeachWyman, LakeBoca Raton, Lake29 10 29 1029 20Little Lard Can SloughCo w Bell Stran dGoddens Str<strong>and</strong>Dark Str<strong>and</strong>MK NK29 00 29 00MJ NJCollierBroward28 90 28 9028 80 28 80North LakeSouth Lake28 70 28 70Maule Lake28 60 28 60Silver Blue Lake28 50 28 50Blue LagoonCatalina, Lake28 40 28 40Everglades, TheMiami-Dade28 30 28 3028 20 28 20LegendMonroe28 10 28 10HouseholdsMJ NJ28 00 28 00Taylor SloughMH NH201 - 993101 - 20027 90 27 9051 - 1001 - 50Ingraham, LakeCattail LakesRaulerson PrairieMiddle Fox LakeEast Fox LakeBear LakeMud Lake27 80 27 80027 70 27 70BackgroundWetl<strong>and</strong>s, etc.27 60 27 600 2.5 5 10 15 20 25MilesThis map is prepared under the direction of theI27 50 Florida Division of Emergency Management for27 50the <strong>Regional</strong> Evacuation Study Update. This mapis for planning purposes only <strong>and</strong> not to be usedfor measurement or legal purposes. Pleaseconsult with your county for the latest information.Tarpon CreekCutoff, TheWest LakeSeven Palm LakeHe nry Lake27 40 27 4027 30 27 3027 20 27 2027 10 000m. N4 20 000m. E4 304 404 504 604 704 804 905 005 105 205 305 405 505 605 705 805 9027 10Sources: U.S. Census Bureau, USGS, FDEM, Miami-Dade, Broward <strong>and</strong> Monroe Counties, SFRPC.Map Printed: 10/Jan/08<strong>Regional</strong> <strong>Demographic</strong> <strong>and</strong> L<strong>and</strong> <strong>Use</strong> <strong>Analysis</strong> Page I-27
29 20 000m. N4 20 000m. E 4 304 404 504 604 704 804 905 005 105 205 305 405 505 605 705 805 90LeeSouth Florida 2000 Census Block Group DataMap P1 - Residents per square mileBoggy SloughTony Str<strong>and</strong>HendryLard Can SloughPalm BeachWyman, LakeBoca Raton, Lake29 10 29 1029 20Little Lard Can SloughCo w Bell Stran dGoddens Str<strong>and</strong>Dark Str<strong>and</strong>MK NK29 00 29 00MJ NJCollierBroward28 90 28 9028 80 28 80North LakeSouth Lake28 70 28 70Maule Lake28 60 28 60Silver Blue Lake28 50 28 50Blue LagoonCatalina, Lake28 40 28 40Everglades, TheMiami-Dade28 30 28 3028 20 28 20LegendMonroe28 10 28 10PersonsMJ NJ28 00 28 00Taylor SloughMH NH11,001 - 52,7548,001 - 11,00027 90 27 906,001 - 8,0003,501 - 6,000Ingraham, LakeCattail LakesRaulerson PrairieMiddle Fox LakeEast Fox LakeBear LakeMud Lake27 80 27 800 - 3,50027 70 27 70BackgroundWetl<strong>and</strong>s, etc.27 60 27 600 2.5 5 10 15 20 25MilesThis map is prepared under the direction of theI27 50 Florida Division of Emergency Management for27 50the <strong>Regional</strong> Evacuation Study Update. This mapis for planning purposes only <strong>and</strong> not to be usedfor measurement or legal purposes. Pleaseconsult with your county for the latest information.Tarpon CreekCutoff, TheWest LakeSeven Palm LakeHe nry Lake27 40 27 4027 30 27 3027 20 27 2027 10 000m. N4 20 000m. E4 304 404 504 604 704 804 905 005 105 205 305 405 505 605 705 805 9027 10Sources: U.S. Census Bureau, USGS, FDEM, Miami-Dade, Broward <strong>and</strong> Monroe Counties, SFRPC.Map Printed: 10/Jan/08<strong>Regional</strong> <strong>Demographic</strong> <strong>and</strong> L<strong>and</strong> <strong>Use</strong> <strong>Analysis</strong> Page I-28
29 20 000m. N4 20 000m. E 4 304 404 504 604 704 804 905 005 105 205 305 405 505 605 705 805 90LeeSouth Florida 2000 Census Block Group DataMap P5 - Percent of Population Living in Group QuartersBoggy SloughTony Str<strong>and</strong>HendryLard Can SloughPalm BeachWyman, LakeBoca Raton, Lake29 10 29 1029 20Little Lard Can SloughCo w Bell Stran dGoddens Str<strong>and</strong>Dark Str<strong>and</strong>MK NK29 00 29 00MJ NJCollierBroward28 90 28 9028 80 28 80North LakeSouth Lake28 70 28 70Maule Lake28 60 28 60Silver Blue Lake28 50 28 50Blue LagoonCatalina, Lake28 40 28 40Everglades, TheMiami-Dade28 30 28 3028 20 28 20LegendMonroe28 10 28 10Percent PopulationMJ NJ28 00 28 00Taylor SloughMH NH10.0% - 100%2.5% - 9.9%27 90 27 901.0% - 2.4%0.1% - 0.9%Ingraham, LakeCattail LakesRaulerson PrairieMiddle Fox LakeEast Fox LakeBear LakeMud Lake27 80 27 800.0%27 70 27 70BackgroundWetl<strong>and</strong>s, etc.27 60 27 600 2.5 5 10 15 20 25MilesThis map is prepared under the direction of theI27 50 Florida Division of Emergency Management for27 50the <strong>Regional</strong> Evacuation Study Update. This mapis for planning purposes only <strong>and</strong> not to be usedfor measurement or legal purposes. Pleaseconsult with your county for the latest information.Tarpon CreekCutoff, TheWest LakeSeven Palm LakeHe nry Lake27 40 27 4027 30 27 3027 20 27 2027 10 000m. N4 20 000m. E4 304 404 504 604 704 804 905 005 105 205 305 405 505 605 705 805 9027 10Sources: U.S. Census Bureau, USGS, FDEM, Miami-Dade, Broward <strong>and</strong> Monroe Counties, SFRPC.Map Printed: 10/Jan/08<strong>Regional</strong> <strong>Demographic</strong> <strong>and</strong> L<strong>and</strong> <strong>Use</strong> <strong>Analysis</strong> Page I-29
29 20 000m. N4 20 000m. E 4 304 404 504 604 704 804 905 005 105 205 305 405 505 605 705 805 90LeeSouth Florida 2000 Census Block Group DataMap P8 - Number of Linguistically Isolated Households - Other LanguagesBoggy SloughTony Str<strong>and</strong>HendryLard Can SloughPalm BeachWyman, LakeBoca Raton, Lake29 10 29 1029 20Little Lard Can SloughCo w Bell Stran dGoddens Str<strong>and</strong>Dark Str<strong>and</strong>MK NK29 00 29 00MJ NJCollierBroward28 90 28 9028 80 28 80North LakeSouth Lake28 70 28 70Maule Lake28 60 28 60Silver Blue Lake28 50 28 50Blue LagoonCatalina, Lake28 40 28 40Everglades, TheMiami-Dade28 30 28 3028 20 28 20LegendMonroe28 10 28 10HouseholdsMJ NJ28 00 28 00Taylor SloughMH NH100 - 45150 - 9927 90 27 9010 - 491 - 9Ingraham, LakeCattail LakesRaulerson PrairieMiddle Fox LakeEast Fox LakeBear LakeMud Lake27 80 27 80027 70 27 70BackgroundWetl<strong>and</strong>s, etc.27 60 27 600 2.5 5 10 15 20 25MilesThis map is prepared under the direction of theI27 50 Florida Division of Emergency Management for27 50the <strong>Regional</strong> Evacuation Study Update. This mapis for planning purposes only <strong>and</strong> not to be usedfor measurement or legal purposes. Pleaseconsult with your county for the latest information.Tarpon CreekCutoff, TheWest LakeSeven Palm LakeHe nry Lake27 40 27 4027 30 27 3027 20 27 2027 10 000m. N4 20 000m. E4 304 404 504 604 704 804 905 005 105 205 305 405 505 605 705 805 9027 10Sources: U.S. Census Bureau, USGS, FDEM, Miami-Dade, Broward <strong>and</strong> Monroe Counties, SFRPC.Map Printed: 10/Jan/08<strong>Regional</strong> <strong>Demographic</strong> <strong>and</strong> L<strong>and</strong> <strong>Use</strong> <strong>Analysis</strong> Page I-31
95Statewide Generalized Future L<strong>and</strong> <strong>Use</strong>South Florida29 20 000m. N4 20 000m. E 4 304 404 504 604 704 804 905 005 105 205 305 405 505 605 705 805 90LeePalm BeachHendry29 10 29 1029 20MK NK29 00 29 00MJ NJBroward28 90 28 90Collier28 80 28 8012744128 70 28 70821826759241826441279528 60 28 60826271121958213958368361419528 50 28414150187487882682128 40 2887440821MonroeMiami-Dade28 30 28 30LegendState Generalized FLU28 20 28 20AgricultureCommercial/Office28 10 28 10ConservationIndustrialMJ NJ28 00 28 00MH NHMixed <strong>Use</strong>18211Public/Institutional/Utility905 ARecreation/Open Space27 90 27 90Residential High Density1Residential Medium Density27 80 27 801Residential Low DensityUnknown27 70 27 70WaterBackground27 60 27 601110 1.5 3 6 9 12 15MilesThis map is prepared under the direction of the27 50Florida Division of Emergency Management forthe <strong>Regional</strong> Evacuation Study Update. This map27 50is for planning purposes only <strong>and</strong> not to be usedfor measurement or legal purposes. Pleaseconsult with your county for the latest information.27 40 27 40127 30 27 30111127120 27 2027 10 000m. N4 20 000m. E4 304 404 504 604 704 804 905 005 105 205 305 405 505 605 705 805 9027 10Sources: U.S. Census Bureau, USGS, FDEM, SFWMD, Miami-Dade, Broward <strong>and</strong> Monroe Counties, SFRPC.Map Printed: 01/15/08<strong>Regional</strong> <strong>Demographic</strong> <strong>and</strong> L<strong>and</strong> <strong>Use</strong> <strong>Analysis</strong> Page I-32