Picket Fence Free Fall - Vernier Software & Technology
Picket Fence Free Fall - Vernier Software & Technology
Picket Fence Free Fall - Vernier Software & Technology

You also want an ePaper? Increase the reach of your titles
YUMPU automatically turns print PDFs into web optimized ePapers that Google loves.
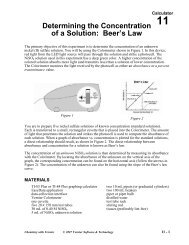
LabQuest 5PRELIMINARY QUESTIONS1. Inspect your <strong>Picket</strong> <strong>Fence</strong>. You will be dropping it through a Photogate to measure g. Thedistance, measured from one edge of a black band to the same edge of the next band, is5.0 cm. What additional information will you need to determine the average speed of the<strong>Picket</strong> <strong>Fence</strong> as it moves through the Photogate?2. If an object is moving with constant acceleration, what is the shape of its velocity vs. timegraph?3. Does the initial velocity of an object have anything to do with its acceleration? For example,compared to dropping an object, if you throw it downward would the acceleration bedifferent after you released it?PROCEDURE1. Fasten the Photogate rigidly to a ring stand so the arms extend horizontally, as shown inFigure 1. The entire length of the <strong>Picket</strong> <strong>Fence</strong> must be able to fall freely through thePhotogate. To avoid damaging the <strong>Picket</strong> <strong>Fence</strong>, make sure it has a soft landing surface.2. Connect the Photogate to DIG 1 of LabQuest and choose New from the File menu. If youhave an older sensor that does not auto-ID, manually set up the sensor.3. Now collect your free fall data. To do this, start data collection and wait for a moment.4. Hold the top of the <strong>Picket</strong> <strong>Fence</strong> and drop it through the Photogate, releasing it from yourgrasp completely before it enters the Photogate. Be careful when releasing the <strong>Picket</strong> <strong>Fence</strong>.It must not touch the sides of the Photogate as it falls and it needs to remain vertical.5. When the <strong>Picket</strong> <strong>Fence</strong> has completely passed through the Photogate, a graph of distance vs.time and velocity vs. time will appear on the screen. Sketch the graphs on paper for later use.6. Examine your velocity vs. time graph. The slope of a velocity vs. time graph is a measure ofacceleration. If the velocity graph is approximately a straight line of constant slope, theacceleration is constant. If the acceleration of your <strong>Picket</strong> <strong>Fence</strong> appears constant, fit astraight line to your data.a. Choose Curve Fit from the Analyze menu.b. Select Linear as the Fit Equation.c. Record the slope of the linear curve fit in the data table.d. Select OK.7. To establish the reliability of your slope measurement, repeat Steps 3–6 five more times. Donot use drops in which the <strong>Picket</strong> <strong>Fence</strong> hits or misses the Photogate. Record the slope valuesin the data table.5 - 2 Physics with <strong>Vernier</strong>