Planning forest routes for silvicultural activities using GIS ... - DiVA
Planning forest routes for silvicultural activities using GIS ... - DiVA
Planning forest routes for silvicultural activities using GIS ... - DiVA

You also want an ePaper? Increase the reach of your titles
YUMPU automatically turns print PDFs into web optimized ePapers that Google loves.
Sima Mohtashami TRITA LWR Degree Project 11:20© Sima Mohtashami 2011Degree ProjectEnvironmental Management and AssessmentDepartment of Land and Water Resources EngineeringRoyal Institute of Technology (KTH)SE-100 44 STOCKHOLM, SwedenReference should be written as: Mohtashami, S (2011) “<strong>Planning</strong> <strong><strong>for</strong>est</strong> <strong>routes</strong> <strong>for</strong> <strong>silvicultural</strong><strong>activities</strong> <strong>using</strong> <strong>GIS</strong> based techniques: A case study of Selesjö in Östergötland, Sweden” TRITA LWRDegree Project 11:20ii
<strong>Planning</strong> <strong><strong>for</strong>est</strong> <strong>routes</strong> <strong>for</strong> <strong>silvicultural</strong> <strong>activities</strong> <strong>using</strong> <strong>GIS</strong> based techniques: A case study of Selesjö inÖstergötland, SwedenSAMMANFATTNINGUnder de senaste decennierna har skogsmaskinernas utveckling lett tillatt maskinerna blir större och tyngre. Skogsmaskiner kan orsakabetydande skador på grundläggande element i skogarna, som till exempelmark och vatten. Tunga skördare och skotare orsakar komprimering ochspårbildning, vilket kan leda till bl.a. till ökad erosion och avrinning, somhotar återväxten och den biologiska mångfalden i mark- ochvattensystem. Alla dessa miljömässigt negativa effekter kan undvikas elleråtminstone minimeras om avverkningstrakten planeras noggrant.I detta examensarbete utvecklades en modell baserad på GeografiskaIn<strong>for</strong>mation System (<strong>GIS</strong>), som är en teknisk landvinning med storpotential för att hjälpa beslutsfattare att ut<strong>for</strong>ska vetenskapliga frågor,analysera olika alternativ och utvärdera möjliga val av åtgärder viadatorsystem. Modellen skapar möjligheten att planera avverkningsvägarpå ett bättre sätt, så att skador på mark och vatten minimeras.Modellen skapades inom ‟Model Builder‟ som är ett gränssnitt i ArcMap,version 10, med hjälp av befintliga verktyg i Spatial Analyst och 3DAnalyst. En digital terrängmodell över två studieområden i sydöstraSverige tillhandahölls av Foran Remote Sensing AB. En upplösning på0,5 meter användes för att extrahera höjddata, lutnings- och lutningsriktningsdata, vilka tillsammans med jordartsdata från Sverige GeologiskaUndersökning (SGU) användes för att skapa en kostnadsindexyta medvärden mellan 1 och 5. Det lägsta värdet för detta kostnadsindex visadede bästa körförhållandena inom ytan och det högsta värdet förkostnadsindexet motsvarade det sämsta läget i områdena. Den här ytananvändes därefter i verktygen ‟Path Distance‟ och ‟Cost Distance‟ för atthitta miljövänliga vägar från avlägget till några slutpunkter istudieområdena. Modellen kördes över två olika studieområden för attutvärdera möjliga vägsmönster inom avverkningsområdet.För att undvika för stora sidolutningar, speciellt då skotaren är fullastad,har det i detta examensarbete tagits hänsyn till lutningsriktningen påmarken. Denna metod, där hänsyn till sidolutning betraktas, är helt nymot tidigare studier där begränsningarna bara nämnts.Slutsatsen är att mer hållbar skogsskötsel och bättre skydd av mark ochvatten skulle kunna uppnås med tillämpning av denna typ av <strong>GIS</strong>baseradebeslutsstöd. Modellen har hög potential att hjälpa tjänstemänoch förare till rätt beslut inför avverkning. Om det finns mer än ettmöjligt avlägg, så kan modellen föreslå de som lämpar sig bäst medhänsyn både till skonsamhet och terrängtransportavstånd. Därför kan dethjälpa skogsföretag i både ekonomisk och ekologisk utvärdering avmöjliga körvägsmönster som skulle vara till stor hjälp för att göra merrealistiska och samtidigt miljövänliga beslut inför avverkningsplanering.iii
Sima Mohtashami TRITA LWR Degree Project 11:20iv
<strong>Planning</strong> <strong><strong>for</strong>est</strong> <strong>routes</strong> <strong>for</strong> <strong>silvicultural</strong> <strong>activities</strong> <strong>using</strong> <strong>GIS</strong> based techniques: A case study of Selesjö inÖstergötland, SwedenACKNOWLEDGMENTI would like to acknowledge my supervisor Ulla Mörtberg at KTH <strong>for</strong> her help andsupport under my study. This work was carried out in cooperation with Skog<strong>for</strong>sk,Swedish Forestry Research institute, and I would like to dedicate my special thanks tothe experts and supervisors there, Magnus Thor, Petrus Jönsson, Isabelle Bergkvist, andJohan Sonesson, who gave me lots of great insights about the <strong><strong>for</strong>est</strong>ry operations inSweden.Finally I would to like to appreciate my beloved husband Soheil Saadatmand <strong>for</strong> all thepositive energy and ambition he provided me during my thesis study.v
Sima Mohtashami TRITA LWR Degree Project 11:20vi
<strong>Planning</strong> <strong><strong>for</strong>est</strong> <strong>routes</strong> <strong>for</strong> <strong>silvicultural</strong> <strong>activities</strong> <strong>using</strong> <strong>GIS</strong> based techniques: A case study of Selesjö inÖstergötland, SwedenTABLE OF CONTENTSAbstract ........................................................................................................................................ 1Introduction ................................................................................................................................. 1Legislative concerns ............................................................................................................... 2Current extraction road planning situation in Swedish <strong><strong>for</strong>est</strong>s ........................................... 3Objectives and targets of the study ....................................................................................... 3Decision support methods ..................................................................................................... 3Multi criteria decision analysis ............................................................................................................ 3Decision support systems, and spatial decision support systems ......................................................... 4Geographic In<strong>for</strong>mation Systems ....................................................................................................... 4Relevant studies on off-road routing .................................................................................................. 5Study area ..................................................................................................................................... 6Research materials ....................................................................................................................... 6Input data ................................................................................................................................ 6Utilized software ..................................................................................................................... 7Methodology ................................................................................................................................ 7Scenario description ............................................................................................................... 8Study area 1 ....................................................................................................................................... 9Study area 2 ....................................................................................................................................... 9Data processing ...................................................................................................................... 9Model description ................................................................................................................... 9Cost-index surface preparation........................................................................................................... 9Weighted overlay ............................................................................................................................. 11Constraint consideration .................................................................................................................. 11Path Distance tool ........................................................................................................................... 12Cost Path tool .................................................................................................................................. 14Sensitivity analysis ................................................................................................................ 15Evaluation of the suggested <strong>routes</strong> in reality ..................................................................... 15Results ........................................................................................................................................ 16Study area 1, Scenario 1 ........................................................................................................ 16Study area 1, Scenario 2 ........................................................................................................ 16Comparing the two scenarios of Study area 1 ..................................................................... 20Study area 2, Scenario 1 ........................................................................................................ 21Study area 2, Scenario 2 ........................................................................................................ 21Comparing the two scenarios of Study area 2 .................................................................... 21Sensitivity analysis ................................................................................................................ 25Evaluation of the suggested <strong>routes</strong> in reality ..................................................................... 26Discussion .................................................................................................................................. 26Sensitivity analysis ................................................................................................................ 26Conclusions ................................................................................................................................ 28Further work .............................................................................................................................. 28References .................................................................................................................................. 29Other references ......................................................................................................................... 30Appendix I ..................................................................................................................................... Ivii
Sima Mohtashami TRITA LWR Degree Project 11:20viii
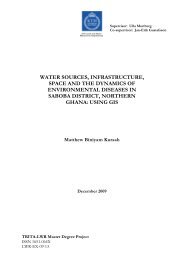
<strong>Planning</strong> <strong><strong>for</strong>est</strong> <strong>routes</strong> <strong>for</strong> <strong>silvicultural</strong> <strong>activities</strong> <strong>using</strong> <strong>GIS</strong> based techniques: A case study of Selesjö inÖstergötland, SwedenABSTRACTForests are natural resources that provide essential services <strong>for</strong> different groups ofusers from human beings to native habitats. They are actually home of diverse rangeof biological groups; contribute to alleviate climate change through sinking carbondioxidefrom the atmosphere and supplying oxygen back to it and finally they areregarded as wood resources by human beings.In recent decades, exploitation of <strong><strong>for</strong>est</strong> woods, specifically by application ofoperational machineries, has exerted severe pressure on basic elements of <strong><strong>for</strong>est</strong>s, suchas soil and water. Massive weights of harvesters and <strong>for</strong>warders could cause soilcompaction, rutting and runoff <strong>for</strong>mation which threatens regrowth and biodiversityin soil and water systems. All these environmentally negative impacts could be avoidedor at least minimized if <strong><strong>for</strong>est</strong> operational <strong>activities</strong> are accompanied by proper andintelligent pre-planning. Geographic In<strong>for</strong>mation System (<strong>GIS</strong>) is one of thetechnological achievements with great potentials that can assist decision makers inexploring scientific questions, analyzing various alternatives and evaluating possiblechoices of actions through computer systems.This study developed a <strong>GIS</strong>-based technique <strong>for</strong> planning main access <strong>routes</strong> <strong>for</strong>logging operations in harvesting sites in a manner to minimize environmental damagesto soil and water. A model was created within the model builder environment of theArcMap, version 10, <strong>using</strong> the existing tools in Spatial Analyst and 3D Analystextensions of the ArcMap. A cost-index surface consisting of major effective factorsi.e. elevation, slope and soil type was created to be fed into the Path Distance tool inorder to per<strong>for</strong>m distance analysis .The model was run over two separate study areasto evaluate possible route designs within the harvesting sites. Two distinct routelayouts, corresponding to predefined scenarios, were suggested by the model <strong>for</strong> eachof the study areas to connect the landing point(s) to some arbitrary destinations insidethe harvesting border. The novel achievement of this study could be regarded as theproper route alignment with respect to the slope direction of the ground in theArcMap environment, to avoid lateral inclination of loaded <strong>for</strong>warders on the steepslopes.Key words: Forest; Soil; Water; <strong>Planning</strong> harvesting <strong>routes</strong>; <strong>GIS</strong>; Lateralinclination.INTRODUCTIONIn Sweden <strong><strong>for</strong>est</strong> clear cutting is usually per<strong>for</strong>med <strong>using</strong> harvesters and<strong>for</strong>warders. Due to their massive weights, these machines cause severedamages to soil and water in <strong><strong>for</strong>est</strong> sites, specifically when <strong><strong>for</strong>est</strong>operations lack proper preplanning. A large harvester may exceed 20 Mgand a fully loaded <strong>for</strong>warder can approach 40 Mg, and thus increase therisk of soil compaction and rutting under undesirable soil conditions(Eliasson, 2005). Studies by Wu et al. (2007) showed that off-roadvehicle movements affect negatively oxygen, nutrient and water contentof the soil, disturbs natural infiltration rate and pH condition of the soilwhich eventually leads to reduction in growth, reproduction and diversityof biological systems in the <strong><strong>for</strong>est</strong> lands. Soil compaction contributes tohigher run-off <strong>for</strong>mation which not only degrades the soil but alsothreatens aquatic ecosystems by mobilizing soil nutrients and probableexisting contaminants, like mercury, and accumulating them in therecipients‟ water bodies. Scientific studies has shown that <strong>silvicultural</strong>practices are responsible <strong>for</strong> 10-25% of the mercury accumulation infish, in high latitude managed landscapes in Sweden (Bishop et al., 2009).The adverse environmental impacts are more severe where the off-roadtracks are highly trafficked and concentrated compared to disperse, low1
Sima Mohtashami TRITA LWR Degree Project 11:20ABFigure 1. Negative environmental impacts: A) disturbing natural infiltration of thewater B) soil disturbance during driving.trafficked conditions (Wu et al., 2007). Figure 1 illustrates some of theenvironmental disturbances that occur at harvesting sites.Legislative concernsAccording to the Swedish <strong><strong>for</strong>est</strong>ry act, harvesting and transportation in<strong><strong>for</strong>est</strong> must be planned so that damage to land and water is reduced oravoided. The natural and cultural environment must be protected duringroad planning. Leaving riparian buffer zones, reducing streamdisturbance with bridges and avoiding operation in moist areas are otherrecommendations to mitigate the <strong><strong>for</strong>est</strong> operation impacts.Swedish environmental quality objectives, adopted by Swedishparliament in April 1999, are aiming <strong>for</strong> Sweden‟s major environmental2
<strong>Planning</strong> <strong><strong>for</strong>est</strong> <strong>routes</strong> <strong>for</strong> <strong>silvicultural</strong> <strong>activities</strong> <strong>using</strong> <strong>GIS</strong> based techniques: A case study of Selesjö inÖstergötland, Swedenproblems to be solved by 2020. These objectives describe the quality ofthe environment desired to be achieved and hence provide guidelines <strong>for</strong>decision makers to define the required measures to be taken by allsectors of society. Sustainable <strong><strong>for</strong>est</strong>s, thriving wetlands, flourishing lakesand streams, and good quality ground water are some of the targetswhich need sufficient consideration during <strong><strong>for</strong>est</strong> operational <strong>activities</strong>.By definition, in sustainable <strong><strong>for</strong>est</strong>, the value of <strong><strong>for</strong>est</strong> and <strong><strong>for</strong>est</strong> lands<strong>for</strong> biological production must be protected and at the same timebiological diversity, cultural heritage and recreational assets must besafeguarded. According to Sweden‟s environmental objectives council‟sevaluation report (2008), it is very hard to achieve „Sustainable Forests‟by 2020 since <strong><strong>for</strong>est</strong> resources are intensively exploited and in somerespects, biodiversity is declining. There<strong>for</strong>e, there is an essential need<strong>for</strong> further supervised measures in order to modify the opposing trendsand pave the way to meet this target in longer term. The <strong><strong>for</strong>est</strong>companies and other organizations involved in practical <strong><strong>for</strong>est</strong>ry give theissue a high priority.Current extraction road planning situation in Swedish <strong><strong>for</strong>est</strong>sCurrently in Swedish <strong><strong>for</strong>est</strong> companies, off-road networks are mainlydesigned by <strong><strong>for</strong>est</strong> operators at logging sites <strong>using</strong> thematic maps. Thisprocedure is rather complex, tedious, time and labor consuming. Itrequires simultaneous consideration of several significant factors, andhence the outcome results depend on the operators‟ individual skills andorganizational prerequisites. Consequently minor disregards, evenunintentionally, might result in disturbing the surrounding ecosystem.Thus, there is an essential need to manipulate the already existingmethods such as Multi- Criteria Decision Analysis (MCDA) and SpatialMulti-Criteria Decision Analysis (SMCDA), applicable through the everdeveloping computerized environment such as a GeographicIn<strong>for</strong>mation System (<strong>GIS</strong>), to facilitate and ease the path of movingtowards a more sustainable <strong><strong>for</strong>est</strong> management in Sweden andworldwide.Objectives and targets of the studyThe overall objective of the project was to develop a <strong>GIS</strong>-based method<strong>for</strong> utilizing existing spatial data <strong>for</strong> improved decision support <strong>for</strong> offroadrouting planning in <strong><strong>for</strong>est</strong> harvesting sites in order to minimizeenvironmental impacts on soil and water, caused by <strong><strong>for</strong>est</strong> operations.Proper route alignment with respect to lateral inclination of the ground,to support loaded <strong>for</strong>warders on slopes, was also considered in thismethod.The study specifically targeted two separate harvesting sites to designmain <strong>routes</strong> <strong>for</strong> off-road machinery movements. Each of the study areaswas evaluated under two possible scenarios. Suggested rout layouts wereanalyzed to provide a base <strong>for</strong> choosing a suitable scenario and itscorresponding rout design in each site.Decision support methodsMulti criteria decision analysisSimply defined by Eastman et al. (1998) decision is “a choice betweenalternatives”. Generally speaking, MCDA evaluates a set of diversecriteria to examine the suitability of possible alternatives. In most cases,these criteria are conflicting since they are introduced by different groupsof planners, decision makers and stake holders who usually possessdifferent ranges of interests and preferences. The aim of the MCDA3
Sima Mohtashami TRITA LWR Degree Project 11:20procedure is to bring all groups of interest to a consensus <strong>for</strong> evaluatingrelevant criteria and making the best decision.According to Malczewski (2006) the term „criterion‟ could refer to both„Attribute‟ and „Objective‟ in a decision making procedure. Accordingly,MCDA is categorized as either Multi Attribute Decision Analysis(MADA) or Multi Objective Decision Analysis (MODA). MADA isregarded as a „selection‟ procedure in a sense that it leads to a decision,based on a set of limited, predefined number of alternatives. On theother hand, in MODA, the best alternative would be chosen based on asurface of feasible possibilities. In order to evaluate the criteria, ameasurement scale is needed <strong>for</strong> considered attributes. The degree towhich each attribute could meet the objective would be the basis <strong>for</strong>comparing the alternatives (Malczewski, 1999).There are a variety of rules and procedures which can assist decisionmakers to choose and prioritize alternatives according to their differentperspectives, among which Weighted Linear Combination (WLC) hasattracted the planners‟ attention significantly because it is easilycomprehendible and also compatible with computerized tools(Malczewski, 2006).Traditionally MCDA procedures assumed spatial homogeneity within thearea under consideration, which is not an accurate assumption sincemany of the criteria encounters also spatial variation in reality. Thisreveals the need of a geographical dimension <strong>for</strong> criteria representationin MCDA, which could be achieved by application of a GeographicIn<strong>for</strong>mation System, <strong>GIS</strong> (Malczewski, 1999).Decision support systems, and spatial decision support systemsDecision Support System (DSS) has roots back in the 1960‟s whenresearchers started to employ computerized models to tackle theirscientific problems (Lubello, 2008). Gory and Scott Morton (1971)defined DSS as an “interactive computer based system within whichdecision makers utilize data and models to solve unstructuredproblems.” Malckzewski (1999) defined Spatial Decision Support system(SDSS), as any kind of computer interactive model that assists decisionmakers in solving semistructured spatially related problems to enhancehuman awareness and effectiveness during the process of decion making.According to Lubello (2008), the main characteristics of DSS could besummarized as:Provision of a user-friendly interface.Ability of integrating data sets with the analytical models.Capability of supporting different decision-making procedures.The distinctive capabilities of SDSS are described as they:Have the potential to capture spatial data as inputs.Provide techniques <strong>for</strong> analysing spatial data sets.Are capable of representing spatially related features and objects.Provide the results of the analysis in a variety of spatial <strong>for</strong>ms,such as 2D or 3D maps, etc.Geographic In<strong>for</strong>mation SystemsThere are two aspects in defining Geographic In<strong>for</strong>mation Systems(<strong>GIS</strong>); one focuses on technology values and the other on the problemsolving potential (Malczewski,1999).Technologically <strong>GIS</strong> was defined bythe Environmental Systems Research Institute (ESRI) as “A geographicin<strong>for</strong>mation system integrates hardware, software, and data <strong>for</strong> capturing,4
<strong>Planning</strong> <strong><strong>for</strong>est</strong> <strong>routes</strong> <strong>for</strong> <strong>silvicultural</strong> <strong>activities</strong> <strong>using</strong> <strong>GIS</strong> based techniques: A case study of Selesjö inÖstergötland, Swedenmanaging, analyzing, and displaying all <strong>for</strong>ms of geographicallyreferenced in<strong>for</strong>mation”. Approaching from a problem solvingperspective, Cowen (1988) defined <strong>GIS</strong> „as a decision support systeminvolving the integration of spatially referenced data in a problem solvingenvironment‟.Both these functionalities have contributed to the capability of <strong>GIS</strong> as atechnological tool which assists planners in exploring several datasets,extracting new in<strong>for</strong>mation depending on the problem under assessmentand contributing to making intelligent decisions.Relevant studies on off-road routingTerrain trafficability is a measure <strong>for</strong> evaluating the terrain‟s ability tosupport a vehicle‟s movement in the terrain. A high number ofresearchers with various goals and approches have studied differentfactors that determine this significant characteristic of the terrain. <strong>GIS</strong><strong>for</strong> assessing soil trafficability was initially deployed <strong>for</strong> military off-roadplanning and later on these application were introduced to <strong><strong>for</strong>est</strong> andagricultural land (Lubello, 2008). In some cases, terrain evaluation havebeen carried out based on economic considerations in order to optimizethe road models regarding financial values. Rongzu and Mikkonen (2004)used <strong>GIS</strong> as an aiding tool in their suggested decision support <strong>for</strong>optimization of wood logistics based on a combined cost surface createdfrom road transport costs and off-road transport cost surfaces. The offroadcost surfaces was constructed from indirect costs of a <strong>for</strong>warderand the machine costs in the terrain. Streams were considered as barriersin the cost surface to avoid disturbance. They used <strong>GIS</strong> to create anoptimum cost surface based on the amount of machinery (truck and<strong>for</strong>warder) costs <strong>for</strong> driving on different road/terrain classes <strong>for</strong> roadand off-road transportation of the wood. These costs were based onmonetary values.Dahlin and Fredricsson (1995) described how to compare different roadalternatives from a set of already available possibilities,by evaluating themonetary costs of terrain transportation and road building andcomparing it with the financial benefits gained from a road. Their modeldid not cover decision making concerning where to put the roads in anew area which lacks available optional road locations.In a moreenvironmental approach, Abdi et al. (2009) used an ArcView <strong>GIS</strong>extension, called PEGGER, to design six alternative <strong><strong>for</strong>est</strong> roadnetworks in the Northern Province of Iran, Mazandaran. PEGGER wasdeveloped by Rogers (2005) and uses contour maps to automate roadprojection <strong>for</strong> <strong><strong>for</strong>est</strong> planners in an Arc<strong>GIS</strong> environment. Abdi et al.(2009) evaluated some projected road alternatives <strong>using</strong> a suitability mapwhich had integrated factors such as slope, soil, geology, aspect, altitudeand volume of trees.Lubello (2009) suggested a rule-based spatial decision support system <strong>for</strong>planning of <strong><strong>for</strong>est</strong> operations <strong>using</strong> <strong>GIS</strong> techniques. His model actuallyconsists of two parts: one <strong>for</strong> „defining the skidding system‟ and one <strong>for</strong>„systems optimization and cost‟. The first part creates a feasibility map<strong>for</strong> different skidding systems based on the soil type, the amount of rainin different parts of the terrain per month and per year, a digital terrainmodel (DTM) of the area, and the existing road network. The authorintegrated soil type and amount of rain precipitation to define distinctclasses of gradeability on the terrain. Upward and downward slopeclasses were defined based on subtracting DTM values of the area fromthat of the roads, as a base <strong>for</strong> comparison, and thus positive values5
Sima Mohtashami TRITA LWR Degree Project 11:20would be indicating upward direction and negative values would beindicating downward slopes. These two outputs were integrated todetermine maximum slope to which off-road systems could move insidethe <strong><strong>for</strong>est</strong>. Finally in the second part, the model evaluated technical andeconomical preferences <strong>for</strong> different skidding systems. This evaluationwas also partly based on the already existed road network and thus couldnot be applied in the off-road planning phase.Suvinen (2006) used a <strong>GIS</strong>-based simulation model to evaluate theinteraction of terrain trafficabilty, vehicle mobility and terrain tractabilitythat takes place through the machine wheel‟s surface. In this study,machine characteristics such as mass and dimension, load condition,wheel specification and engine power of the machines are the propertieswhich were evaluated from the vehicle side, and on the other side, terraincondition and weather condition were considered to interact with themachine. Factors affecting terrain trafficabilty were divided into twotypes: 1) constant factors which are seasonally independent, like slope ofthe ground surface, and 2) dynamic factors which depend on the season,like moisture, snow, ice and frost. The model was capable of designingdifferent road layouts depending on the load condition of the <strong>for</strong>warderand the season of the year. However, lateral inclination, which has anessential role in guiding the vehicles properly in uneven terrain condition,was ignored in the model.All these studies reveal the existence of a great potential of <strong>GIS</strong> to assistplanners in assessing or designing off-road routing <strong>for</strong> <strong><strong>for</strong>est</strong>ryoperations. What criteria to consider and what procedure to followdepend on the objectives of the operational designers.STUDY AREAThe study area under consideration was the property Selesjö inÖstergötland. It is located in south-east Sweden and is mainly dominatedby Norway spruce and Scots pine. Figure 2 illustrates the location ofÖstergötland in Sweden and in the world map context.RESEARCH MATERIALSResearch materials utilized in this study included datasets and map layerscontaining the required in<strong>for</strong>mation. The <strong>GIS</strong> software (Arc<strong>GIS</strong> 10) wasused <strong>for</strong> off-road route planning in the areas under assessment, and <strong>for</strong>evaluation of the results. Relevant research articles were investigated inorder to review previous attempts, to avoid redundancy and to add somenewer steps to these kinds of planning procedures.Input dataA specification of the data used in this study is summarized in Table 1. ADTM layer, originating from a high resolution laser scanned layer (c. 10pulses per m2) provided by Foran Remote Sensing AB, was resampled toa coarser resolution of 4×4 m, to ensure an aggregated condition withinan area of such dimension, since the required width of the road tosupport the <strong>for</strong>warders‟ dimension is 4 meter. Consequently soil type,environmentally sensitive areas, study areas and ditches with a bufferdistance of 5m around them, were converted into raster layers with thesame resolution of 4×4 m.6
<strong>Planning</strong> <strong><strong>for</strong>est</strong> <strong>routes</strong> <strong>for</strong> <strong>silvicultural</strong> <strong>activities</strong> <strong>using</strong> <strong>GIS</strong> based techniques: A case study of Selesjö inÖstergötland, SwedenFigure 2. Location of the study area in map of the world (left) and in Sweden (right).The geographic reference system used <strong>for</strong> the data set wasGCS_SWEREF99 and the projected coordinate system wasSWEREF99_TM.Utilized softwareEnvironmental Systems Research Institute, Inc (ESRI) was founded byJack Dangermond in Redlands, Cali<strong>for</strong>nia, in the 1960‟s. ESRI‟s primarymission was to analyze geographic in<strong>for</strong>mation to support land plannersand resource managers in making in<strong>for</strong>med decisions. Gradually, ESRIextended its scope of activity from the project managing level to theproduct development stage. ARC/INFO was one of the primarysoftware products released by ESRI in the 1980‟s. It combines graphicdisplay of geographic features with a database management system <strong>for</strong>assigning attributes to them. Later on, after proving its validationthrough implementation of several successful projects, ESRI developedARC/INFO to the Arc<strong>GIS</strong> system, which is a modular and rescaleable<strong>GIS</strong> plat<strong>for</strong>m capable of working both on desktop PC‟s and across theenterprises (ESRI, undated page).In this study, Arc<strong>GIS</strong> version 10, including ArcMap, ArcCatalog andArcScene, were used <strong>for</strong> data preparation, data processing, in<strong>for</strong>mationexploration, evaluation and at the end, 3D visualization of the finalresults. The Slope, Aspect, Path distance and Cost Path tools availablefrom the Spatial Analysis and the 3D Analysis extensions where used tobuild up the desired model within the „Model Builder‟ environment ofArc<strong>GIS</strong>.METHODOLOGYThe model was supposed to plan the least costly <strong>routes</strong> through the bestdirections from destination points to the available landing point(s).Meanwhile it would help plan the <strong>routes</strong> with a proper orientation withrespect to direction of the slope of the ground.7
Sima Mohtashami TRITA LWR Degree Project 11:20Table 1. Description of the utilized data in the modelData Layer Name Type ContentDigital Terrain Model(DTM)Raster Resolution of0,5 × 0,5 mRepresents topography of the areaSoil Type Shape file (Polygon) Contains different classes of soil suchas till, sand, peat land, water, etc.Single Tree Stands Shape file (Point) represents every single tree, its type,height, volume and diameterRoads Shape file (Line) Contains existing main roadssurrounding the study areas.Environmental SensitiveareasShape files (polygon)Separate shape files containingvarious in<strong>for</strong>mation on natural assets,habitat protection, key biotopes,historical values, etc.Ditches Shape file (Line) Represents available ditches in thearea.Study Area Shape File (Polygon) Represents different harvestingcompartments in Selesjö, containsin<strong>for</strong>mation about the size of the area,in hectare, and their ownerNo go Areas Shape file (Polygon) Contains Sensitive areas whichdelineated after directed observationof the site by Skog<strong>for</strong>sk experts.Over passes Shape file (Line) Contains locality of two naturaloverpasses and one man-madebridge over the restricted region.Ortophoto of the region JPEG Illustrates an aerial view of the region,tree stands and main roads.In order to certify minimized environmental impacts and also securedcondition <strong>for</strong> operational machineries on varying slope levels, there is anessential need <strong>for</strong> simultaneous consideration of several significantfactors during the process of route planning <strong>for</strong> harvesting sites. Thisneed contributed to the choice to follow the MCDA methodology <strong>for</strong>integrating all the evaluated criteria into a single map surface showingdifferent levels of suitability. The weighted linear combination tool,applicable through the Weighted Overlay toolset in ArcMap, was applied<strong>for</strong> creating the cost-index surface. Afterwards, the cost-index surfacetogether with the source layer were fed into the Path Distance tool,where <strong>for</strong> each single cell the least accumulative cost <strong>for</strong> getting to thecheapest source and also the proper direction to take <strong>for</strong> moving to theneighbor cell was determined. These two outputs aligned with thedestination layer were inserted into the Cost Path tool to create the routelayout in the harvesting site.Scenario descriptionTwo different study areas were assessed in the context of this project.Each of them was evaluated under two different scenarios in order to8
<strong>Planning</strong> <strong><strong>for</strong>est</strong> <strong>routes</strong> <strong>for</strong> <strong>silvicultural</strong> <strong>activities</strong> <strong>using</strong> <strong>GIS</strong> based techniques: A case study of Selesjö inÖstergötland, Swedenexamine possibilities in the harvesting sites and to evaluate the routelayouts under different assumptions.Study area 1At study area 1, with an area of 6.72 hectares, there was just one possiblelanding point <strong>for</strong> the wood harvested within the borders of the studyarea. This landing point was selected on the last part of the existing main<strong><strong>for</strong>est</strong>ry road outside the study area and it was supposed to be reachedfrom 4 destination points distributed on harvesting site (Figure 3). Therewas a wetland between the landing point and part of the stand whichneeded to be protected against probable damage by machinery; it wascalled the „No Go‟ area and its border was defined by direct observationof the site. In Scenario 1, the <strong>routes</strong> were expected to go beyond thissensitive part and reach the end points, while in scenario 2 the possibilityof building a bridge to pass the wetland was analyzed to see how theroute layout would have to be adjusted to the new condition (AppendixFigure 1).Study area 2At Study area 2, with an area of 15.12 hectares, the existence of main<strong><strong>for</strong>est</strong>ry roads both north and south of the borders of the harvestingsection had created the opportunity of three different landing pointsaround the study area. Two of the landing points were located in thenorthern part, and the third one was located in the southern part (Figure3). In the first scenario, the <strong>routes</strong> were designed and distributedbetween all three possible landing points while in the second scenario,the southern landing point was removed from the analysis, and thus allthe destination points needed to reach one of the landing points innorth.Data processingThe scope of evaluated factors in this study was narrowed down toelevation, slope, aspect and soil type. Slope and aspect are twodatasets which were extracted from the DTM layer. The DTM layer wasfed in to the Slope tool to create slope variation of the terrain area. Theslope tool is used to calculate the maximum rate of change of elevationover the distance between a cell and its eight neighbors and it iscalculated either in percentages or degrees. Lower slope values representflatter regions and higher slope values represent steeper conditions of theterrain. The aspect could be defined as the slope direction. The Aspecttool was used to create its corresponding raster output from the DTMlayer. The values of this raster are compass direction of aspect, measuredclockwise in respect to north and varied between 0 and 359.9. Flat areaswere assigned the value of -1 (ESRI, 2011). An overview of the maininput parameters is illustrated in Appendix Figure 2, 3.Model descriptionCost-index surface preparationSince the utilized datasets had different scales of measurement, it wasnecessary to bring them all to a common relative scale of cost-indexvalues, varying from 1 to 5. For each layer, the most desirable conditionregarding our objective was assigned the minimum cost-index value (1),and the least desirable condition was assigned the maximum cost-indexvalue (5). The Reclassify tool was run over all the considered criteria.How to assign the cost-indexes to values of each layer was decidedthrough several meetings and discussions with the <strong><strong>for</strong>est</strong>ry experts atSkog<strong>for</strong>sk during January-April 2010.9
Sima Mohtashami TRITA LWR Degree Project 11:20Ü!(#*!(!(#*!(!( !( !(0 120 240 480Meters#*Legend#*source(Landing Point)!( DestinationsStudy AreaMain RoadsFigure 3. Landing points and destinations in Study area 1 (up)and Study area 2 (down).10
<strong>Planning</strong> <strong><strong>for</strong>est</strong> <strong>routes</strong> <strong>for</strong> <strong>silvicultural</strong> <strong>activities</strong> <strong>using</strong> <strong>GIS</strong> based techniques: A case study of Selesjö inÖstergötland, SwedenElevation, slope and soil type reclassificationThe <strong>routes</strong> were supposed to be laid out on high elevated surfaces inorder to avoid damage to sensitive soil types, such as clay, and to protectbogs and other wetlands, which are mostly located on flat areas. Theclassification was relative since our different study areas had differentvariations in elevation. Study area 1, had elevation values between 46 and65 meters while the second area had a variation of 52 to73 meters. Table2 summarizes the old values and the new value classes <strong>for</strong> all evaluatedcriteria. The steeper the slope of the ground the more difficult it wouldbe <strong>for</strong> the <strong>for</strong>warders to move on it, especially when they are fullyloaded. Based on the „Terrain Classification <strong>for</strong> Canadian Forestry‟Report (Mellgren, 1980) slope values were also reclassified into 5 levelsof suitability (Table 2). The two study areas were covered with differentsoil types. Mountains and rocks were assigned minimum cost-index of 1,since they would have minimum disturbance under the pressure of heavyvehicle passage. Fine sands and sediments were assigned value 2, till as 3and silt as 5 (Table 2). Water, clay and peat lands were regarded asconstraints and removed from the final cost surface (Table 3).Aspect classificationSince the values of the aspect layer could not be regarded as suitable orunsuitable inherently, they could not be evaluated by the above mentionedreclassifying procedure. Aspect values suitability was conceived whenthey were compared to the <strong>for</strong>warder‟s direction of movement.According to experts‟ knowledge and experience at the Skog<strong>for</strong>sk, theaspect direction is regarded as suitable when it is parallel with the<strong>for</strong>warder direction of movement and it would be extremely unsuitablewhen the angles are greater than 5 degrees compared to the <strong>for</strong>warderdirection of movement. The aspect layer was regarded as a horizontalfactor within the Path Distance tool. An ASCII table was prepared andinserted into this tool to define variation of suitability with respect topossible angles between the aspect direction and the <strong>for</strong>warder directionof movement (Table 4). More detailed in<strong>for</strong>mation is provided in thePath Distance description part.Weighted overlayAll the above mentioned reclassified factors, except aspect, wasintegrated into a single cost-index surface <strong>using</strong> the spatial analytical toolWeighted Overlay. This tool has the potential to merge these factorswhile applying different weights/level of importance to them. Theapplied weights are relative percentages and the sum of them must equal100%. According to the expert judgments, elevation was regarded as themost important factor and hence it gained 50% of influence. Slope with30% of the applied weights was the next, and finally the soil typeachieved the remaining 20% of the importance (Table 2). We could notapply more weights to soil type due to data inaccuracy, <strong>for</strong> examplecomparing this data layer with the laser scanned layers of the same area itwas seen that the ditches locations in the soil type are within a distancefrom their actual position in the laser scanned layer.Constraint considerationAs mentioned earlier, constraints are the parts of the surface whichwould be excluded from the cost-index surface <strong>for</strong> specific reasons. Thecommon constraints <strong>for</strong> both study areas were: very steep slopes i.e.slope greater than 18 degrees, and sensitive soil types like peat lands.11
Sima Mohtashami TRITA LWR Degree Project 11:20Table 2. Summary of data reclassificationFactors Percentage ofinfluenceFactors classificationStudy area 1 Study area 2Old values New values Old values New values65 - 60 1 73 - 68 160 - 55 2 68 - 64 2Elevation 50%55 - 50 3 64 - 60 350 - 46 5 60 - 56 456 - 52 50 – 6 1 0 – 6 16 - 11 2 6 - 11 2Slope 30%11 - 18 3 11 - 18 318 - 27 4 18 - 27 427 - 90 5 27 - 90 5Soil type 20%Rocks-Outcrops1 Rocks-OutcropsTill 3 Fine sand,Glaciofluvialsediment12silt 5 Till 3Sum 100%At Study area 1, ditches with a buffer distance of 5 meters around themand the „No Go‟ area, were other additional constraints. At Study area 2,an area of „nature conservation‟ was identified within the harvesting siteand thus it was removed from the cost-index surface. Ditches werelocated out of the harvesting border here.All these constraint layers were reclassified to have „No Data‟ values <strong>for</strong>those restricting conditions and the value of 1 <strong>for</strong> all other non-restrictedareas. They were then combined together and finally were multiplied bythe cost-index surface, which resulted in the final cost-index surfacewhich would be fed in to the next part of the model.Path Distance toolThe Path Distance tool is one of the available tools in ArcMap, withinSpatial Analyst, to per<strong>for</strong>m cost distance analysis. According to the ESRIdefinition, the Path Distance tool, calculates <strong>for</strong> each cell, the leastaccumulative cost distance to the nearest source, and has the potential toadd more complexity to the analysis while accounting <strong>for</strong> surfacedistance, and <strong>for</strong> horizontal and vertical cost factors as additional factors.12
<strong>Planning</strong> <strong><strong>for</strong>est</strong> <strong>routes</strong> <strong>for</strong> <strong>silvicultural</strong> <strong>activities</strong> <strong>using</strong> <strong>GIS</strong> based techniques: A case study of Selesjö inÖstergötland, SwedenTable 3. Constraints Specification and reclassification <strong>for</strong> each study area.ConstrainsSlope > 18OldvaluesStudy area 1 Study area 2NewvaluesOldvaluesNewvalues18 – 27 No Data 18 – 27 No Data27 – 90 No Data 27 – 90 No Data0thers 1 0thers 1Soil typePeat land No Data Peat land No DataWater No Data Water No DataClay No Data Clay No Dataothers 1 others 1Ditches‘No go’areasNaturereservesDitches No Data Ditches No Dataothers 1 others 1No goareas No Data _____others 1_____NaturereservesNo DataOthers 1The No Data values would be regarded as barriers in the Path Distancetool. The parameters used as inputs to the Path Distance tool could bedescribed as:Source; a raster or feature data set, identifying the cells or locations towhich the least accumulated cost of getting back from every single cellposition, would be calculated. The possible landing points in each studyarea were regarded as source. It can include one or more featurelocations. In the first study area, the source contained one location, whilein the second study area, the source contained three different featurelocations <strong>for</strong> distance analysis.Cost raster; a raster representing the cost per unit distance of moving plainmetrically through each cell. Thus, each cell location value needs to bemultiplied by the cell resolution and also compensated <strong>for</strong> diagonalmovement.From a cell perspective, the <strong>for</strong>mula used <strong>for</strong> calculating the cost oftravel from cell a to cell b in „Path Distance‟ tool is defined by ESRI(2011) as: For perpendicular movement:Cost_distance = Cost_Surface * Surface_distance *{[Friction(a)* Horizontal_factor(a) + Friction(b) *Horizontal_factor(b)] / 2} *Vertical_factor For diagonal movement:Cost_distance = Cost_Surface * Surface_distance * 1.414214 *{[Friction(a) * Horizontal_factor(a) +Friction(b) * Horizontal_factor(b)] / 2} *Vertical_factor13
Sima Mohtashami TRITA LWR Degree Project 11:20The cost-index surface, prepared by the Weighted Overlay function, wasthe input cost raster.Surface Raster; a raster layer containing elevation in<strong>for</strong>mation at each celllocation. It was used to calculate the actual surface distance between thecell locations. The DTM layer was used as surface raster in this tool.Horizontal raster; a raster specifying the horizontal direction at each celllocation in integers, varying between 0 and 360 degrees with 0 as northand increasing clockwise. Flat areas were assigned the value of -1. Theaspect layer containing exactly this required in<strong>for</strong>mation was used ashorizontal raster. The values of the horizontal raster together with thehorizontal factor were used to evaluate the cost of moving horizontallyfrom a cell to its neighbors.Horizontal Factor (HF) object; defines the relationship between thehorizontal cost factor and the Horizontal Relative Moving Angle(HRMA). The HF object can be in <strong>for</strong>m of HF Binary, HF Forward, HFLinear, HF Inverse Linear and HF Table. In our model, HF Table wasused to define the relation between HRMA and HF. It is an ASCII filewith two columns. The first column represents the HRMA (variesbetween 0 to 180 degrees) and the second columns represents theassigned horizontal factor to each HRMA. Since we wanted the roads tohave a maximum side inclination of 5 degrees, the assigned HF increasedlinearly from 1 to 5 when HRMA changed between 1 to 5. For all theother possible HRMA greater than 5 degrees up to 176 degrees, the HFwas assigned a very large value (100) to create extremely undesirableconditions <strong>for</strong> the model and to avoid laying the <strong>routes</strong> with those angleswith respect to the slope direction (aspect). For HRMA between 175 and180, HF again decreased linearly from 5 to 1. For HRMA values of 0 and180, the HF was defined as 1, since moving parallel with the slopedirection, either upwards or downwards, is also a secure condition <strong>for</strong>loaded <strong>for</strong>warders (Table 4).The output parameters of the Path Distance tool are a Distance Raster anda Backlink Raster. The Distance Raster stores <strong>for</strong> each cell the leastaccumulated cost of getting back to the source while compensating <strong>for</strong>horizontal surface factors and surface distance. The Backlink Rasterstores <strong>for</strong> each cell, values between 0 and 8, which are the code values<strong>for</strong> the direction to take from each cell along the least accumulative costpath to the least costly source available <strong>for</strong> it.Cost Path toolThe output of the Cost Path tool is a raster file, determining the leastcost path from a destination point to a source, <strong>using</strong> the Raster Distanceand the Backlink Raster that were calculated in the previous stage. Thedestinations are shape files, selected within the borders of the study areasin a way to provide access to all parts of the harvesting sites (Figure 3).The length of suggested roads <strong>for</strong> each scenario was measured inArcMap, to provide some basis of economical comparison of thesuggested route layouts in both study areas. The designed <strong>routes</strong>,together with the source and the destination locations where imposed onthe cost surface layer in ArcScene. All the layers achieved their baseheights from the DTM layer, and an exaggeration of 5 was applied toprovide a better 3D visualization of the <strong>routes</strong> in the terrain.14
<strong>Planning</strong> <strong><strong>for</strong>est</strong> <strong>routes</strong> <strong>for</strong> <strong>silvicultural</strong> <strong>activities</strong> <strong>using</strong> <strong>GIS</strong> based techniques: A case study of Selesjö inÖstergötland, SwedenTable.4 ASCII code used <strong>for</strong> defining variation of ‘HorizontalFactor’ respect to ‘Horizontal Relative Moving Angel(HRMA)’.Horizontal Relative MovingAngle (HRMA)Horizontal Factor0 11 12 23 34 45 510 10020 10030 10040 10050 10060 10070 10080 10090 10010 100110 100120 100130 100140 100150 100160 100170 100175 5176 4177 3178 2179 1180 1Figure 4 illustrates an overview of the entire model. Later on, the treestand layer was used to evaluate the number and volume of trees to beharvested within the interested sections of both study areas (AppendixFigure 4 and 5).Sensitivity analysisIn order to evaluate the sensitivity of the model with respect to theweights applied to each of the factors, a sensitivity analysis wasper<strong>for</strong>med by increasing the slope importance to 50% and decreasing theelevation weight to 30%, while the soil type level of importance was notchanged due to its inaccuracy.Evaluation of the suggested <strong>routes</strong> in realityThe suggested route layouts, created in shape <strong>for</strong>mat, were transferredinto a GPS device in order to examine the accuracy of the model‟s routedesign in real condition of the two study areas. Visiting the study areasoccurred in May 2011.15
Sima Mohtashami TRITA LWR Degree Project 11:20ABFigure 4. Model overview: A) application of the Path Distance tool and the Cost Pathtool <strong>for</strong> distance analysis, B) creating a ‘Cost Surface’ <strong>using</strong> the Weighted Overlayfunction in Model Builder.RESULTSStudy area 1, Scenario 1Figure 5 illustrates how the model planned the least costly <strong>routes</strong> fromthe destinations to the source while compensating <strong>for</strong> surface distanceand horizontal factor, which is the orientation of slope. As explainedearlier, there was a wetland in the way of connecting the destinationswithin the site to the landing point, outside the harvesting border. InScenario 1, the model was supposed to plan the <strong>routes</strong> while goingbeyond this restricted part. Figure 6 demonstrates different views of the3D visualization of the suggested <strong>routes</strong> in ArcScene 10 environment.Study area 1, Scenario 2In this scenario, three different possibilities of building bridges in thearea were evaluated. Locations 1 and 3 were natural overpasses whilelocation 2 was the suggested place <strong>for</strong> constructing a bridge over thewetland. This wetland was considered as a barrier in the first scenario.How the model adjusted the route alignment with the new condition isdemonstrated in 2D and 3D maps (Figure 7 and Figure 8).16
<strong>Planning</strong> <strong><strong>for</strong>est</strong> <strong>routes</strong> <strong>for</strong> <strong>silvicultural</strong> <strong>activities</strong> <strong>using</strong> <strong>GIS</strong> based techniques: A case study of Selesjö inÖstergötland, Sweden1243Figure 5. Least-costly <strong>routes</strong> suggested by the model <strong>for</strong> Study area 1, Scenario 1.17
Sima Mohtashami TRITA LWR Degree Project 11:20ABCFigure 6. 3D view of the model's route suggestion <strong>for</strong> Study area1, Scenario 1,A) right view, B) front view and C) left view.18
<strong>Planning</strong> <strong><strong>for</strong>est</strong> <strong>routes</strong> <strong>for</strong> <strong>silvicultural</strong> <strong>activities</strong> <strong>using</strong> <strong>GIS</strong> based techniques: A case study of Selesjö inÖstergötland, Sweden1243Figure 7. Least-costly <strong>routes</strong> suggested by the model <strong>for</strong> Study area 1, Scenario 2.19
Sima Mohtashami TRITA LWR Degree Project 11:20ABCFigure 8. 3D view of the model's route suggestion <strong>for</strong> Study area1, Scenario 2,A) front view, B) left view and C) right view.20
<strong>Planning</strong> <strong><strong>for</strong>est</strong> <strong>routes</strong> <strong>for</strong> <strong>silvicultural</strong> <strong>activities</strong> <strong>using</strong> <strong>GIS</strong> based techniques: A case study of Selesjö inÖstergötland, SwedenComparing the two scenarios of Study area 1In Scenario 1, the total length of the suggested <strong>routes</strong> to reachdestinations 2, 3 and 4 in the harvesting site was 1,616 m while afterconstructing the bridge, the total length of the <strong>routes</strong> <strong>for</strong> reaching tothese points was reduced to 929 m. Assuming the maximum possibleload <strong>for</strong> a <strong>for</strong>warder as 20 tons, having 1572.67 tons of woods to becollected through this bridge illustrated in Appendix Figure 1, almost 79full <strong>for</strong>warder loads would be required <strong>for</strong> collecting all the trees stands,and would thus contribute to 158 passes of the route by <strong>for</strong>warders.Taking into account the knowledge from Skog<strong>for</strong>sk experts about themaximum possible velocity of <strong>for</strong>warders as 0.8 m/s, and the cost of<strong>for</strong>warder operations as 850 SEK per hour, following the route patternin Scenario2 and taking the <strong>routes</strong> over the bridge number 3, this wouldcontribute to 858.75 s = 0.24 h per each one way route saving in timeand a total of 32232 SEK saving in terms of money. Comparing thisvalue with the cost of constructing the bridge as 5000 SEK, estimated byexperts at Skog<strong>for</strong>sk and consisting of the cost of 3 hours‟ work of theharvester and the cost of timber, certifies that making a bridge over thewetland area not only could preserve soil and water conditions at thewetland, but also would contribute a remarkable reduction in cost of the<strong>for</strong>warder operation at the site. The calculation procedure is described inAppendix I.Study area 2, Scenario 1For this area, the location of the existing main roads around the studyarea provided three possibilities <strong>for</strong> landing points and collecting the treestands. Two of the landing points were located north of the harvestingsite, and the third one was located in the southern part.In Scenario 1, all the tree landing points were inserted into the model assources. Figure 9 illustrates how destination points were connected tothe cheapest source along the least costly paths. Figure 10 illustrates the3D view of the <strong>routes</strong> and the cost surface imposed on the DTM layer.Study area 2, Scenario 2In Scenario 2, the southern landing point was removed from the sourcelayer, providing just the two landing points in the northern part.Destinations 5 and 6 were replaced by destination 5*, located near thesouthern border of the site, to provide access to the whole area to beharvested.Figure 11 demonstrates how the destination points were distributedbetween the two landing points, located north of the study area. The 3Dview of the suggested <strong>routes</strong> is illustrated in Figure 12.Comparing the two scenarios of Study area 2At Study area 2, different scenario conditions resulted in different routedesigns. In Scenario 1, the model connected destination 6 to the landpoint located at the southern part, along a rather short road section of353 m, which would be used to collect 584.5 tons of wood at this part,(Appendix Figure 2). In Scenario 2, the wood would be collected from alonger distance of 655 m.21
Sima Mohtashami TRITA LWR Degree Project 11:201237456Figure 9. Least-costly <strong>routes</strong> suggested by the model <strong>for</strong> Study area 2, Scenario 1.22
<strong>Planning</strong> <strong><strong>for</strong>est</strong> <strong>routes</strong> <strong>for</strong> <strong>silvicultural</strong> <strong>activities</strong> <strong>using</strong> <strong>GIS</strong> based techniques: A case study of Selesjö inÖstergötland, SwedenABFigure 10. 3D view of the model's route suggestion <strong>for</strong> study area 2, scenario 1,A) back view, B) right view.Assuming the same characteristics <strong>for</strong> <strong>for</strong>warders, having maximum loadcapacity as 20 tons and average velocity as 0.8 m/s, utilization of thesouthern landing point in Scenario 1 could contribute to 377.5 s = 0.1 hsavings in time and 5100 SEK cost. Calculation procedure is described inAppendix I.23
Sima Mohtashami TRITA LWR Degree Project 11:20123475*Figure 11. Least-costly <strong>routes</strong> suggested by the model <strong>for</strong> Study area 2, Scenario 2.24
<strong>Planning</strong> <strong><strong>for</strong>est</strong> <strong>routes</strong> <strong>for</strong> <strong>silvicultural</strong> <strong>activities</strong> <strong>using</strong> <strong>GIS</strong> based techniques: A case study of Selesjö inÖstergötland, SwedenABFigure 12. 3D view of the model's route suggestion <strong>for</strong> study area 2, scenario 2,A) front view, B) back view.Sensitivity analysisThe results of the sensitivity analysis <strong>for</strong> all scenarios of Study area 1 and2 together with the primary route layouts with the first set of appliedweights are illustrated in Figure 14 and Figure 15 respectively. The redlines represent the suggested <strong>routes</strong> with the first set of applied weights,which considered elevation as the most important factor, and thushaving 50% of influence in the cost surface cell values. The green <strong>routes</strong>are the model‟s new suggestion after assigning 50% weight to the slope25
Sima Mohtashami TRITA LWR Degree Project 11:20DISCUSSIONlayer, and reducing the elevation influence to 30%. Soil type influencedid not cause any change in this analysis.Evaluation of the suggested <strong>routes</strong> in realityFollowing the designed <strong>routes</strong> with the GPS device showed that themodel had been successful in finding the optimum <strong>routes</strong> by avoidingdisturbing the wet lands, ditches, nature reserves and other restrictedparts, following the elevated regions with higher bearing capacity,wherever exist any, and aligning properly with respect to the slopedirection of the ground.At Study area 1, the presence of a wetland in the way of connecting thelanding point to the destinations in the harvesting site, steered the modelto the solution of reaching all the destinations from the northern part. InScenario2, after inserting the layer containing possible bridge locationswith minimum cost-index as 1 into the cost surface, it could be seen thatthe route pattern was mainly changed due to the suggested bridgenumber 3. Destinations 2, 3 and 4 would reach the landing point throughthe route layouts that passed bridge number 3, while destination 1 wouldfollow almost the same pattern as the previous scenario with minoradjustments at the natural overpass 1.At Study area 2, the configuration of the main <strong><strong>for</strong>est</strong>ry roads around theharvesting site provided three different possibilities <strong>for</strong> locating landingpositions. In Scenario1, destination 6 was connected to the cheapestlanding point located in the south, based on the accumulated cost factorsand the distance raster layer (the DTM layer).In Scenario 2 destination 5*had just two possible landing points to choose and reach to the outerboarder of the harvesting area. Here again, based on the abovementioned parameters, destination 5* was connected to the mostappropriate landing point, which was the source located in north-east ofthe study area.Sensitivity analysisAt Study area 1, changing the weights of influence <strong>for</strong> considered factorsdid not change the outline of the suggested roads, except in very smallsections (Figure 13). It can be conceived that in this region there aresignificant flat areas that are located on high elevated regions and thusdifferent applied weights to these two factors did not cause anyoutstanding changes in the final result. In contrast, at Study area 2, it isseen that the route outline showed significant changes in connecting thedestinations 1 and 7 to their corresponding sources (Figure 14). Thiscould be interpreted as in this study area, all the elevated areas were notnecessarily located on less steep slopes, and thus assigning different levelof importance to each of these criteria would result in different roadsuggestions <strong>for</strong> the harvesting site.Making decision about distributing weights of importance amongdifferent factors could be decided by planners of the <strong><strong>for</strong>est</strong> companies atthe harvesting site after examining other important natural condition atthe site.26
<strong>Planning</strong> <strong><strong>for</strong>est</strong> <strong>routes</strong> <strong>for</strong> <strong>silvicultural</strong> <strong>activities</strong> <strong>using</strong> <strong>GIS</strong> based techniques: A case study of Selesjö inÖstergötland, Sweden11224433Figure 13. Model route suggestion with elevation as the most important factor (red<strong>routes</strong>) and slope as the most important factor (green <strong>routes</strong>) <strong>for</strong> Study area 2,Scenario 1.12313245 674 75*Figure 14. Model route suggestion with elevation as the most important factor (red<strong>routes</strong>) and slope as the most important factor (green <strong>routes</strong>) <strong>for</strong> Study area 2,Scenario 1.27
Sima Mohtashami TRITA LWR Degree Project 11:20CONCLUSIONSFURTHER WORKForests are natural resources that provide various vital services <strong>for</strong>diverse groups of consumers from human beings to native biotopes.Recent human exploitation of this natural environment as a woodresource has brought about the issue of avoiding severe environmentaldamages to soil and water which threatens growth, reproduction andbiodiversity in <strong><strong>for</strong>est</strong> lands. These adverse impacts could be avoided orminimized through in<strong>for</strong>med and comprehensive preplanning byapplying the knowledge and technology that already exist.The aim of this study was to provide decision support <strong>for</strong> protecting soiland water during harvesting <strong>activities</strong>. In order to achieve this goal, therewere plenty of important elements that could be taken into account todetermine suitability of the terrain <strong>for</strong> supporting off-road trafficabilty,however the scope of this study was narrowed down to elevation of theground, soil type, slope and its direction. These factors were assessedfollowing an MCDA procedure. Weighted linear combination was theapplied rule <strong>for</strong> prioritizing and rescaling the considered factors andintegrating them to a single map of suitability, called a Cost-IndexSurface.<strong>GIS</strong> was found as quite an applicable tool, with great potential <strong>for</strong>visualizing the problem, exploring available data layers and evaluatingpossible solutions <strong>for</strong> every single designed scenario. Using the „PathDistance‟ and „Cost Path‟ tools within the „Model Builder‟ environment,a model was created to design main access off-<strong>routes</strong> within theharvesting sites. The designed model suggested the cheapest access<strong>routes</strong>, regarding the cost-index values, while accounting <strong>for</strong> the actualdistance to pass in the terrain. It was also designed to compensate <strong>for</strong>lateral inclination more than 5 degrees with respect to the slopedirections on the harvesting site. 3D visualizations of the suggested<strong>routes</strong> as illustrated in the Results section fully displayed how much themodel have been successful in this task. Moreover, validation of theresults in the harvesting sites <strong>using</strong> a GPS device to follow the routepattern and orientation, especially on the slopes, also proved theaccuracy of the final results. All the constrained regions were assignedthe value of „No Data‟ and were removed from the cost surface area.This meant that these areas were regarded as barriers by the model andthis functionality assures complete preservation of environmentallysensitive areas in these kinds of models. The Arc<strong>GIS</strong> environmentprovided the opportunity to define different complexes of possiblelanding points and available surfaces to design unique route layouts,evaluate them from environmental and economic point of view to makethe most appropriate decision in each scenario of possibilities.In continuation of this study, further important factors such as macroand micro-topography, obstacles, vegetation types, topographic wetnessindex and meteorological in<strong>for</strong>mation such as snow levels could beadded to the evaluated criteria to assure a more comprehensive andsecure model that meets the objectives of the <strong><strong>for</strong>est</strong>ry planners in moredetail.28
<strong>Planning</strong> <strong><strong>for</strong>est</strong> <strong>routes</strong> <strong>for</strong> <strong>silvicultural</strong> <strong>activities</strong> <strong>using</strong> <strong>GIS</strong> based techniques: A case study of Selesjö inÖstergötland, SwedenREFERENCESAbdi, E., Majnounian, B., Darvishsefat, A., Mashayekhi, Z., Sessions, J.,2009. A <strong>GIS</strong>-MCE based model <strong>for</strong> <strong><strong>for</strong>est</strong> road planning. Journal of<strong><strong>for</strong>est</strong> science, 55 (4): 171-176.Bishop, K., Allan,C., Bringmark, L., Garcia, E., Helsten, S., Högbom, L.,Johanson, K., Lomander, A., Meili, M., Munthe, J., Nilson, M.,Polvati, P., Skyllberg, U, Sorensen, R., Zetterberg, T. Åkerbolm, S.,2009. The Effects of Forestry on Hg Bioaccumulation inNemoral/Boreal Waters and Recommendations <strong>for</strong> GoodSilvicultural Practices. Ambio. 38 (7): 373-379.Cowen, D., 1988. <strong>GIS</strong> versus CAD versus DBMS: what are thedifferences. Photogrammetric Engineering and Remote Sensing, 54:1551-1555.Eastman, J.R., Jiang, H., Toledano, J., 1998. Multi-criteria and multiobjectivedecision making <strong>for</strong> land allocation <strong>using</strong> <strong>GIS</strong>. In :Beinat,E., Nijkamp, P. MultiCriteria Analysis <strong>for</strong> Land UseManagement , Kluwer Academic Publisher, 227-247.Eliasson, L., 2005. Effects of Forwarder Tyre Pressure on RutFormation and Soil Compaction. Silva Fennica. 39 (4): 549-557.Fredricsson, J., Dahlin, B., 1995. Computer-Assisted Forest Road<strong>Planning</strong>- A Proposed Interactive Model With Spatial Emphasis onPrivate Forest Land. Journal of <strong><strong>for</strong>est</strong> engineering .6 (2): 35-39.Gorry, G.A., Scott Morton, M.S., 1971. A framework <strong>for</strong> in<strong>for</strong>mationsystem. Sloan Management Review. 13 (1): 56-79.Lubello, D., 2008. A rule-based SDSS <strong>for</strong> integrated <strong><strong>for</strong>est</strong> harvestingplanning. PhD thesis. Padova: Universita Degli Studi di Padova.Malczewski, J., 1999. <strong>GIS</strong> and Multi Criteria Decision Analysis. NewYork, USA: John Willey & Sons.Malczewski, J., 2006. <strong>GIS</strong>-based multicriteria decision analysis: a surveyof literature. International Journal of Geographic In<strong>for</strong>mationScience. 20 (7): 703-726.Mellgren, P.G., 1980. Terrain Classification <strong>for</strong> Canadian Forestry.Montreal: Canadian Pulp and Paper Association.Rogers, L., 2005. Automating Contour-Based Road Projection <strong>for</strong>Preliminary Forest Road Designs Using <strong>GIS</strong>. Master of Science.University of Washington. p 87.Rongzu,Q., Mikkkonen,E., 2004. <strong>GIS</strong>-based decision support system <strong>for</strong>wood logistics. Forestry Studies in China. 6 (4): 29-33.Suvinen, A., 2006. A <strong>GIS</strong>-based Simulation Model <strong>for</strong> TerrainTractability. Journal of Terramechanics .43: 427-449.Wu,C., Ayers, P.D., Anderson, A.B., 2007. Validating a <strong>GIS</strong>-based multicriteriamethod <strong>for</strong> potential road identification. Journal ofTerramechanics. 44 (3): 255-263.29
Sima Mohtashami TRITA LWR Degree Project 11:20OTHER REFERENCESArc<strong>GIS</strong> Resource Center Desktop 10, 2010, understanding path distanceanalysis, online, (updated at:12/11/2010), available at:[http://help.arcgis.com/en/arcgisdesktop/10.0/help/index.html#//009z00000022000000.htm], viewed 10 February 2011Arc<strong>GIS</strong> Resource Center Desktop 10, 2010, Aspect (SpatialAnalyst),online, (updated at:12/11/2010), available at :[http://help.arcgis.com/en/arcgisdesktop/10.0/help/index.html#//009z000000tr000000.htm], viewed 8 February 2011.Arc<strong>GIS</strong> Resource Center Desktop 10, 2010, Slope(Spatial Analyst),online, (updated at:12/11/2010), available at :[http://help.arcgis.com/en/arcgisdesktop/10.0/help/index.html#//009z000000v2000000.htm], viewed 8 February 2011.ESRI 2011, What is <strong>GIS</strong>, online, available at:[http://www.gis.com/content/what-gis], viewed 4 April 2011.ESRIInfo, ESRI History, online, available at: [www.esri.com/aboutesri/about/history.html],viewed5 April 2011.The Swedish Forestry Act, Skogsstyrelsen, online, availableat:[http://www.skogsstyrelsen.se/en/<strong><strong>for</strong>est</strong>ry/The-Forestry-Act/The-Forestry-Act/] , viewed 2 December 2010.Sweden‟s Environmental Objectives in Brief, 2008, SwedishEnvironmental Objective Council, online, [http://www.naturvardsverket.se/Documents/publikationer/978-91-620-8324-3.pdf], viewed 3 December 2010.Barth, Andreas: Skog<strong>for</strong>sk. Discussion on criteria selection andevaluation of the result, (Group meetings, January, February, March,April 2011).Bergkvist, Isabelle: Skog<strong>for</strong>sk. Discussion on criteria selection andevaluation of the results, (Group meetings, January, February, March,April 2011).Sonesson, Johan: Skog<strong>for</strong>sk. Discussion on criteria selection andevaluation of the results, (Group meetings, January, February, March,April 2011).Thor, Magnus: Skog<strong>for</strong>sk. Discussion on criteria selection and evaluationof the results, (Group meetings, January, February, March, April2011).Jönsson, Petrus: Skog<strong>for</strong>sk. Discussion on criteria selection andevaluation of the results, (Group meetings, January, February, March,April 2011).Mörk, Anders: Skog<strong>for</strong>sk. Discussion on designing route distribution inharvesting sites, (Group meetings, March, April 2011).30
<strong>Planning</strong> <strong><strong>for</strong>est</strong> <strong>routes</strong> <strong>for</strong> <strong>silvicultural</strong> <strong>activities</strong> <strong>using</strong> <strong>GIS</strong> based techniques: A case study of Selesjö inÖstergötland, SwedenAPPENDIX I123Appendix Figure 1. Suggested over passes <strong>for</strong> the Study area 1, Scenario 2. 1 and 3are natural overpasses while 2 is the suggested location <strong>for</strong> building a bridge overthe restricted wetland.I
<strong>Planning</strong> <strong><strong>for</strong>est</strong> <strong>routes</strong> <strong>for</strong> <strong>silvicultural</strong> <strong>activities</strong> <strong>using</strong> <strong>GIS</strong> based techniques: A case study of Selesjö inÖstergötland, SwedenABCDAppendix Figure 3. Main input data layers of the model at Study area 2: A) DTM,B) elevation, C) slope, D) aspectIII
Sima Mohtashami TRITA LWR Degree Project 11:20Appendix Figure 4. Visualization of the tree stands of the studyarea 1. Light green represents total tree stands; Dark greenrepresents the trees to be collected over the bridge on the wetlandEconomic evaluation of Study area 1: Route length (m) Scenario 1-Route length(m) Scenario 2=1972-1285 = 687 m Assuming maximum velocity of <strong>for</strong>warders as : 0.8 m/s687(m) / 0.8(m/s) =858.75 s = 0.24 h Tree volumes to be collected from destinations 2, 3, 4=2526.38 m 3 SK= 2096.8954 (m3 solid under bark) = 1572.67155 tons Assuming maximum possible load of <strong>for</strong>warders as 20 tons:1572.6 (tons of tree stands) / 20 (Possible tons of load/<strong>for</strong>warder) =78.63 number of loaded <strong>for</strong>warder contribute to almost 158 times passageof <strong>for</strong>warders Assuming cost of <strong>for</strong>warder as 850 SEK/h:0.24×158×850 = 32232 SEKIV
<strong>Planning</strong> <strong><strong>for</strong>est</strong> <strong>routes</strong> <strong>for</strong> <strong>silvicultural</strong> <strong>activities</strong> <strong>using</strong> <strong>GIS</strong> based techniques: A case study of Selesjö inÖstergötland, SwedenAppendix Figure 5. Visualization of the tree stands of the studyarea 1. Light green represents total tree stands; dark greenrepresents the trees to be collected from either destinations 5 and6 in Scenario 1 or destination 5* in Scenario2.Economic evaluation of Study area 2: Difference of route section 5 and section 5* =655-353=302 m Assuming maximum velocity of <strong>for</strong>warders as : 0.8 m/s302(m) / 0.8(m/s) = 377.5 s = 0.1 h Tree volume =939.02 m 3 SK= 779.3866 (m3 solid under bark)=584.5 tons Assuming maximum possible load of <strong>for</strong>warders as 20 tons:584.5 (tons of tree stands) / 20 (Possible tons of load/<strong>for</strong>warder) =29.2 number of loaded <strong>for</strong>warders which contribute to almost 60 times ofpassages by <strong>for</strong>warders. Assuming cost of <strong>for</strong>warder as 850 SEK/hour, finally the amount of saving inmoney:60 × 0.1× 850 = 5100 SEKV