A Better, More Diverse Senior Executive Service in 2050
A Better, More Diverse Senior Executive Service in 2050
A Better, More Diverse Senior Executive Service in 2050

Create successful ePaper yourself
Turn your PDF publications into a flip-book with our unique Google optimized e-Paper software.
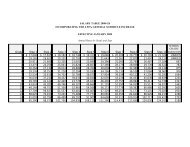
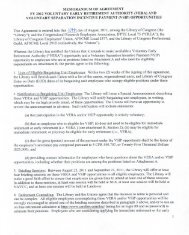
We start then with a review of where the <strong>Senior</strong> <strong>Executive</strong> <strong>Service</strong> and its feedergrades stand today. CAP built a dynamic quantitative model to explore the projectedmakeup of the <strong>Senior</strong> <strong>Executive</strong> <strong>Service</strong> <strong>in</strong> 2030. (See pages 11-13 for details.)Our f<strong>in</strong>d<strong>in</strong>gs make it clear that the projected ethnic, racial, and gender makeupof the <strong>Senior</strong> <strong>Executive</strong> <strong>Service</strong> will not reflect that of the workforce <strong>in</strong> 2030 andbeyond. (see table 1) Most notably:SES<strong>Senior</strong> <strong>Executive</strong> <strong>Service</strong> and Civilian Labor Force Comparison 2000-20302000 2010 2020 2030LaborForceDifferenceSESLaborForceDifferenceSESLaborForceDifferenceSESLaborForceDifferenceAsianMale 1.1% 1.6% 2.5% -0.9% 2.7% 3.0% -0.4% 3.4% 3.5% -0.1%Female 0.5%11.1% 2.3% -1.2% 1.8% 2.9% -1.1% 2.6% 3.5% -0.9%Total 1.6% 2.7% 4.8% -2.1% 4.5% 5.9% -1.5% 6.0% 7.0% -1.0%African AmericanMale 5.5% 5.5% 0.0% 5.3% 5.6% -0.3% 5.3% 5.8% -0.5% 5.3% 5.9% -0.6%Female 2.9% 6.2% -3.4% 4.0% 6.2% -2.2% 6.7% 6.4% 0.3% 9.5% 6.5% 3.0%Total 8.4% 11.8% -3.4% 9.3% 11.7% -2.5% 12.0% 12.2% -0.2% 14.8% 12.4% 2.4%HispanicMale 2.0% 6.3% -4.4% 2.7% 8.6% -5.9% 3.2% 10.6% -7.5% 4.4% 12.8% -8.4%Female 0.7% 4.6% -3.9% 1.0% 6.0% -5.0% 1.5% 7.7% -6.2% 2.4% 9.7% -7.3%Total 2.6% 10.9% -8.3% 3.7% 14.6% -10.9% 4.7% 18.4% -13.7% 6.8% 22.5% -15.7%OtherMale 0.87% 2 1.2% 1.3% -0.1% 0.9% 1.5% -0.6% 0.9% 1.8% -0.9%Female 0.33% 0.5% 1.2% -0.7% 0.6% 1.4% -0.8% 0.7% 1.6% -0.9%Total 1.21% 1.7% 2.5% -0.8% 1.5% 2.9% -1.4% 1.6% 3.4% -1.8%M<strong>in</strong>orityMale 9.5% 14.4% -4.9% 10.7% 18.1% -7.3% 12.0% 21.0% -9.0% 13.9% 24.0% -10.1%Female 4.4% 13.0% -8.6% 6.5% 15.6% -9.1% 10.6% 18.4% -7.8% 15.1% 21.3% -6.1%Total 13.9% 27.4% -13.6% 17.3% 33.7% -16.4% 22.6% 39.3% -16.8% 29.1% 45.3% -16.2%WhiteMale 67.3% 39.3% 28.0% 58.9% 36.1% 22.7% 51.1% 33.6% 17.5% 45.1% 30.7% 14.4%Female 18.7% 33.8% -15.1% 23.8% 31.6% -7.7% 26.4% 29.3% -2.9% 25.9% 26.7% -0.8%Total 86.1% 73.1% 13.0% 82.7% 67.7% 15.0% 77.4% 62.9% 14.5% 70.9% 57.4% 13.5%Overall % Male 77% 53% 23% 70% 53% 16% 63% 53% 10% 59% 53% 6%Overall % Female 23% 47% -23% 30% 47% -16% 37% 47% -10% 41% 47% -6%1”Asian” and “Other” data could not be disaggregated because before 2003 the Bureau of Labor Statistics calculated these groups together. See Current Population Survey technical documentation: http://www.bls.gov/cps/rscps03.pdf.2Ibid.Source: Office of Personnel Management, Bureau of Labor Statistics, CAP Projections.7 Center for American Progress | A <strong>Better</strong>, <strong>More</strong> <strong>Diverse</strong> <strong>Senior</strong> <strong>Executive</strong> <strong>Service</strong> <strong>in</strong> <strong>2050</strong>