3Q11 - Zon
3Q11 - Zon
3Q11 - Zon

You also want an ePaper? Increase the reach of your titles
YUMPU automatically turns print PDFs into web optimized ePapers that Google loves.
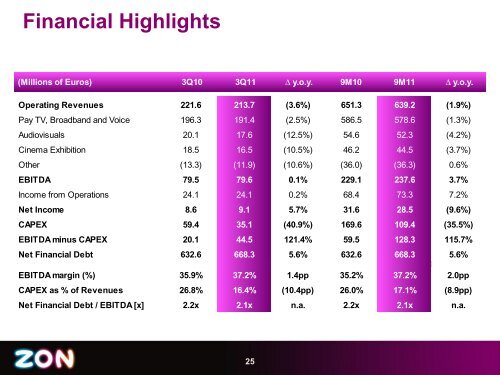
Financial Highlights(Millions of Euros) 3Q10 <strong>3Q11</strong> ∆ y.o.y. 9M10 9M11 ∆ y.o.y.Operating Revenues 221.6 213.7 (3.6%) 651.3 639.2 (1.9%)Pay TV, Broadband and Voice 196.3 191.4 (2.5%) 586.5 578.6 (1.3%)Audiovisuals 20.1 17.6 (12.5%) 54.6 52.3 (4.2%)Cinema Exhibition 18.5 16.5 (10.5%) 46.2 44.5 (3.7%)Other (13.3) (11.9) (10.6%) (36.0) (36.3) 0.6%EBITDA 79.5 79.6 0.1% 229.1 237.6 3.7%Income from Operations 24.1 24.1 0.2% 68.4 73.3 7.2%Net Income 8.6 9.1 5.7% 31.6 28.5 (9.6%)CAPEX 59.4 35.1 (40.9%) 169.6 109.4 (35.5%)EBITDA minus CAPEX 20.1 44.5 121.4% 59.5 128.3 115.7%Net Financial Debt 632.6 668.3 5.6% 632.6 668.3 5.6%EBITDA margin (%) 35.9% 37.2% 1.4pp 35.2% 37.2% 2.0ppCAPEX as % of Revenues 26.8% 16.4% (10.4pp) 26.0% 17.1% (8.9pp)Net Financial Debt / EBITDA [x] 2.2x 2.1x n.a. 2.2x 2.1x n.a.25