- Page 1 and 2:
Owner’s HandbookInstruktieboekjeM
- Page 3 and 4:
Congratulations on your choice of a
- Page 5 and 6:
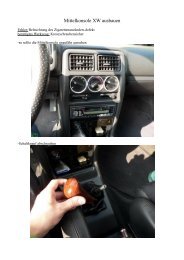
ControlsBEFORE YOU DRIVEControls1 2
- Page 7 and 8:
Locks & AlarmWith the key:1. Insert
- Page 10 and 11:
Locks & Alarm1Interior locking swit
- Page 12 and 13:
Locks & AlarmREMOTE HANDSET BATTERY
- Page 14 and 15:
Locks & AlarmKEYS AND HANDSETSYou h
- Page 16 and 17:
Locks & Alarm1CHILD-PROOF LOCKSNEVE
- Page 18 and 19:
SeatsSeatsMANUALLY OPERATED FRONT S
- Page 20 and 21:
Seats1HEAD RESTRAINTSHead restraint
- Page 22 and 23:
SeatsSeat cushion angle (Driver’s
- Page 24 and 25:
SeatsDRIVER’S SEAT MEMORY FACILIT
- Page 26 and 27:
Seat BeltsSEAT BELTSTo minimise inj
- Page 28 and 29:
Seat BeltsSeat belt locking mechani
- Page 30 and 31:
Seat BeltsSEAT BELT PRE-TENSIONERST
- Page 32 and 33:
Airbag SRSTo ensure correct deploym
- Page 34 and 35:
Airbag SRS1An inflating airbag canc
- Page 36 and 37:
Airbag SRSSide head impact protecti
- Page 38 and 39:
Airbag SRSSERVICE INFORMATIONAfter
- Page 40 and 41:
MirrorsMirrorsPOWER-OPERATED DOOR M
- Page 42 and 43:
Mirrors1INTERIOR REAR-VIEW MIRRORAu
- Page 44 and 45:
WindowsWindowsPOWER-OPERATED WINDOW
- Page 46 and 47:
SunroofSunroofSUNROOF OPERATION*1Ac
- Page 48 and 49:
Heating & VentilationHeating & Vent
- Page 50 and 51:
Heating & VentilationWith air condi
- Page 52 and 53:
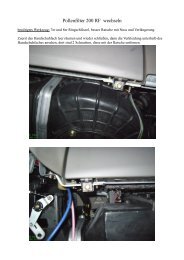
Heating & Ventilation1Heater bypass
- Page 54 and 55:
Heating & Ventilation1AUTOMATIC TEM
- Page 56 and 57:
Heating & VentilationBlower control
- Page 58 and 59:
Interior Equipment1Interior Equipme
- Page 60 and 61:
Interior Equipment1CLOCK11 12110 29
- Page 62 and 63:
Interior EquipmentASHTRAYSFront ash
- Page 64 and 65:
Interior EquipmentCUP HOLDERSFront
- Page 66 and 67:
Audio System1Audio SystemREMOTE AUD
- Page 68 and 69:
Load CarryingLoad CarryingFOLDING T
- Page 70 and 71:
Load CarryingROOF RACKS & TOW BARST
- Page 72 and 73:
TowingTowingTOWING A TRAILERH2712It
- Page 74 and 75:
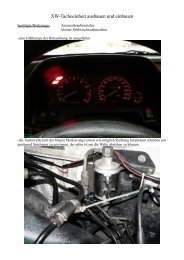
InstrumentsFuel gaugeThe pointer fa
- Page 76 and 77:
InstrumentsService interval display
- Page 78 and 79:
Trip Computer2When a trip computer
- Page 80 and 81:
Warning Lights2Warning LightsWARNIN
- Page 82 and 83:
Warning Lights2Check engine - YELLO
- Page 84 and 85:
Warning Lights2UPPER CENTRE CLUSTER
- Page 86 and 87:
Warning Lights2Engine malfunction -
- Page 88 and 89:
Message Centre2Bonnet/boot open - R
- Page 90 and 91:
Message Centre2Number plate light f
- Page 92 and 93:
Message Centre2Low oil pressure - R
- Page 94 and 95:
Message Centre2Trailer light fail*
- Page 96 and 97:
Starting & Driving2Starting & Drivi
- Page 98 and 99:
Starting & DrivingDIESEL MODELSStar
- Page 100 and 101:
Environmental Driving2Environmental
- Page 102 and 103:
Catalytic ConverterCatalytic Conver
- Page 104 and 105:
Automatic Transmission2Automatic Tr
- Page 106 and 107:
Automatic Transmission2Using the au
- Page 108 and 109:
Automatic TransmissionAUTOMATICALLY
- Page 110 and 111:
Manual Gearbox2Manual GearboxGEAR L
- Page 112 and 113:
Fuel SystemTYPE OF FUELPetrol engin
- Page 114 and 115:
Fuel SystemFUEL CUT-OFF SWITCH2ALWA
- Page 116 and 117:
Lights & Indicators2FOG LIGHTS21Fog
- Page 118 and 119:
Lights & IndicatorsDIRECTION INDICA
- Page 120 and 121:
Lights & Indicators2HEADLIGHT BEAM
- Page 122 and 123:
Wipers & Washers2Wipers & WashersWI
- Page 124 and 125:
Cruise Control2Cruise ControlCRUISE
- Page 126 and 127:
BrakesBrakesFOOT BRAKEFor added saf
- Page 128 and 129:
BrakesHANDBRAKE2DO NOT drive with t
- Page 130 and 131:
BrakesBraking in an emergencyIf an
- Page 132 and 133:
Traction Control2Warning lightOn ca
- Page 134 and 135:
Parking AidParking aid in operation
- Page 136 and 137:
Maintenance3Service PortfolioThe Se
- Page 138 and 139:
MaintenanceOWNER MAINTENANCEIn addi
- Page 140 and 141:
ROVEREngine CompartmentEngine Compa
- Page 142 and 143:
Engine Compartment2.0 & 2.5 petrol
- Page 144 and 145:
EngineEngineENGINE OILCheck the oil
- Page 146 and 147:
Cooling SystemCooling SystemCOOLANT
- Page 148 and 149:
BrakesBrakesBRAKE FLUIDThe level of
- Page 150 and 151:
Power SteeringCheck & Top-up3Fluid
- Page 152 and 153:
BatteryBattery safetyBatteries cont
- Page 154 and 155: BatteryBattery chargingAs the batte
- Page 156 and 157: WipersWipersWIPER BLADESGrease, sil
- Page 158 and 159: Tyres3Tyre wear indicatorsH2703Tyre
- Page 160 and 161: Cleaning & Vehicle CareCleaning & V
- Page 162 and 163: Cleaning & Vehicle CareWindows and
- Page 164 and 165: Wheel Changing4EMERGENCY INFORMATIO
- Page 166 and 167: Wheel ChangingPositioning the jack4
- Page 168 and 169: Wheel Changing4LOCKING WHEEL BOLTS3
- Page 170 and 171: Emergency Starting4ABH28602.0 & 2.5
- Page 172 and 173: Vehicle RecoveryVehicle RecoveryTOW
- Page 174 and 175: Vehicle RecoveryTransporter or trai
- Page 176 and 177: Fuses4Checking or renewing a fuse20
- Page 178 and 179: Fuses4Fuse number Rating (AMPS) Cir
- Page 180 and 181: Bulb Replacement4Bulb ReplacementRE
- Page 182 and 183: Bulb ReplacementOutboard headlights
- Page 184 and 185: Bulb ReplacementFront fog lightRepl
- Page 186 and 187: Bulb Replacement4Side repeater ligh
- Page 188 and 189: Bulb Replacement4Number plate light
- Page 190 and 191: Bulb Replacement4Rear courtesy ligh
- Page 192 and 193: Parts & AccessoriesParts & Accessor
- Page 194 and 195: Identification Numbers4Identificati
- Page 196 and 197: Technical Data52.5 litre petrolFuel
- Page 198 and 199: Technical Data5WHEELS & TYRESWheel
- Page 200 and 201: Technical Data5TowingPressure - bar
- Page 202 and 203: Technical Data5WEIGHTSApproximate u
- Page 206 and 207: IndexAABS 128ABS warning light 129A
- Page 208 and 209: IndexPollen filter 52Power steering