Irrigated cereal production put to the test - Greenmount Press
Irrigated cereal production put to the test - Greenmount Press
Irrigated cereal production put to the test - Greenmount Press

You also want an ePaper? Increase the reach of your titles
YUMPU automatically turns print PDFs into web optimized ePapers that Google loves.
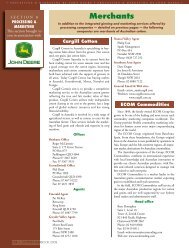
<strong>Irrigated</strong> <strong>cereal</strong> <strong>production</strong><strong>put</strong> <strong>to</strong> <strong>the</strong> <strong>test</strong>By Donald McMurrich, AgCentral Grain SystemsI’m going <strong>to</strong> start this article off withplenty of excuses, so you can alreadytell <strong>the</strong>re was nothing really <strong>to</strong> bragabout by way of exceptional <strong>cereal</strong> yieldsin our 2005 irrigated experiments. Thesetrials formed part of <strong>the</strong> Super Crop Challengeinitiated in Australian Grain magazinein 2004. We are searching for wholefarm system approaches <strong>to</strong> help maximisegrain yields and returns.For <strong>the</strong> first six months of last year wewere in drought. This was coupled with along 2004–05 summer crop growing seasonresulting in slightly higher water useby <strong>the</strong> irrigated cot<strong>to</strong>n phase of our <strong>production</strong>system. This meant that through<strong>the</strong> winter crop decision-making periodof March, April and May, we were in aquandary as <strong>to</strong> whe<strong>the</strong>r <strong>to</strong> even plant <strong>the</strong>winter crop.With some crops in <strong>the</strong> ground, andno rain predicted, it was decided <strong>to</strong> startwatering up some fields. Then it started <strong>to</strong>rain, and rain some more — for <strong>the</strong> nextfour or five weeks when <strong>the</strong> bulk of <strong>the</strong>crop should have been sown.By <strong>the</strong> middle of August <strong>the</strong> fields weredry enough <strong>to</strong> work on again but by <strong>the</strong>nwe decided that <strong>the</strong>se ‘late’ crops shouldbe taken through on <strong>the</strong> ‘cheap andcheerful’. We reasoned that if it becamehot in late Oc<strong>to</strong>ber — an extremely criticalperiod of winter <strong>cereal</strong> plant growth— <strong>the</strong> extreme heat would shut <strong>the</strong> plantdown.These very wet conditions meant thatsome of <strong>the</strong> farmers I have been workingTABLE 1: Variety trial 2005Variety Yield t/ha % ofcontrolGS 02 (NZ) 8.37 124LPB 01 (France) 8.34 123LPB 02 (France) 8.06 120LPB 04 8.01 119GS 01 (NZ) 7.77 115GS 03 (NZ) 7.59 112LPB 03 7.06 105LPB 05 7.04 104HRZ 04 6.94 103Giles (Aust’n) 6.75 100HRZ 02 6.36 94Sowing accuracy and <strong>the</strong> resulting crop configuration from <strong>the</strong> Sulky one-pass system.with around Gunnedah, on <strong>the</strong> LiverpoolPlains, didn’t get much of a crop in.Of <strong>the</strong> crops that were planted andwatered up, subsequent water-loggingcaused very inconsistent planting configurationsand patchy fields. It was decided<strong>the</strong>se crops should not be ‘pushed’ as <strong>the</strong>yield potential for <strong>the</strong>se fields was alreadygreatly reduced.So by August, with only a small numberof fields with any potential, and with mos<strong>to</strong>f <strong>the</strong> farmers I have worked with for <strong>the</strong>previous three seasons out of <strong>the</strong> game, itwas clear <strong>the</strong> crops were never going <strong>to</strong>be blinders.Sulky one-pass systemGiven <strong>the</strong> difficult 2005 season we didwhat was possible at sowing time. For <strong>the</strong>first time we introduced a ‘Sulky’ one-passestablishment system.This system incorporates <strong>the</strong> trash from<strong>the</strong> cot<strong>to</strong>n crop, creates a tilth and pulls<strong>the</strong> soil from one metre hills <strong>to</strong> two metrebeds. It packs it all down firmly with apacker roller and sows <strong>the</strong> <strong>cereal</strong> crop at12.5 cm (five inch) row spacings.This gave us 14 rows of wheat on <strong>to</strong>pof <strong>the</strong> bed. Coupled with <strong>the</strong> increase inplant population, this greatly improved<strong>the</strong> Crop Canopy Index or <strong>the</strong> crops’ ability<strong>to</strong> intercept light.This machine really proved its worthlast season as it was confronted with soilwhich could only be described as concreteat <strong>the</strong> end of <strong>the</strong> dry spell, <strong>to</strong> <strong>the</strong> o<strong>the</strong>rvery wet extreme later in <strong>the</strong> season. Itwas working in <strong>the</strong> wet soil conditionsbefore any of <strong>the</strong> standard sowing gear.During <strong>the</strong> growing season we followed<strong>the</strong> growth stages of <strong>the</strong> plants and introducednutrition, plant growth regula<strong>to</strong>rsand fungicides where necessary.Last season more replicated work wasdone <strong>to</strong> see if <strong>the</strong>re were varieties with agreater genetic potential <strong>to</strong> yield under<strong>the</strong>se high in<strong>put</strong> systems (Table 1).We are essentially modeling our systemon a European/New Zealand style of <strong>production</strong>.Is <strong>the</strong>re an advantage in havingaccess <strong>to</strong> international genetic material?The short answer is ‘yes’. In 2005 weintroduced both European and New Zealandgermplasm with some impressiveresults in small replicated plots. Table 1shows that it may be possible <strong>to</strong> increaseyield by 24 per cent by changing varieties.Given that variable costs remain prettymuch <strong>the</strong> same, it means a 24 per centincrease in gross return.The seed companies involved wereGrainsearch and Longreach and <strong>the</strong>CSIRO (HRZ) High Rainfall Zone plantbreeding program.In coming years <strong>the</strong> higher yieldingvarieties will be available with specificagronomic packages, which if followedclosely, should allow farmers <strong>to</strong> replicateand improve on current trial successes.18 — THE AUSTRALIAN COTTONGROWER APRIL–MAY 2006
The money endThese Super Crop demonstrations have revealed that <strong>the</strong> dollarreturn per hectare can be improved through this style of highin<strong>put</strong> <strong>production</strong> system. The dollar return per megalitre can alsobe enhanced.Table 2 shows that <strong>the</strong> highest yielding irrigated crop in a verydifficult 2005 season was 8.0 <strong>to</strong>nnes per hectare. Coupled witha very low commodity price, <strong>the</strong> gross margin was much lowerthan <strong>the</strong> previous season at $357 per hectare.But on a positive note a return per megalitre of $178 wasstill achieved. This is a very encouraging figure as it suggestsvery strongly that as we refine our high in<strong>put</strong> crop establishmentand agronomy — and with access <strong>to</strong> higher yielding, high in<strong>put</strong><strong>cereal</strong> varieties — a return of between $300–$500 per megalitreis achievable.There is also <strong>the</strong> rotational benefit <strong>to</strong> following crops <strong>to</strong> beconsidered.The Cot<strong>to</strong>n Catchment Communities CRC will fur<strong>the</strong>r investigate<strong>the</strong> benefits of high in<strong>put</strong>/irrigated wheat <strong>production</strong>.This article first appeared in Australian Grain March–April 2006, andwas contributed by Cot<strong>to</strong>n Growers Services.For more information contact Donald McMurrich on 0427 799 500.TABLE 2: Cereal gross margins and returns permegalitre under <strong>the</strong> high in<strong>put</strong> <strong>production</strong> systems,2003–05Crop his<strong>to</strong>ry Cot<strong>to</strong>n 1 Fallow 2 Fallow 32003, 8.60 t/ha $180/t2004, 10.24 t/ha $175/t2005, 8.03 t/ha 145/tIncome $/ha 1548 1792 1164Variable costsEstab./seed 210 210 210Starter fertiliser 110 30 55Herbicide 20 10Plant Growth Regula<strong>to</strong>r (PGR) 21 22 22Spring nitrogen 200 172 170Fert. application µnutrients 85 60 45Fungicides 60 60 55Irrigations x 2 100 100 100Harvesting costs 158 185 150Total variable costs ($/ha) 964 849 807Gross margin ($/ha) 584 943 357Water use (ML/ha) 2.70 1.50 2.00Return ($/ML) 216 629 178CROP HISTORY & LOCATION NOTES1 Wheat following a 2002–03 cot<strong>to</strong>n crop at Boggabri;2 Wheat following a February 2004 ploughed out cot<strong>to</strong>n cropon <strong>the</strong> Breeza Plain; and,3 Wheat following a 12 month fallow at Warren.APRIL–MAY 2006 THE AUSTRALIAN COTTONGROWER — 19