- Page 1 and 2:
Environmental Assessment ReportDraf
- Page 3 and 4:
2.3.7 Resettlement Sites 2-192.4 Su
- Page 6 and 7:
10.2.3 Public Consultation 10-910.3
- Page 8:
ERP Emergency Response Plan RTWs Ri
- Page 11 and 12:
1 Introduction1.1 Project Backgroun
- Page 13 and 14:
1.1.3 Key Project Components5. The
- Page 15 and 16:
option, a consideration has been ma
- Page 17 and 18:
1.2.1.6 Relevant National Polices19
- Page 19 and 20:
Act/Rule/Law/Ordinance Responsible
- Page 21 and 22:
No.Environment Related Internationa
- Page 23 and 24:
Red CategoryProjectsIEE, NOCs, and
- Page 25 and 26:
environmental risks and impacts in
- Page 27 and 28:
Baseline parameters;Level of consul
- Page 29 and 30:
There is no exclusive habitat of an
- Page 31 and 32:
1.5.5 ADB Study (ADB PPTA May 2007)
- Page 33 and 34:
Detailed environmental management p
- Page 35 and 36:
criteria assessment was done for RT
- Page 37 and 38:
Preparation of Draft and Updated EI
- Page 39 and 40:
the impacts to be monitored, and wh
- Page 41 and 42:
Table of Contents2 Description of t
- Page 43 and 44:
2. The Project influence area will
- Page 45 and 46:
This page intentionally kept blank.
- Page 47 and 48:
2.3.1 Main BridgeFigure 2-3: Sub-co
- Page 49 and 50:
are being studied by RTW team. Figu
- Page 51 and 52:
2.3.2.3 General Alignment of RTW19.
- Page 53 and 54:
Figure 2-7: RTW typical cross-secti
- Page 55 and 56:
Figure 2-9: Typical cross-section o
- Page 57 and 58:
41. In Mawa side, a newly emerged C
- Page 59 and 60:
The anchor towers would be taller t
- Page 61 and 62:
Starting &endingchainage(Km)23+260
- Page 63 and 64:
SlNo.Contract Package2010 2011 2012
- Page 65 and 66:
2.7 Relevant Associated Components5
- Page 67 and 68:
Table of Contents3 Description of t
- Page 69 and 70:
Table 3-51: Communication network i
- Page 71 and 72:
3 Description of the Environment3.1
- Page 73 and 74:
Figure 3-3: Digital Elevation Map o
- Page 75 and 76:
3.1.2.2 Strata along North Bank9. E
- Page 77 and 78:
Silt (%) 81 70 77 17Clay (%) 17 3 1
- Page 79 and 80:
April 2005: IRS P6 LISS III Satelli
- Page 81 and 82: ProjectComponentsConstructionYardLe
- Page 83 and 84: Figure 3-11: Monthly rainfall in Ma
- Page 85 and 86: alluvial silt, alluvial silt and cl
- Page 87 and 88: Figure 3-14: Seismic zoning map of
- Page 89 and 90: District upazila Union Mouza No. of
- Page 91 and 92: Figure 3-17: Flood prone areas in t
- Page 93 and 94: 3.2 Ecological ResourcesFigure 3-19
- Page 95 and 96: 3.2.2 Forests and Protected Areas44
- Page 97 and 98: All flood plains in the Project are
- Page 99 and 100: A. Kathalbari Char, 5km U/S of BR,
- Page 101 and 102: 51. Terrestrial birds can be divide
- Page 103 and 104: C. Turn at Kathalbari Char, 4km U/S
- Page 105 and 106: Char Janajat, 11km U/S of Bridgekm
- Page 107 and 108: Figure 3-27: Migratory and Uncommon
- Page 109 and 110: Gangetic GharialGangetic DolphinGan
- Page 111 and 112: Reptiles63. During the study eight
- Page 113 and 114: Figure 3-30: Fish breeding grounds
- Page 115 and 116: 3.2.4.1 Species of Conservation Sig
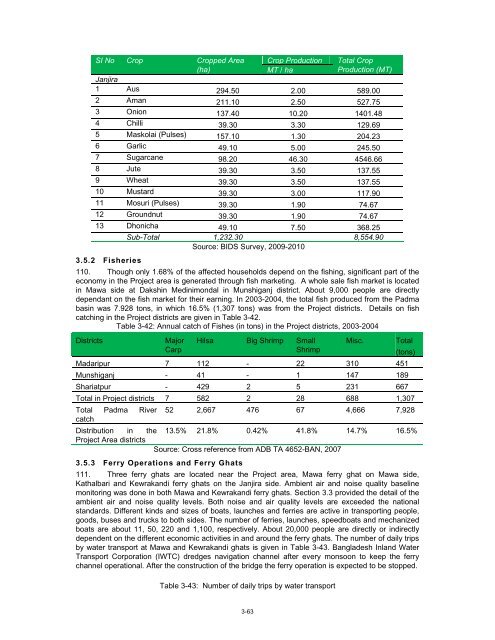
- Page 117 and 118: Estimated total production from cap
- Page 119 and 120: Figure 3-35: Fish catch composition
- Page 121 and 122: River-Bed Materials: Metals (As, Cd
- Page 123 and 124: ID Location PM 10 PM 2.5 SPM SO x N
- Page 125 and 126: Location Date TimeMea Med Max Min S
- Page 127 and 128: Source: The Consultant Environmenta
- Page 129 and 130: 3.4.1 Population and Community Char
- Page 131: 3.4.4 Physical and Cultural Resourc
- Page 135 and 136: 117. However, during the operation
- Page 137 and 138: exhaustive.3.5.8 Water Supply and S
- Page 139 and 140: Mode of travel Mawa side Janjira si
- Page 141 and 142: CHAPTER 4:SCOPINGAND PRIORITIZATION
- Page 143 and 144: 4 Scoping and prioritization of imp
- Page 145 and 146: land, further up and downstream of
- Page 147 and 148: Step 4a: Assigning composite rating
- Page 149 and 150: development of Resettlement SitesCo
- Page 151 and 152: Second Priority Environmental Compo
- Page 153 and 154: construction yard and other constru
- Page 155 and 156: Filling of flood plains &Tree felli
- Page 157 and 158: Table of ContentsList of Tables ...
- Page 159 and 160: 5.2 Data and Information Collection
- Page 161 and 162: 12. Estimate of future sea level ri
- Page 163 and 164: Table 5-2: GHG emission from the Pr
- Page 165 and 166: 5.5.2 Impacts Management/Adaptive P
- Page 167 and 168: Table of ContentsList of Tables 6-i
- Page 169 and 170: 2. During FS, the location of the b
- Page 171 and 172: Figure 6-2: Alternate locations stu
- Page 173 and 174: 3. Environmental and SocialAspects2
- Page 175 and 176: Table 6-2: Evaluation Criteria for
- Page 177 and 178: site for the construction of the pr
- Page 179 and 180: Table 6-3: Comparison of concrete e
- Page 181 and 182: equirementsConstructabilityConstruc
- Page 183 and 184:
Fisheries and other aquatic lifeMat
- Page 185 and 186:
6.5.2 Design of Transition Structur
- Page 187 and 188:
each, the top of the revetment can
- Page 189 and 190:
33. An extensive alternative analys
- Page 191 and 192:
Criterion Alternative 1Revetment al
- Page 193 and 194:
Criterion Alternative 1Revetment al
- Page 195 and 196:
Criterion Alternative 1Revetment al
- Page 197 and 198:
6.8 Conclusion37. Figure 6-6 presen
- Page 199 and 200:
CHAPTER 7:ASSESSMENT OFIMPACTS/RISK
- Page 201 and 202:
Figure 7-2: Distribution of census
- Page 203 and 204:
loss of livelihoods or business opp
- Page 205 and 206:
700.00600.00500.00612.70MawaJanjira
- Page 207 and 208:
NameIUCN/CITESStatusEndangeredLocal
- Page 209 and 210:
NameLarge TreeFrogIndian BullFrogIU
- Page 211 and 212:
Estimation of Noise Levels from Pil
- Page 213 and 214:
About 2 km length through riverbed
- Page 215 and 216:
c. Monitor area for these creatures
- Page 217 and 218:
Wave protectionUnderwater slope pro
- Page 219 and 220:
temporary drainage problem in those
- Page 221 and 222:
Table 7-12: Tree cut for constructi
- Page 223 and 224:
Landuse Type Mawa (ha) Janjira (ha)
- Page 225 and 226:
agricultural land and support crops
- Page 227 and 228:
There must be adequate sanitary lat
- Page 229 and 230:
L eq (1 hr) (dBA)Train SpeedDistanc
- Page 231 and 232:
2009 12 42 48 392 462014 60 169 230
- Page 233 and 234:
GenderTransport Communication111. V
- Page 235 and 236:
124. Traffic and Transit Accidents:
- Page 237 and 238:
140. Deterioration in surface water
- Page 239 and 240:
161. A number of districts are not
- Page 241 and 242:
CHAPTER 8:ENVIRONMENTALMANAGEMENT A
- Page 243 and 244:
Figure 8-2: Guiding Principles for
- Page 245 and 246:
2. The EMMP prepared in accordance
- Page 247 and 248:
11. The monitoring program will als
- Page 249 and 250:
ImpactMitigation measuresMonitoring
- Page 251 and 252:
ProjectActivitiesEnvironmentalImpac
- Page 253 and 254:
ProjectActivitiesEnvironmentalImpac
- Page 255 and 256:
ProjectActivitiesEnvironmentalImpac
- Page 257 and 258:
ProjectActivitiesEnvironmentalImpac
- Page 259 and 260:
ProjectActivities3. Approach RoadsC
- Page 261 and 262:
ProjectActivitiesEnvironmentalImpac
- Page 263 and 264:
ProjectActivitiesDrainage ofrunoff
- Page 265 and 266:
ProjectActivitiesEnvironmentalImpac
- Page 267 and 268:
Parameter Location Means of Monitor
- Page 269 and 270:
Parameter Location Means of Monitor
- Page 271 and 272:
Parameter Location Means of Monitor
- Page 273 and 274:
Table 8-3: Summary of Costs of EMP
- Page 275 and 276:
costs, resettlement of the affected
- Page 277 and 278:
oundary between the two layers and
- Page 279 and 280:
Figure 8-4: Maximum size of Charlan
- Page 281 and 282:
Materials can be filled in the boat
- Page 283 and 284:
have provisions for 1,944 housing p
- Page 285 and 286:
77. The main functions of CEMC are
- Page 287 and 288:
8.9.2.3 Institutional Arrangement87
- Page 289 and 290:
quality even for basic services. In
- Page 291 and 292:
the location should be relatively i
- Page 293 and 294:
118. Experts required for the wildl
- Page 295 and 296:
Increasing crop yield on the existi
- Page 297 and 298:
detailed business plans will be mad
- Page 299 and 300:
Other environmental enhancement pro
- Page 301 and 302:
CHAPTER 9:INSTITUTIONALARRANGEMENTS
- Page 303 and 304:
9 Institutional Arrangements and Ca
- Page 305 and 306:
Supervision and monitoring of the p
- Page 307 and 308:
He/She is responsible for the prope
- Page 309 and 310:
in the country verifying that the e
- Page 311 and 312:
9.2.1.1 Manager Safeguard (Environm
- Page 313 and 314:
Preparation of EIA/SEIA such as scr
- Page 315 and 316:
(i) The GRC shall review, consider
- Page 317 and 318:
BBAExecutiveDirectorEnvironmentalMa
- Page 319 and 320:
Table of Contents10 Public Consulta
- Page 321 and 322:
10 Public Consultation and Informat
- Page 323 and 324:
Daily Ittefaq, Dhaka, July 10, 2009
- Page 325 and 326:
LocationConsultationDate andTimePar
- Page 327 and 328:
FGD: RS 3 South MedinimondalFGD: Ka
- Page 329 and 330:
Figure 10-7: First Public Consultat
- Page 331 and 332:
Table 10-5: Suggestions obtained fr
- Page 333 and 334:
Discussion pointswill occur at coun
- Page 335 and 336:
Table 10-6: Opinion obtained from F
- Page 337 and 338:
IssuesDo your children have access
- Page 339 and 340:
Issuesduring high floods?Is the Cha
- Page 341 and 342:
IssuesParticipants’ Opinion,comme
- Page 343 and 344:
Issuesduring construction ofthe bri
- Page 345 and 346:
IssuesParticipants’ Opinion,Comme
- Page 347 and 348:
IssuesParticipants’ Opinion,Comme
- Page 349 and 350:
Issuesvillage market, healthcenters
- Page 351 and 352:
CHAPTER 11:ECONOMICASSESSMENT
- Page 353 and 354:
11 Economic Assessment11.1 Introduc
- Page 355 and 356:
11.3 Traffic Forecasts6. Traffic vo
- Page 357 and 358:
11.4 Project Benefits14. The quanti
- Page 359 and 360:
Incremental to ‘without bridge’
- Page 361 and 362:
Table of Contents12 Conclusions 12-
- Page 363 and 364:
6. An environmental enhancement fun
- Page 365 and 366:
Annex 1-1: Harmonized Safeguard Pol
- Page 367 and 368:
AspectOperationalFrameworkofWorld B
- Page 369 and 370:
AspectOperationalFrameworkofWorld B
- Page 371 and 372:
AspectOperationalFrameworkAlternati
- Page 373 and 374:
AspectOperationalFrameworkofWorld B
- Page 375 and 376:
AspectOperationalFrameworkofWorld B
- Page 377 and 378:
AspectOperationalFrameworkIndepende
- Page 379 and 380:
AspectOperationalFrameworkClimateCh
- Page 381 and 382:
Annex 1-2: Terms of Reference for t
- Page 383 and 384:
- Main bridge (about 5.6km long) an
- Page 385 and 386:
o Resettlement siteso Dredged mater
- Page 387 and 388:
discussion of impacts that have not
- Page 389 and 390:
45. BBA will be responsible to coor
- Page 391 and 392:
8.0 Reporting48. All reports shall
- Page 396 and 397:
Annex 4-1: Interaction Matrix showi
- Page 398 and 399:
Annex 4-1: Interaction Matrix showi
- Page 400 and 401:
Annex 4-2: Impact Assessment Matrix
- Page 402 and 403:
Annex 4-2: Impact Assessment Matrix
- Page 404 and 405:
Annex 4-2: Impact Assessment Matrix
- Page 406 and 407:
Annex 4-2: Impact Assessment Matrix
- Page 408 and 409:
Annex 4-2: Impact Assessment Matrix
- Page 410 and 411:
Annex 4-2: Impact Assessment Matrix
- Page 412 and 413:
Annex 4-2: Impact Assessment Matrix
- Page 414 and 415:
Annex 4-2: Impact Assessment Matrix
- Page 416 and 417:
Annex 4-2: Impact Assessment Matrix
- Page 418 and 419:
Annex 4-3: Scoring of Environmental
- Page 420 and 421:
Annex 8-1Annex 8-1: Environmental C
- Page 422 and 423:
Annex 8-1recycling, treatment or di
- Page 424 and 425:
Annex 8-1Project Activity/Impact So
- Page 426 and 427:
Annex 8-1ECP 4: Drainage Management
- Page 428 and 429:
Annex 8-1ECP 6: Erosion and Sedimen
- Page 430 and 431:
Annex 8-1ECP 9: Borrow Areas Develo
- Page 432 and 433:
Annex 8-1Project Activity/Impact So
- Page 434 and 435:
Annex 8-1Project Activity/Impact So
- Page 436 and 437:
Annex 8-1Project Activity/Impact So
- Page 438 and 439:
Annex 8-1Project Activity/Impact So
- Page 440 and 441:
Annex 8-1Project Activity/Impact So
- Page 442 and 443:
Annex 8-1Project Activity/ Environm
- Page 444 and 445:
Annex 8-1Project Activity/Impact So
- Page 446 and 447:
Annex 8-2Annex 8-2: Project Entitle
- Page 448 and 449:
Annex 8-2Implementation Issues:1. J
- Page 450 and 451:
Annex 8-2Loss Item 8: LOSS OF STAND
- Page 452 and 453:
Annex 8-2Loss Item 12: LOSS OF INCO
- Page 454 and 455:
Annex 8-3Annex 8-3: Emergency Respo
- Page 456 and 457:
Annex 8-3Figure A8.2-1: ERT Managem
- Page 458 and 459:
Annex 8-3Equipment Quantity Unit Co
- Page 460 and 461:
Annex 8-3Bangladesh Army and Police
- Page 462 and 463:
Annex 8-3On-Site Management of the
- Page 464 and 465:
Annex 8-3Emergency Event Probabilit
- Page 466 and 467:
Annex 8-3Emergency Event Probabilit
- Page 468 and 469:
Annex 8-3VRecoveryA. Recovery Manag
- Page 470 and 471:
Annex 9-1: Roles and Responsibiliti
- Page 472 and 473:
Annex 9-2: Environmental Management
- Page 474 and 475:
Annex 9 3: TOR for Environmental Sp
- Page 476 and 477:
C. International Consultants1. Unit
- Page 478 and 479:
e exclusively engaged in the projec
- Page 480 and 481:
Annex 9- 4: Sample Memorandum of Un
- Page 482 and 483:
Annex 9-5: Outline Terms of Referen
- Page 484 and 485:
9. Based on the above scope of work
- Page 486 and 487:
Annex 9 6: Framework for the Establ
- Page 488 and 489:
indirectly influenced by the projec
- Page 490 and 491:
10. A series of training programs a
- Page 492 and 493:
Annex 9-6: Consultancy Services for
- Page 494 and 495:
Procedure for identification of leg
- Page 496 and 497:
Sl Activities/Month 1 2 3 4 5 6 7 8
- Page 498 and 499:
Annex 10-1List of Stakeholders Invi
- Page 500 and 501:
Annex 10-2Padma Multipurpose Bridge
- Page 502 and 503:
Annex 10-2Approach Road: Current Sc
- Page 504 and 505:
Annex 10-2Environmental Impacts: RS
- Page 506 and 507:
Annex 10-2Affected HH and Populatio
- Page 508 and 509:
Annex 10-2RTW LayoutsEnvironmental
- Page 510 and 511:
Annex 10-2Construction Yard-2Enviro
- Page 512 and 513:
Annex 10-213
- Page 514 and 515:
Annex 10-3Comment Sheet for Public
- Page 516 and 517:
Annex 10-4: Newspaper Advertisement
- Page 518 and 519:
Annex 10-4
- Page 520 and 521:
Annex 10-4
- Page 522 and 523:
Annex 10-4
- Page 524 and 525:
Annex 10-5List of Experts Consulted
- Page 526 and 527:
Annex 10-6: List of Participants-FG
- Page 528 and 529:
Annex 10-6
- Page 530 and 531:
Annex 10-6
- Page 532 and 533:
Annex 10-6Sl. Name & Address Addres
- Page 534 and 535:
Annex 10-6
- Page 536 and 537:
Annex 10-6
- Page 538 and 539:
Annex 10-6
- Page 540 and 541:
Annex 10-6Sl. Name Address Professi
- Page 542 and 543:
Annex 10-6Padma Multipurpose Bridge
- Page 544 and 545:
Annex 10-6Padma Multipurpose Bridge
- Page 546 and 547:
Annex 10-6Padma Multipurpose Bridge
- Page 548 and 549:
Annex 10-6Padma Multipurpose Bridge
- Page 550:
FGD AT CHARLANDList of Participants
- Page 553 and 554:
Annex 10-7Padma Multipurpose Bridge
- Page 555 and 556:
Annex 10-7
- Page 557 and 558:
Annex 10-7
- Page 559 and 560:
Annex 10-7
- Page 561 and 562:
Annex 10-7Sl Name Village/Professio
- Page 563 and 564:
Annex 10-7
- Page 565 and 566:
Annex 10-7
- Page 567 and 568:
Annex 10-7
- Page 569 and 570:
Annex 10-7
- Page 571 and 572:
Annex 10-755 Md. Iqbal Hossain Busi
- Page 573 and 574:
Annex 10-7
- Page 575 and 576:
Annex 10-7
- Page 577 and 578:
Annex 10-7
- Page 579 and 580:
Annex 10-7
- Page 581 and 582:
Annex 10-7
- Page 583 and 584:
Annex 10-7Time and Date: 11:30 - 14
- Page 585 and 586:
Annex 10-7Time and Date: 11:30 - 14
- Page 587 and 588:
Annex 10-7
- Page 589 and 590:
Annex 10-7
- Page 591 and 592:
Annex 10-7List of ParticipantsPadma
- Page 593 and 594:
Annex 10-7
- Page 595 and 596:
Annex 10-7
- Page 597 and 598:
Annex 10-7
- Page 599 and 600:
Annex 10-7Time and Date: 11:00 - 14
- Page 601 and 602:
Annex 10-7Time and Date: 11:00 - 14
- Page 603 and 604:
Annex 10-7
- Page 605 and 606:
Annex 10-7
- Page 607 and 608:
Annex 10-7List of ParticipantsPadma
- Page 609 and 610:
Annex 10-7List of ParticipantsPadma
- Page 611 and 612:
Annex 10-7
- Page 613 and 614:
Annex 10-7List of ParticipantsPadma
- Page 615 and 616:
Annex 10-8: Public Consultation New