Amara Raja Batteries (AMARAJ) - ICICI Direct
Amara Raja Batteries (AMARAJ) - ICICI Direct
Amara Raja Batteries (AMARAJ) - ICICI Direct
You also want an ePaper? Increase the reach of your titles
YUMPU automatically turns print PDFs into web optimized ePapers that Google loves.
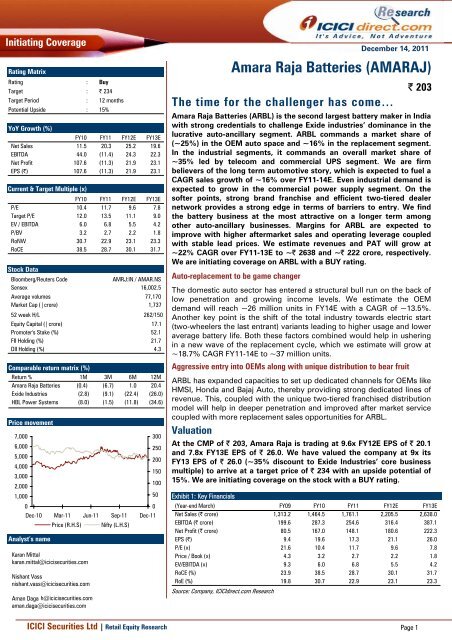
Initiating CoverageRating MatrixRating : BuyTarget : | 234Target Period : 12 monthsPotential Upside : 15%YoY Growth (%)FY10 FY11 FY12E FY13ENet Sales 11.5 20.3 25.2 19.6EBITDA 44.0 (11.4) 24.3 22.3Net Profit 107.6 (11.3) 21.9 23.1EPS (|) 107.6 (11.3) 21.9 23.1Current & Target Multiple (x)FY10 FY11 FY12E FY13EP/E 10.4 11.7 9.6 7.8Target P/E 12.0 13.5 11.1 9.0EV / EBITDA 6.0 6.8 5.5 4.2P/BV 3.2 2.7 2.2 1.8RoNW 30.7 22.9 23.1 23.3RoCE 38.5 28.7 30.1 31.7Stock DataBloomberg/Reuters CodeAMRJ:IN / AMAR.NSSensex 16,002.5Average volumes 77,170Market Cap (| crore) 1,73752 week H/L 262/150Equity Capital (| crore) 17.1Promoter's Stake (%) 52.1FII Holding (%) 21.7DII Holding (%) 4.3Comparable return matrix (%)Return % 1M 3M 6M 12M<strong>Amara</strong> <strong>Raja</strong> <strong>Batteries</strong> (0.4) (6.7) 1.0 20.4Exide Industries (2.8) (9.1) (22.4) (26.0)HBL Power Systems (8.0) (1.5) (11.8) (34.6)Price movement7,0006,0005,0004,0003,0002,0001,0000Dec-10Analyst’s nameMar-11Price (R.H.S)Karan Mittalkaran.mittal@icicisecurities.comJun-11Nishant Vassnishant.vass@icicisecurities.comAman Daga h@icicisecurities.comaman.daga@icicisecurities.comSep-11Nifty (L.H.S)300250200150100500Dec-11<strong>Amara</strong> <strong>Raja</strong> <strong>Batteries</strong> (<strong>AMARAJ</strong>)The time for the challenger has come…<strong>Amara</strong> <strong>Raja</strong> <strong>Batteries</strong> (ARBL) is the second largest battery maker in Indiawith strong credentials to challenge Exide industries’ dominance in thelucrative auto-ancillary segment. ARBL commands a market share of(~25%) in the OEM auto space and ~16% in the replacement segment.In the industrial segments, it commands an overall market share of~35% led by telecom and commercial UPS segment. We are firmbelievers of the long term automotive story, which is expected to fuel aCAGR sales growth of ~16% over FY11-14E. Even industrial demand isexpected to grow in the commercial power supply segment. On thesofter points, strong brand franchise and efficient two-tiered dealernetwork provides a strong edge in terms of barriers to entry. We findthe battery business at the most attractive on a longer term amongother auto-ancillary businesses. Margins for ARBL are expected toimprove with higher aftermarket sales and operating leverage coupledwith stable lead prices. We estimate revenues and PAT will grow at~22% CAGR over FY11-13E to ~| 2638 and ~| 222 crore, respectively.We are initiating coverage on ARBL with a BUY rating.Auto-replacement to be game changerDecember 14, 2011| 203The domestic auto sector has entered a structural bull run on the back oflow penetration and growing income levels. We estimate the OEMdemand will reach ~26 million units in FY14E with a CAGR of ~13.5%.Another key point is the shift of the total industry towards electric start(two-wheelers the last entrant) variants leading to higher usage and loweraverage battery life. Both these factors combined would help in usheringin a new wave of the replacement cycle, which we estimate will grow at~18.7% CAGR FY11-14E to ~37 million units.Aggressive entry into OEMs along with unique distribution to bear fruitARBL has expanded capacities to set up dedicated channels for OEMs likeHMSI, Honda and Bajaj Auto, thereby providing strong dedicated lines ofrevenue. This, coupled with the unique two-tiered franchised distributionmodel will help in deeper penetration and improved after market servicecoupled with more replacement sales opportunities for ARBL.ValuationAt the CMP of | 203, <strong>Amara</strong> <strong>Raja</strong> is trading at 9.6x FY12E EPS of | 20.1and 7.8x FY13E EPS of | 26.0. We have valued the company at 9x itsFY13 EPS of | 26.0 (~35% discount to Exide Industries’ core businessmultiple) to arrive at a target price of | 234 with an upside potential of15%. We are initiating coverage on the stock with a BUY rating.Exhibit 1: Key Financials(Year-end March) FY09 FY10 FY11 FY12E FY13ENet Sales (| crore) 1,313.2 1,464.5 1,761.1 2,205.5 2,638.0EBITDA (| crore) 199.6 287.3 254.6 316.4 387.1Net Profit (| crore) 80.5 167.0 148.1 180.6 222.3EPS (|) 9.4 19.6 17.3 21.1 26.0P/E (x) 21.6 10.4 11.7 9.6 7.8Price / Book (x) 4.3 3.2 2.7 2.2 1.8EV/EBITDA (x) 9.3 6.0 6.8 5.5 4.2RoCE (%) 23.9 38.5 28.7 30.1 31.7RoE (%) 19.8 30.7 22.9 23.1 23.3Source: Company, <strong>ICICI</strong>direct.com Research<strong>ICICI</strong> Securities Ltd | Retail Equity Research Page 1
Structure & outlook of Indian automotive battery industryThe domestic lead acid storage battery market is estimated to be worth~| 13,000 crore. The automotive battery segment constitutes 63%whereas the industrial segment occupies 37% of the total market. Thebranded battery segment is ~56% of the total automotive battery marketwith Exide and <strong>Amara</strong> <strong>Raja</strong> dominating the branded space.Exhibit 6: Domestic lead acid battery marketDomestic lead acid storage batterymarket (| 13000 crore)Automotive battery business(~63 % at | 8190 crore)Industrial battery business (~37% at | 4810 crore)Branded battery(~58% at | 4750 crore)Unbranded battery(~42 % at | 3440 crore)Source: Company annual report, <strong>ICICI</strong>direct.com ResearchWe estimate that overall automotive demand will increase at a CAGR of~16.4% over FY11-14E to touch ~63 million units. The OEM demand isexpected to touch ~26 million units while replacement estimates willtouch ~37 million units by FY14E. We expect domestic auto sales toremain structurally robust and witness ~13.5% CAGR growth duringFY11-14E. However, near term headwinds have made us cautious andfactor in the lower end of our projections leaving room for upside risks toour estimates. Thus, in terms of utilisations, the industry could be nearpeak capacity usage by ~FY14E providing additional operational leverstowards earning growth.Exhibit 7: Automotive led industry wide demand scenario & growth estimatesReplacement demandCAGR (14E-11)Comments(mn units) FY09 FY10 FY11 FY12E FY13E FY14EThe replacement cycle has been estimated considering threePassenger vehicles 2 3 3 4 5 6 19.2% replacement cycles for each segment each year with time gapsCommercial vehicles 1 1 1 1 1 2 16.4% of ~3 years, 6 yr, 8 years and 10 years, respectively. This is inThree wheelers 1 1 1 1 1 2 16.9% conjunction with varied degree of conversions to replacementTwo wheelers 12 15 17 20 21 28 18.8%sales in each of these cylesTotal* 15 20 22 26 29 37 18.7%OEM demandIndustry capacity outlook(mn units) Major participants FY12E FY13E FY14EPassenger vehicles 2 2 3 3 4 4 13.0% Exide 20.3 23.1 25.4Commercial vehicles 0 1 1 1 1 1 19.0% <strong>Amara</strong> <strong>Raja</strong> 9.0 10.6 11.7Three wheelers 0 1 1 1 1 1 14.3% Others 3.3 3.7 4.1Two wheelers 8 11 13 16 18 19 13.3% Unorganised 26.6 27.1 27.5Total 11 14 18 21 24 26 13.5% Total industry capacity est. 59.2 64.6 68.7Overall auto demand 26 34 40 47 53 63 16.4% Expected utilisation levels 79% 81% 92%Source: Company, <strong>ICICI</strong>direct.com Research *replacement demand has been estimated through a multiple replacement market cycles of varying time lengths for a period of 10 years<strong>ICICI</strong> Securities Ltd | Retail Equity Research Page 4
The auto industry has exhibited robust growth acrosssegments over the last five years even when sales werehit by a global slowdown in 2008-09. This phenomenalgrowth is expected to translate into strong replacementdemandExhibit 12: Automobile production CAGR for last five years2 Wheeler12.0Tractor10.8M&HCV9.4LCV18.93 Wheeler13.0Utility Vehicle15.2Cars18.60 2 4 6 8 (%) 10 12 14 16 18 20Source: Company, <strong>ICICI</strong>direct.com ResearchStronger economic activity, higher disposable incomesand easy financing have led to a strong increase in theregistered vehicle base, which augurs well forreplacement marketExhibit 13: Increasing base of registered vehicles fuelling strong replacement battery demand17.514.314.013.011.910.910.010.59.08.06.77.37.0(crore vehicles)3.50.0FY03FY04FY05FY06FY07FY08EFY09EFY10EFY11ESource: All India Federation of Motor Vehicles Department,, <strong>ICICI</strong>direct.com Research, Company Annual reportExhibit 14: Automobile domestic sales trend (in million units)The overall sales volumes remained flattish during theglobal slowdown in FY09. However, sales volumes havegot ramped up in the last two years across segments.The PV segment grew at an exceptional 27.5% CAGRover FY09-11 while two wheeler sales grew at 25. 9%CAGR over FY09-11FY11FY10FY09FY08FY0725.219.515.515.513.84.7 4.9 3.84.0 3.6 3.55.34.4 6.85.374.472.578.793.7117.9FY0611.43.53.670.50.0 20.0 40.0 60.0 80.0 100.0 120.0 140.0 160.0Passenger Vehicles Commercial Vehicles Three Wheelers Two WheelersSource: Company, <strong>ICICI</strong>direct.com Research<strong>ICICI</strong> Securities Ltd | Retail Equity Research Page 7
Shortening of replacement cycle to benefit industryAs mentioned earlier, the strong OEM demand is expected to providestrong replacement sales. However, we believe these sales could yetbecome further buoyant as the average lifespan of batteries come down.This belief grows from the fact that the share of electric start vehicles inthe two-wheelers segment has significantly grown from FY06-07 to ~80%of the market at present. This has led to higher usage of the installed setof batteries, thus reducing their usable lifespan. This resulted indevelopment of higher capacity batteries yielding higher realisation.Moreover, as the battery replacement decision cannot be delayed, theshortening of battery lifespan is inevitable.We expect this ‘electric start based two wheelers’ to be a key trigger forthe replacement market as the growth in overall sales marked a shift inthe last ~two years. We believe, on an average, a three year time cyclewould come into place for vehicle replacements that is estimated tocumulatively provide an automotive replacement of ~65-70 million unitstill FY14E at a growth of ~19% CAGR for FY14E-11.Exhibit 15: Two-wheelers constitute bulk of total registered vehicles in India*Passenger vehicles14 %Commercial vehicles6 %Two wheelers73 %Others7 %Source: All India Federation of Motor Vehicles Department, <strong>ICICI</strong>direct.com Research, as on Q4FY10As mentioned earlier, there exists a compulsory need to replace oldbatteries. Also, batteries serve more than just the basic purpose oflighting. The rise in use of electrical equipment like central locking, powerwindows, etc is more demanding on batteries. Moreover, due to highercranking frequency for an electric start version, the average life of twowheeler batteries should effectively reduce although the lifespan isdependant on the usage rate.Exhibit 16: Battery lifespan of vehiclesVehicle Category FY06 FY11Cars & Utility Vehicles 4-5 years 3-4 yearsCommercial Vehicles (LCV and MHCV) 3-4 years 3-3.5 yearsTwo Wheelers* 4-5 years 2-3 yearsTractors 3-3.5 years 2-3 yearsSource: Company, <strong>ICICI</strong>direct.com Research* Two Wheelers post FY07 witnessed electric start revolution, All thesenumbers are estimates on back of historical research, channel check.<strong>ICICI</strong> Securities Ltd | Retail Equity Research Page 8
Valuations lend credence to battery segment attractivenessOur liking for the battery business stems from strong business matricesand replacement market opportunities. It is also supported by attractiverelative valuations across other players in the auto component segment.We have elucidated a few technical aspects and analysed peers on thoseparameters assigning equal weights.Exhibit 17: Cross segmental valuation matrixMcap (| cr) PE (x) EV/EBITDA (x) Div yield (%) RoE (%) RoCE (%) EBITDA margin (%) Overall ratingBattery segmentExide Industries 9987 16.5 10.1 0.9 27 15 19.8 2<strong>Amara</strong> <strong>Raja</strong> <strong>Batteries</strong> Ltd 1737 8.8 5.3 1.4 29 14 16.4 1TyresApollo Tyres 3041 6.8 4.4 1.4 24 9 11.8 3MRF Tyres 2989 10.6 5.3 0.5 19 8 10.2 7Other segmentsMotherson Sumi 5847 17.8 11.3 1.5 33 10 11.9 4Bosch Ltd * 21420 21.3 17.0 0.7 21 14 15.5 6SKF India * 2992 14.3 7.8 1.9 19 13 11.9 5Bharat Forge 5888 29.1 12.5 0.9 9 3 14.3 8Source: Company, <strong>ICICI</strong>direct.com Research, Bloomberg, Historical multiples are on 3 year rolling basis * Calendar Year ending(CY)• It becomes obvious that the battery segment remains among thetop performers in terms of returns generation on a consistentbasis driven through strong operational metrics and reflectedthrough high return ratios• On valuation multiples like PE and EV/EBITDA, Exide enjoys apremium in comparison to its closest competitor ARBL owing toits strong leadership position. However, on cross segmentalterms, ARBL is clearly one of the most attractive bets• Post individual rankings on the parameters, the battery sectorremains the leader with top slots taken up by the two majors ofthe segment. This lends strength to our argument of looking atthe battery business with a higher degree of comfort if were to beinvesting in the automotive components industry<strong>ICICI</strong> Securities Ltd | Retail Equity Research Page 9
Investment RationaleWe expect that robust growth in the auto battery segment along withdemand sustenance from the industrial battery space to be the key driverfor ARBL’s revenues over the next few years. Also, structurally positiveoutlook for domestic auto demand and a stronger replacement demandaugurs well for <strong>Amara</strong> <strong>Raja</strong> in coming years. Capacity expansion andstrong OEM relationships will be the key drivers for business.Furthermore, a strong brand image in the minds of consumer andextensive dealer network will propel growth. The topline growth will beaided by the healthy demand for industrial batteries driven by significantpower shortfall in the country and increased investment in the railwaysector. Subsequently, we estimate ARBL’s revenues to post growth at22.4% CAGR over FY11-13E at | 2,638 crore. Sales volumes are expectedto rise to ~8 million units in the automotive space and 1376 MnAH unitsin the VRLA segment. In the overall sense we expect battery sales totouch ~12mn units by FY13E at ~20% CAGR FY13E-11.Exhibit 18: ARBL’s battery volume sales forecast(mn units)1412108622.05.028.86.524.78.110.024.211.918.63530252015(%)410250FY09 FY10 FY11 FY12E FY13ESales volume Growth0Source: Company, <strong>ICICI</strong>direct.com ResearchExhibit 19: Volume projections and assumptionsVolumes FY10 FY11 FY12E FY13EAutomotive segment (mn)OEM 0.9 2.2 4.0 4.9% growth (YoY) 132% 85% 21%Replacement 3.4 2.9 2.8 3.2% growth (YoY) -14% -4% 13%Industrial segment (MnAH)* 995 1126 1232 1376% growth (YoY) 13% 9% 12%Source: Company, <strong>ICICI</strong>direct.com Research * Industrial battery sales are in MnAH(million ampere hours)Strong player despite late entrance, smaller sizeThe company enjoys a healthy market share of ~25% in the four wheelerOEM space and ~30% in the replacement segment in the overallorganised market. In the two-wheeler organised aftermarket segment, thecompany has grasped an impressive ~18% market share in the organisedmarket within three years from launch. This is despite the lack of apresence as a supplier to two-wheeler OEMs. <strong>Amara</strong> <strong>Raja</strong> hassuccessfully carved a niche for itself in the aftermarket due to strongproduct performance and brand image in the mind of consumers.<strong>ICICI</strong> Securities Ltd | Retail Equity Research Page 10
Strong brand recall & wide distribution network key strengthsThe “Amaron” brand of battery is well established in various countriesacross the Indian sub-continent. It took various initiatives like the launchof batteries with a 60-month warranty (pro-rata) for the first time in India’sautomotive replacement market. <strong>Amara</strong> <strong>Raja</strong> ventured into the twowheeler battery space in May 2008 through its Amaron Pro Bike Ridebrand and was immensely successful in establishing a positive brandimage. ARBL’s brand equity can be gauged from the fact that without anyOEM presence in the two wheeler space the company still manages tohave ~18% market share in the organised replacement segment. Tomaintain and enhance its product image, ARBL maintains ad spends inline with industry standards.Exhibit 20: ARBL's advertisement spend ranks similar to market leaders*28211.31.41.21.0(| crore)1470.60.50.20.80.60.40.20Exide <strong>Amara</strong> <strong>Raja</strong> HBL Power Tudor0.0Advertisement expenses - LHS% of net sales - RHSSource: Company, <strong>ICICI</strong>direct.com Research *FY11 advertisement expenditureBrand recognition is one aspect. However, another necessary lever forsales remains a strong distribution network. ARBL has the second largestweb of touch points with 240 franchised distributors, about 18,000retailers in the Amaron format and 800 exclusive retail partners in thePowerZone format spread across semi-urban and rural locations incollaboration with 2,000 service hubs. The management plans to doublethis network in the next two years. The uniqueness in the operation lies inthe two-tier distribution network it follows unlike market leader Exide. Thecompany sells its brand like Amaron to end consumers through multibrand retail outlets (small repair shops), which do not have any dedicatedARBL specific sales. However, this help in providing deeper penetration.Exide, in comparison, considering its huge product positioning, follows adedicated model. We believe this two-tier format would help ARBL inentering newer markets in a “guerrilla” style without any dedicatednetwork. However, it also entails a risk of loss of end sales if the touchpoint interest were to turn rogue.<strong>ICICI</strong> Securities Ltd | Retail Equity Research Page 11
Exhibit 21: ARBL plans to double its existing dealer networkNo. of touch points4500040000350003000025000200001500010000500004000018000Expansion ~2xby FY13E36000Exide FY11 <strong>Amara</strong> <strong>Raja</strong> FY11 <strong>Amara</strong> <strong>Raja</strong> FY13ESource: Company, <strong>ICICI</strong>direct.com ResearchTechnological edge a key differentiatorOver the years, the company has a rich tradition of being a pioneer onseveral technological forefronts. ARBL has a highly sophisticated R&Dstructure in place, which churns out path-breaking products from time totime. This serves as a key differentiator between the organised andunorganised players. The automotive batteries business unit commencedoperations in 2001 with technology from Johnson Controls Inc, JV partnerand the world’s largest manufacturer of automotive batteries.Exhibit 22: Key technological landmarksYearEvents1996 Supplied first ever VRLA battery used by Indian Railways - 1100Ah for air-conditioning2007 Launched new look Amaron product range (PRO, FLO, GO, Black and Fresh)2008Introduced the innovative ‘Amaron Pro Bike Rider’ battery with VRLA technology for the two-wheelersegment (60 month warranty)Source: Company, <strong>ICICI</strong>direct.com ResearchCapacity ramp up to assist in tapping opportunitiesThe company has embarked on a structural shift in its strategy, which isevident from its capex plans. The focus is shifting from the industrialsegment to the robust automotive space. The industry wide slowdown inthe telecom segment has also been a key catalyst for the same. ARBL iscurrently undergoing large capacity additions in both the four-wheelerbattery plant (4.20 million units to 5.60 million units per annum) and thetwo-wheeler battery plant (3.60 million units to 5 million units per annum)that will be completed by Q2FY12. Before entering into a contract with anOEM, it must have a capacity of ~1 million set aside for the OEMs. Thecapacity expansion plan in the two-wheeler segment by ARBL reflects themanagement’s strategy of entering the OEM segment.We believe ARBL would be able to cater to the strong growthopportunities post expansion. The company is expected to expand itscapacity to ~11.7 million units by FY14E (refer Exhibit 7). This wouldequip ARBL to address the rising demand from both the OEM andreplacement markets simultaneously, assisting in garnering a highermarket share from OEMs who currently primarily source from Exide.<strong>ICICI</strong> Securities Ltd | Retail Equity Research Page 12
ARBL’s installed production capacity was raised by 16.5%in FY11 to 0.95 crore units and is expected to get rampedup to ~1.4 crore units by FY13EExhibit 23: Investment in manufacturing capacity to cater to higher domestic battery demand(Crore batteries)1.61.41.41.31.21.21.01.01.00.80.80.80.70.60.6 0.50.40.50.40.20.0FY08 FY09 FY10 FY11 FY12E FY13EInstalled CapacitySales VolumeSource: Company, <strong>ICICI</strong>direct.com ResearchARBL’s diverse client list in the Auto and Industrialsegment de-risks it to a certain extent from a slowdownin a particular sectorExhibit 24: ARBL has a diverse client base in auto OEM segmentPassenger vehicles Commercial vehicles Tractors IndustrialMaruti Suzuki Tata Motors Tafe BTILTata Motors Ashok Leyland Indus TowersHonda Mahindra & Mahindra DB PowerHyundai Swaraj Mazda VIOM networksGeneral MotorsTower VisionFord IndiaIndian RailwaysFiatEmersonHindustan MotorsNumericSource: Company, <strong>ICICI</strong>direct.com ResearchTelecom growth loses steam…Steady state growth possible…The industrial segment of <strong>Amara</strong> <strong>Raja</strong> witnessed robust sales in FY07-09due to a surge in demand from the telecom segment with increasingnumber of towers. ARBL is a preferred supplier to all major telecominfrastructure and service providers and enjoys ~45% market share in thetelecom segment, which contributes ~45% of its industrial revenue.However, the telecom segment saw a downturn from late FY10. Toovercome this large exposure in the telecom segment, ARBL diversifiedinto other allied industrials, auto. This resulted in a change in volume mixfor ARBL with total share of telecom reducing to 20% in FY11 from 40%in FY10. We believe the telecom segment may see a recovery as tenancyincreases with the 3G roll-out and with stable replacement cyclepersisting. However, it is improbable to expect this segment to growmulti-fold. We concur with the management’s long-term stable growthrates of ~6-8%.<strong>ICICI</strong> Securities Ltd | Retail Equity Research Page 13
Exhibit 25: Revenue break-up of industrial segmentRailway & Others17%Power38%Telecom45%Source: Company, <strong>ICICI</strong>direct.com ResearchARBL enjoys market leadership in the telecom segment(45%) with a strong presence in the UPS and railwayssegments at 35% and 40% market share, respectivelyExhibit 26: Market share enjoyed by ARBL in industrial battery segment60.04545.03540(%)30.015.00.0UPS Telecom RailwaysSource: Company, <strong>ICICI</strong>direct.com ResearchUPS segment to lead industrials as power sector continues to be challengedIndia still faces a substantial power deficit with several cities facing dailypower cuts of as long as 10-12 hours. The government has cut down itsambitious plans of new power capacity to 70 GW in the XIIth Plan even asit has fallen short by ~20% from the revised target of 62GW in the XIthPlan.India's power generation capacity - including state, central and privateutilities - is around ~ 180,000 MW while grid-connected captive capacitiesadd another ~25,000 MW. However, the situation in the powergeneration, transmission has improved with peak load deficit at ~10%YTD (refer Exhibit 26). Still, lately with uncertainty prevailing in thesouthern region it has again shot above 14%.The shortfall in the actual capacity addition amid higher planned targetsfor capacity expansion remains the main crux of the problem.Coal supply disruption, probable defaults and delays towards paymentsfrom the state electricity boards are some challenges plaguing the powersector. We believe this inconsistent supply would remain a key growthdriver for demand and would reflect in robust growth in the UPS/inverterssegment in coming years.We expect the growth in manufacturing, telecom, IT/ITeS, BFSI and retailsectors along with an increasing need for individual households to havecontinuous power backup solutions owing to the afore stated unreliabilityin supply. <strong>Amara</strong> <strong>Raja</strong> is the market leader in medium VRLA product<strong>ICICI</strong> Securities Ltd | Retail Equity Research Page 14
segment for commercial UPS applications and benefits from long-termsupplier relationship with national OEMs such as Emerson, Numeric,Delta, etc. It enjoys ~ 1/3 market share in the UPS segment with thepower backup segment constituting nearly 35% of ARBL’s industrialbattery segment’s revenues. We concur with the management’s view ofgrowth at ~12-15% CAGR for the next five years on a normalised basis.Exhibit 27: Aggressive power capacity addition targets in XI-XII Plans135100(GW)90456250700Upto XI PlanPlanned targetsXI-XII Plans TargetsActual / EstimatedSource: CEA, <strong>ICICI</strong>direct.com ResearchExhibit 28: Continued power shortage* driving demand for inverters20151011.8 12.211.2 11.7 12.313.816.611.913.314.09.8(%)50FY02FY03FY04FY05FY06FY07FY08Peak load deficit (%)FY09FY10FY11YTD FY12Source: CEA, <strong>ICICI</strong>direct.com Research, *measured by peak power deficitRailways to provide welcome growth opportunitiesIndian Railways provides a steady income flow to ARBL, constituting 15%of the company’s industrial battery segment’s revenues. The governmenthad announced its plans to acquire ~18,000 wagons during FY11-12E tooperate new trains (and modernise the existing network) and expansionof the metro network in several Indian cities. According to the EconomicSurvey of India, more than | 20,000 crore will be spent on building andexpanding the metro network in select Indian cities over FY10-12E.This presents significant growth opportunities for <strong>Amara</strong> <strong>Raja</strong> in thisspace. In Indian Railways, <strong>Amara</strong> <strong>Raja</strong>’s products are used in more than40% of two and three tier air-conditioned coaches. They also supporttrain lighting and signalling & telecom (S&T) power supply solutions.Going ahead, the railway mission 2020 presents several new revenuestreams for battery makers like ARBL. This would include powering thenon-air conditioning compartments, etc. to name a few.<strong>ICICI</strong> Securities Ltd | Retail Equity Research Page 15
Lead prices stability on longer term a key positive for investmentExhibit 29: Global lead outlookUsage:• The International Lead and Zinc Study Group expects the global usage of refined lead metal to increase by 6.1%to 10.15 million tonnes (MT) in 2011 and a further 4% to 10.56 MT in 2012• Despite being adversely affected by a slowdown in automotive sales and the widespread closure of batteryproduction facilities for environmental reasons, the end-demand for lead-acid batteries is still rising. Chinacontinues to lead global motor vehicles with sales rising 3% YoY to 10.5 mn units in the seven months fromJanuary to July 2011. However, it is anticipated that demand in the US will rise by 2.3% in 2011 and 2.2% in 2012.In Europe, the outlook is similarly subdued with usage predicted to be flat in 2012 after growth of 4.6% in 2011Supply:• Increases in global lead mine production of 7.8% in 2011 and 6.2% in 2012 will be mainly a consequence ofhigher output in China, India and Mexico and the opening of new mines in Tajikistan and Uzbekistan.This will lead toan increase in world refined lead metal production of 7.3% in 2011 to 10.34 MT and up to 10.65 MT in 2012World Refined Lead Metal Balance:• ILZSG expects the global refined lead market to remain in surplus for CY11E and CY12E. The extent of thesurplus in 2011 is forecast at 188,000 tonnes and in 2012 at 97,000 tonnesSource: ILZSG, <strong>ICICI</strong>direct.com ResearchThis international study provides us belief towards a strong supplysituation in terms of refined lead for CY11E and CY12E, which wouldoutstrip the demand requirement during the same period. We believelead prices have started to move downwards from H1FY12 and couldfollow the trend, going ahead. The stability in input prices would help thecomplete industry. However, non-dependence on in-house smeltingwould benefit ARBL incrementally more than Exide. With moredependence on LME/external lead sources, ARBL is more sensitive toglobal prices in comparison to Exide. Therefore, the delta in margins forARBL would be higher.Exhibit 30: Lead prices historical movement(|/Kg)14012010080604020125.9125.4 96.289.7 115.971.583.750.9 77.255.473.894.161.358.3113.4107.9107.990.1 116.5 112.1102.795.90Q1 Q2 Q3 Q4 Q1 Q2 Q3 Q4 Q1 Q2 Q3 Q4 Q1 Q2 Q3 Q4 Q1 Q2 Q3 Q4 Q1 Q2FY07 FY08 FY09 FY10 FY11 FY12*Lead pricesSource: Company, <strong>ICICI</strong>direct.com Research * FY12 numbers are on YTD basis<strong>ICICI</strong> Securities Ltd | Retail Equity Research Page 16
Risks and concernsVolatile lead prices an overhang on marginsLead and lead alloy prices that account for ~87% of the total cost havebeen highly volatile, of late. Unlike its peer Exide, <strong>Amara</strong> <strong>Raja</strong> does nothave access to lead supplies from in-house smelters, thereby making itsusceptible on the margin front. Lead prices surged (~17.2% YoY) puttingpressure on margins. However, in the longer term, prices are expected toremain stable. Along with this, crude oil volatility also affects the syntheticinput cost for making battery containers, thus impacting profits.Exhibit 31: Lead price movement and EBITDA margin trend($/tonne)300025002000150019452039238715.62574 253114.512.9244515.718161412108(%)100013.914.56500420Q1FY11 Q2FY11 Q3FY11 Q4FY11 Q1FY12 Q2FY12Avg. Lead costEBIDTA margins (RHS)0Source: Company, <strong>ICICI</strong>direct.com ResearchAs per our sensitivity analysis, the impact of lead price volatility isenormous considering no price pass through at the same instant. Wehave estimated a volatile 10-15% movement on lead prices on either side.Keeping other things constant, this could lead to an EPS volatility in therange of +/-71% in FY13E, vis-à-vis our base case.Exhibit 32: Lead price sensitivity to earningsLead price changeEBITDA margin (%) Margin change (%) EPS (|) EPS change (%)FY12E FY13E FY12E FY13E FY12E FY13E FY12E FY13E-15% 22.9 23.5 8.6 8.9 36.0 44.4 71.4 70.8-10% 20.5 20.5 6.2 5.9 31.9 38.2 51.9 46.9-5% 16.5 17.6 2.2 3.0 25.0 32.2 19.0 23.80% 14.3 14.6 - - 21.0 26.0 - -5% 11.1 11.7 -3.2 -2.9 15.6 19.9 -25.7 -23.510% 8.2 8.7 -6.1 -5.9 10.4 13.8 -50.5 -46.915% 5.0 5.8 -9.3 -8.8 4.8 7.7 -77.1 -70.4Source: Company, <strong>ICICI</strong>direct.com Research * These estimates are based on the assumption that there is no pass through of pricesOn the margins front also, the delta on either side always remains highwith a +/-10% change in lead prices potentially leading to a rise inmargins to up to ~24% and even falling to ~9% for FY13E with our basecase at ~15% for FY13E. Thus, in our view, though the lead price outlookis expected to be stable for FY13E considering the demand supplyscenario, any sharp rise on account of global uncertainty could leaveARBL’s financials vulnerable.<strong>ICICI</strong> Securities Ltd | Retail Equity Research Page 17
Sharp depreciation in rupeeA large chunk of <strong>Amara</strong> <strong>Raja</strong>’s lead requirement (~60%) is met throughimports from Korea and Australia while 20% is obtained from HindustanZinc and the rest 20% from local recycling smelters. The depreciation ofthe INR (|) is a cause for concern as ARBL remains a net importer of rawmaterials. However, the presence of pass through contracts provides thecompany the cushion of pass through for forex uncertainty.Exhibit 33: Rupee volatility remains a concern5452504846Unexpectedly sharp currencydepreciation53.5444244.540Jan-09Mar-09May-09Jul-09Sep-09Nov-09Jan-10Mar-10May-10Jul-10Sep-10Nov-10Jan-11Mar-11May-11Jul-11Sep-11Nov-11Source: Company, RBI, <strong>ICICI</strong>direct.com ResearchIn FY11, the average US$/INR rate was 45.6, a 3.9% appreciation from theaverage rate in FY10 at 47.4. In the current fiscal FY12 till date, theUS$/INR has been on an average at 46.7 but the currency has weakeneddrastically since August 2011 (refer Exhibit 28 above) touching an all-timelow of 53.5 in December 2011. The outlook on the same remains bleak asthe RBI is keen to leave price determination to market forces. Thus, withthe weak fiscal position, INR is expected to remain under pressure in thenear term.Large exposure to waning telecom segmentThe telecom industry has entered a slowdown phase after havingwitnessed phenomenal growth in FY07-10. With telecom companiesundertaking cost cutting measures to safeguard its revenues, the demandfor batteries from the telecom space is likely to witness a contraction.With the telecom segment contributing ~30% of <strong>Amara</strong> <strong>Raja</strong>’s revenues,the pricing pressure on telecom batteries could impact earnings.However, the management is actively looking at reducing exposure in thesegment and the proportion of revenues has come down to ~25% byFY13-14E.<strong>ICICI</strong> Securities Ltd | Retail Equity Research Page 18
FinancialsRevenues to rise at a 22.4% CAGR in FY11-13EWe expect ARBL’s revenues to grow at 22.4% CAGR during FY11-13E to |2,654 crore driven by sustained battery demand from the auto OEM andreplacement segments (due to large base of registered vehicles andARBL’s strong position in the organised market). Growth will also beboosted by the robust demand for industrial batteries. Further, ARBLbenefits from strong brand equity and distribution network (refer Exhibit19 and 20). In FY11, ARBL’s revenue growth was a healthy 19.6% YoY at |1,771 crore.Exhibit 34: CAGR of 22.4% in ARBL’s revenues over FY11-13E3,0002,6542,216(| crore)2,0001,1091,3211,4811,7711,0006060FY07 FY08 FY09 FY10 FY11 FY12E FY13ESource: Company, <strong>ICICI</strong>direct.com ResearchEBITDA margins to trend higherThe duopoly nature of the industry lends a substantial degree of pricingpower to <strong>Amara</strong> <strong>Raja</strong>. In the absence of in-house smelter facilitycompared to its peer Exide, <strong>Amara</strong> <strong>Raja</strong> witnessed a decline inEBITDA/battery in FY11 (down 29% YoY) due to high lead prices. Goingahead, we expect it to improve its EBITDA/battery at |315/ battery fromFY11 aided through an enriched product mix and higher replacementmarket sales.Exhibit 35: Costs and revenue metrics per batteryARBL’s EBITDA/battery has declined by ~29% in FY11owing to higher lead prices during the fiscal2,8002,3003972,6114442,262 2,180 2,218 2,214500400(|)1,8001,3001,7183151,423 1,4633181,526 1,478325(|)300800FY09 FY10 FY11 FY12E FY13ERevenue/battery RM Cost/battery EBITDA/battery200Source: Company, <strong>ICICI</strong>direct.com Research<strong>ICICI</strong> Securities Ltd | Retail Equity Research Page 19
The EBITDA margin grew over FY07-10 but higher leadprices took their toll on the margin in FY11 (down 517 bpsYoY)Exhibit 36: EBITDA margin comparison of Aman <strong>Raja</strong> with its peers(EBITDA %)23.42519.719.62016.5 16.5 16.216.114.514.415.818.61514.5 14.313.7 14.2 15.2107.611.217.814.611.25FY07 FY08 FY09 FY10 FY11 FY12E FY13EExide <strong>Amara</strong> <strong>Raja</strong> HBL PowerSource: Company, <strong>ICICI</strong>direct.com Research, Bloomberg estimate for HBLGiven the company’s inherent strengths, we believe that improvement ofmargins from the current level is a reasonable assumption. We expect thecompany to report EBITDA margin of 14.3% and 14.6% in FY12E andFY13E, respectively. Consequently, we estimate ARBL’s EBITDA to growat a 23.2% CAGR over FY11-13E to touch | 386.6 crore from | 254.6 crorein FY11.Profitability to sustainThe company is expected to register a bottomline growth of 22.5% CAGRover FY11-13E driven by higher demand for batteries and lead pricescooling off, going ahead. The company’s expansion plan and strategicshift towards a higher revenue mix from the auto segment is set to drivegrowth. The profitability fro ARBL is in direct cognisance with the strongoperating performance, we expect it to touch PAT of | 222 crore byFY13E.Exhibit 37: PAT expected to grow at a CAGR of 22.5% over FY11-13E25011.422212200150100507.9478.7 8.494801678.41481818.28.41086420FY07 FY08 FY09 FY10 FY11 FY12E FY13E0PATPAT margin (%) (RHS)Source: Company, <strong>ICICI</strong>direct.com Research<strong>ICICI</strong> Securities Ltd | Retail Equity Research Page 20
Return ratios to marginally improveReturn ratios are expected to remain healthy with rising profitability.Return ratios witnessed a decline in FY11 and are expected to remain atsimilar levels in FY12E primarily due to the significant investment to boostthe manufacturing capacity but are expected to improve going ahead inFY13E with increasing utilisations and higher profitability. The RoCE isexpected to reach 31.8% in FY13E with RoNW to clock 23.3% levels.Exhibit 38: ARBL expected to sustain high return ratios45.038.5(%)36.027.018.016.819.328.320.023.919.830.728.730.1 31.722.9 23.123.39.00.0FY07 FY08 FY09 FY10 FY11 FY12E FY13ERoCERoNWSource: Company, <strong>ICICI</strong>direct.com ResearchValuationsThe price earnings based methodology is used to valueARBL at | 234/ share with PE multiple of 9x on FY13EEPS of | 26.0. The multiple rationale has been derivedthrough analysis of historical discounts to market leaderExideExhibit 39: Peer ValuationCountry CMP (|) M.Cap (| cr)ARBL along with Exide are the two major players in the battery sector. Wefeel a PE methodology on relative terms is an effective valuation method.We have assigned 9x multiple to ARBL’s business, which is at a discountof ~35% to Exide (valued at 14x FY13E core business multiple). We haveanalysed the historical discount from FY06 (Refer Exhibit 40). Though theaverage discount for FY06-12 (YTD) is ~50%, we have witnessed an uptickin ARBL’s valuations. The market seems to have grown up to theprospect of strong business growth coupled with earnings growth closerto the market leader. Even on the return ratios front, ARBL has improvedits profile leading to further support towards higher valuation multiples.We, however, believe our 35% discount is justifiable considering thescale, brand and aftermarket reach that Exide enjoys. At the CMP of | 203,the stock is trading at 9.6x FY12E EPS of | 21.1 and 7.8x FY13E of | 26.0.We have arrived at our target price of | 234 with a 9x multiple on FY13EEPS of | 26.0. This discounts the stock attractively at 4.2x FY13EEV/EBITDA and 1.8x FY13E P/BV. We are initiating coverage on the stockwith a BUY rating implying an upside potential of 15% from currentlevels.PE (x) EV/EBITDA (x) P/B (x)Market Cap/Sales(x)FY11 FY12E FY13E FY11 FY12E FY13E FY11 FY12E FY13E FY11 FY12E FY13EExide Industries # India 117.5 9987.0 12.7 17.3 12.2 9.7 11.9 8.1 3.7 3.2 2.7 1.9 1.7 1.5<strong>Amara</strong> <strong>Raja</strong> <strong>Batteries</strong> Ltd India 203.4 1737.0 11.9 9.8 8.0 7.1 5.7 4.4 2.8 2.3 1.9 1.0 0.8 0.7HBL Power India 16.8 425.0 29.2 11.2 8.4 14.5 8.0 7.2 0.9 NA NA 0.4 0.4 0.3Exide Technologies* USA 2.8 21.6 15.5 9.5 3.4 6.5 4.0 3.8 2.1 0.5 0.3 0.30 0.07 0.07GS Yuasa Corp ** Japan 447.0 18486.8 19.4 15.0 11.9 9.6 7.6 5.9 2.1 1.6 1.4 0.8 0.6 0.6Source: Company, Reuters, <strong>ICICI</strong>direct.com Research *,**CMP in USD,Yen and Market Cap in Mn USD Mn Yen,, # Core business multiples<strong>ICICI</strong> Securities Ltd | Retail Equity Research Page 21
The historic average P/E discount is ~50%. In recenttimes, the gap, at present, has hovered at ~30% levelsdown from the H1FY12 average of ~47%. This canpartially be attributed to negative surprises on Exide’sfront as well as the consistent performance of ARBLExhibit 40: One-year forward P/E discount chart for ARBL vis-à-vis Exide80706050(%)403020100Mar-06Sep-06Mar-07Sep-07Mar-08Sep-08Mar-09Sep-09Mar-10Sep-10Mar-11Sep-11Current discountAvgerage 5-yr discountSource: Company, <strong>ICICI</strong>direct.com ResearchExhibit 41: ARBL share price vs. BSE Auto Index270120002502301000021019080001701506000Nov-10Dec-10Jan-11Feb-11Mar-11Apr-11May-11Jun-11Jul-11Aug-11Sep-11Oct-11Nov-11Dec-11<strong>Amara</strong> <strong>Raja</strong> (LHS)BSE Auto Index (RHS)Source: Bloomberg, <strong>ICICI</strong>direct.com ResearchThe ARBL vs. BSE Sensex multiple ratio has witnessed asignificant improvement since FY08 with discount fallingfrom ~70% to ~30%Exhibit 42: One year forward PE - ARBL vs. BSE Sensex302520TheriseinAMRj'smultiplehasbeenprogressivewithitsbusiness performance corraborated through stock priceoutperformance88786858(x)151050483828188Mar-06Jul-06Nov-06Mar-07Jul-07Nov-07Mar-08Jul-08Nov-08Mar-09Jul-09Nov-09Mar-10Jul-10Nov-10Mar-11Jul-11Nov-11(%)Source: Company, <strong>ICICI</strong>direct.com Research<strong>Amara</strong> <strong>Raja</strong> Sensex Discount ratio<strong>ICICI</strong> Securities Ltd | Retail Equity Research Page 22
Table and ratiosProfit and loss statement(| Crore)(Year-end March) FY09 FY10 FY11 FY12E FY13ENet Sales 1,313.2 1,464.5 1,761.1 2,205.5 2,638.0Growth (%) 21.2 11.5 20.3 25.2 19.6Total Operating Expenditure 1,313.2 1,464.5 1,761.1 2,214.1 2,653.9EBITDA 199.6 287.3 254.6 316.4 387.1Growth (%) 29.2 44.0 (11.4) 24.3 22.3Interest 18.2 6.8 1.5 2.1 1.0PBDT 189.4 297.6 262.7 316.6 386.1Depreciation 34.6 42.9 41.7 47.9 54.3Less: Exceptional Items 32.2 - - - -PBT 122.7 254.6 221.0 268.7 331.7Growth (%) (16.0) 107.6 (13.2) 21.6 23.4Total Tax 42.2 87.6 72.9 88.1 109.5PAT before MI 80.5 167.0 148.1 180.6 222.3PAT 80.5 167.0 148.1 180.6 222.3Growth (%) (14.9) 107.6 (11.3) 21.9 23.1EPS (|) 9.4 19.6 17.3 21.1 26.0Balance sheet(| Crore)(Year-end March) FY09 FY10 FY11 FY12E FY13EEquity Capital 17.1 17.1 17.1 17.1 17.1Reserve and Surplus 388.5 526.6 628.9 764.6 937.1Total Shareholders funds 405.6 543.7 646.0 781.7 954.2Secured Loan 207.8 27.3 24.0 19.0 14.0Unsecured Loan 78.0 63.9 71.0 91.0 81.0Deferred Tax Liability 18.3 21.6 20.5 18.5 20.5Sources of Funds 709.7 656.5 761.5 910.3 1,069.7Total Gross Block 427.1 488.9 536.4 646.4 696.4Less Accumulated Depreciation 145.7 185.3 223.1 270.5 324.4Net Block 281.3 303.6 313.3 375.8 372.0Net Intangible Assets - 2.1 1.8 1.3 0.9Liquid Investments 47.1 16.1 16.1 16.1 46.1Inventory 160.8 217.6 284.7 319.6 374.3Debtors 207.8 242.3 305.7 382.8 457.9Loans and Advances 87.0 108.7 111.3 164.2 165.3Cash 109.9 85.2 77.8 80.9 170.4Total Current Assets 565.6 653.7 779.4 947.5 1,167.8Total Current Liabilities 184.3 319.1 349.1 430.5 517.0Net Current Assets 381.3 334.7 430.3 517.0 650.8Application of funds 709.7 656.5 761.5 910.3 1,069.7<strong>ICICI</strong> Securities Ltd | Retail Equity Research Page 23
Cash flow statement(| Crore)(Year-end March) FY09 FY10 FY11 FY12E FY13EProfit after Tax 80.5 167.0 148.1 180.6 222.3Depreciation 34.6 42.9 41.7 47.9 54.3Cash Flow before working capital changes 115.0 210.0 189.8 228.5 276.6Net Increase in Current Assets 90.7 (112.9) (133.1) (164.9) (130.9)Net Increase in Current Liabilities (17.8) 134.8 30.0 81.4 86.5Net cash flow from operating activities 188.0 231.9 86.8 145.0 232.2(Purchase)/Sale of Fixed Assets (127.0) (67.4) (51.1) (110.0) (50.0)Net Cash flow from Investing Activities (156.6) (33.0) (52.2) (112.0) (78.0)Inc / (Dec) in Equity Capital 5.7 - - - -Inc / (Dec) in Loan Funds (18.8) (180.5) (3.3) (5.0) (5.0)Inc / (Dec) in Loan Funds (11.6) (14.1) 7.1 20.0 (10.0)Net Cash flow from Financing Activities (38.4) (223.7) (41.9) (29.8) (64.8)Net Cash flow (7.0) (24.7) (7.4) 3.2 89.4Cash and Cash Equivalent at the beginning 116.9 109.9 85.2 77.8 80.9Closing Cash/ Cash Equivalent 109.9 85.2 77.8 80.9 170.4Ratios(Year-end March) FY09 FY10 FY11 FY12E FY13EPer Share DataEPS 9.4 19.6 17.3 21.1 26.0Cash EPS 13.5 24.6 22.2 26.8 32.4BV 47.5 63.7 75.6 91.5 111.7Operating profit per share 23.4 33.6 29.8 37.1 45.3Operating RatiosEBITDA / Total Operating Income 15.2 19.6 14.5 14.3 14.6PAT / Total Operating Income 6.1 11.4 8.4 8.2 8.4Return RatiosRoE 19.8 30.7 22.9 23.1 23.3RoCE 23.9 38.5 28.7 30.1 31.7RoIC 18.1 28.1 20.9 21.8 24.8Valuation RatiosEV / EBITDA 9.3 6.0 6.8 5.5 4.2P/E 21.6 10.4 11.7 9.6 7.8EV / Net Sales 1.4 1.2 1.0 0.8 0.6Sales / Equity 3.2 2.7 2.7 2.8 2.8Market Cap / Sales 1.3 1.2 1.0 0.8 0.7Price to Book Value 4.3 3.2 2.7 2.2 1.8Turnover RatiosAsset turnover 1.9 2.1 2.5 2.6 2.7Debtors Turnover Ratio 6.3 6.0 5.8 5.8 5.8Creditors Turnover Ratio 14.0 10.6 11.7 11.7 11.7Solvency RatiosDebt / Equity 0.7 0.2 0.1 0.1 0.1Current Ratio 3.1 2.0 2.2 2.2 2.3Quick Ratio 2.5 1.8 2.0 2.0 1.9<strong>ICICI</strong> Securities Ltd | Retail Equity Research Page 24
RATING RATIONALE<strong>ICICI</strong>direct.com endeavours to provide objective opinions and recommendations. <strong>ICICI</strong>direct.com assignsratings to its stocks according to their notional target price vs. current market price and then categorises themas Strong Buy, Buy, Hold and Sell. The performance horizon is two years unless specified and the notionaltarget price is defined as the analysts' valuation for a stock.Strong Buy: >15%/20% for large caps / midcaps, respectively, with high conviction;Buy: > 10%/ 15% for large caps / midcaps, respectively;Hold: Up to +/-10%;Sell: -10% or more;Pankaj Pandey Head – Research pankaj.pandey@icicisecurities.com<strong>ICICI</strong>direct.com Research Desk,<strong>ICICI</strong> Securities Limited,7 th Floor, Akruti Centre Point,MIDC Main Road, Marol Naka,Andheri (East)Mumbai – 400 093research@icicidirect.comANALYST CERTIFICATIONWe /I, Karan Mittal MBA Nishant Vass MBA(FINANCE) Aman Daga MBA research analysts, authors and the names subscribed to this report, hereby certify that all of the views expressed in this researchreport accurately reflect our personal views about any and all of the subject issuer(s) or securities. We also certify that no part of our compensation was, is, or will be directly or indirectly related to thespecific recommendation(s) or view(s) in this report. Analysts aren't registered as research analysts by FINRA and might not be an associated person of the <strong>ICICI</strong> Securities Inc.Disclosures:<strong>ICICI</strong> Securities Limited (<strong>ICICI</strong> Securities) and its affiliates are a full-service, integrated investment banking, investment management and brokerage and financing group. We along with affiliates are leadingunderwriter of securities and participate in virtually all securities trading markets in India. We and our affiliates have investment banking and other business relationship with a significant percentage ofcompanies covered by our Investment Research Department. Our research professionals provide important input into our investment banking and other business selection processes. <strong>ICICI</strong> Securitiesgenerally prohibits its analysts, persons reporting to analysts and their dependent family members from maintaining a financial interest in the securities or derivatives of any companies that the analystscover.The information and opinions in this report have been prepared by <strong>ICICI</strong> Securities and are subject to change without any notice. The report and information contained herein is strictly confidential andmeant solely for the selected recipient and may not be altered in any way, transmitted to, copied or distributed, in part or in whole, to any other person or to the media or reproduced in any form, withoutprior written consent of <strong>ICICI</strong> Securities. While we would endeavour to update the information herein on reasonable basis, <strong>ICICI</strong> Securities, its subsidiaries and associated companies, their directors andemployees (“<strong>ICICI</strong> Securities and affiliates”) are under no obligation to update or keep the information current. Also, there may be regulatory, compliance or other reasons that may prevent <strong>ICICI</strong> Securitiesfrom doing so. Non-rated securities indicate that rating on a particular security has been suspended temporarily and such suspension is in compliance with applicable regulations and/or <strong>ICICI</strong> Securitiespolicies, in circumstances where <strong>ICICI</strong> Securities is acting in an advisory capacity to this company, or in certain other circumstances.This report is based on information obtained from public sources and sources believed to be reliable, but no independent verification has been made nor is its accuracy or completeness guaranteed. Thisreport and information herein is solely for informational purpose and may not be used or considered as an offer document or solicitation of offer to buy or sell or subscribe for securities or other financialinstruments. Though disseminated to all the customers simultaneously, not all customers may receive this report at the same time. <strong>ICICI</strong> Securities will not treat recipients as customers by virtue of theirreceiving this report. Nothing in this report constitutes investment, legal, accounting and tax advice or a representation that any investment or strategy is suitable or appropriate to your specificcircumstances. The securities discussed and opinions expressed in this report may not be suitable for all investors, who must make their own investment decisions, based on their own investmentobjectives, financial positions and needs of specific recipient. This may not be taken in substitution for the exercise of independent judgment by any recipient. The recipient should independently evaluatethe investment risks. The value and return of investment may vary because of changes in interest rates, foreign exchange rates or any other reason. <strong>ICICI</strong> Securities and affiliates accept no liabilities for anyloss or damage of any kind arising out of the use of this report. Past performance is not necessarily a guide to future performance. Investors are advised to see Risk Disclosure Document to understand therisks associated before investing in the securities markets. Actual results may differ materially from those set forth in projections. Forward-looking statements are not predictions and may be subject tochange without notice.<strong>ICICI</strong> Securities and its affiliates might have managed or co-managed a public offering for the subject company in the preceding twelve months. <strong>ICICI</strong> Securities and affiliates might have receivedcompensation from the companies mentioned in the report during the period preceding twelve months from the date of this report for services in respect of public offerings, corporate finance, investmentbanking or other advisory services in a merger or specific transaction. <strong>ICICI</strong> Securities and affiliates expect to receive compensation from the companies mentioned in the report within a period of threemonths following the date of publication of the research report for services in respect of public offerings, corporate finance, investment banking or other advisory services in a merger or specifictransaction. It is confirmed that Karan Mittal MBA Nishant Vass MBA(FINANCE) Aman Daga MBA research analysts and the authors of this report have not received any compensation from the companiesmentioned in the report in the preceding twelve months. Our research professionals are paid in part based on the profitability of <strong>ICICI</strong> Securities, which include earnings from Investment Banking and otherbusiness.<strong>ICICI</strong> Securities or its subsidiaries collectively do not own 1% or more of the equity securities of the Company mentioned in the report as of the last day of the month preceding the publication of theresearch report.It is confirmed that Karan Mittal MBA Nishant Vass MBA(FINANCE) Aman Daga MBA research analysts and the authors of this report or any of their family members does not serve as an officer, director oradvisory board member of the companies mentioned in the report.<strong>ICICI</strong> Securities may have issued other reports that are inconsistent with and reach different conclusion from the information presented in this report. <strong>ICICI</strong> Securities and affiliates may act upon or make useof information contained in the report prior to the publication thereof.This report is not directed or intended for distribution to, or use by, any person or entity who is a citizen or resident of or located in any locality, state, country or other jurisdiction, where such distribution,publication, availability or use would be contrary to law, regulation or which would subject <strong>ICICI</strong> Securities and affiliates to any registration or licensing requirement within such jurisdiction. The securitiesdescribed herein may or may not be eligible for sale in all jurisdictions or to certain category of investors. Persons in whose possession this document may come are required to inform themselves of andto observe such restriction.<strong>ICICI</strong> Securities Ltd | Retail Equity Research


