Surface cleaning from laser-induced cavitation bubbles
Surface cleaning from laser-induced cavitation bubbles
Surface cleaning from laser-induced cavitation bubbles

You also want an ePaper? Increase the reach of your titles
YUMPU automatically turns print PDFs into web optimized ePapers that Google loves.
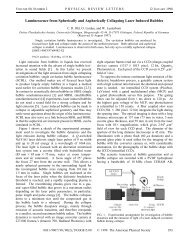
APPLIED PHYSICS LETTERS 89, 074102 2006<strong>Surface</strong> <strong>cleaning</strong> <strong>from</strong> <strong>laser</strong>-<strong>induced</strong> <strong>cavitation</strong> <strong>bubbles</strong>Claus-Dieter Ohl, a Manish Arora, Rory Dijkink, Vaibhav Janve, and Detlef LohseFaculty of Science, Physics of Fluids, University of Twente, 7500 AE Enschede, The NetherlandsReceived 26 April 2006; accepted 28 June 2006; published online 14 August 2006When <strong>bubbles</strong> expand and collapse close to boundaries, a shear flow is generated which is able toremove particles <strong>from</strong> the surface, thus locally <strong>cleaning</strong> it. Here the authors demonstrateexperimentally with microparticle tracking velocimetry that the strongest forcing of particles occursduring a very brief time interval of the bubble oscillation period. During this interval a jet flowimpacts and spreads radially along the surface, thus transporting the particles with it. © 2006American Institute of Physics. DOI: 10.1063/1.2337506The study of the flow <strong>induced</strong> <strong>from</strong> <strong>cavitation</strong> <strong>bubbles</strong>oscillating close to a surface is motivated by the ability of the<strong>bubbles</strong> to remove attached dirt particles, thus <strong>cleaning</strong> thesurface. An example of the <strong>cleaning</strong> ability of a bubble ispresented in Fig. 1. Here, the surface is covered with a thinlayer of grease Vaseline mixed with colored particles servingas dirt particles. The left image in Fig. 1a depicts thesurface before it is exposed to a single <strong>cavitation</strong> bubble.After the bubble oscillation has ceased, a disk shaped areawith a diameter of approximately 0.4 mm is cleared <strong>from</strong> thegrease-particle mixture, see center image in Fig. 1a. After asecond bubble has collapsed at the same location, thecleaned area is enlarged and most of the small grease islandshaving remained after the first bubble collapse are now alsoremoved right image of Fig. 1.Although <strong>cavitation</strong> bubble dynamics close to surfaces isstudied now for decades numerically 1 and experimentally, 2yet the flow along on the surface has not been investigated ingreater detail. In this letter the mechanism of acceleration ofparticles close to the surface is experimentally determined bycorrelating the bubble dynamics with the particle motion.The <strong>bubbles</strong> in the experiments are generated by focusingan intense <strong>laser</strong> pulse <strong>from</strong> a Q-switched neodymiumdopedyttrium aluminium garnet <strong>laser</strong> 1064 nm wavelengthwith 6 ns duration and 15 mJ <strong>laser</strong> energy with an aberrationminimized lens system <strong>from</strong> above into a water filledcuvette. A microscope slide built into the bottom of the cuvetteserves as the material surface.The bubble dynamics close to a boundary is recorded<strong>from</strong> the side with a high speed camera at a framing rate of112 500 frames/s resolution of 12864 pixels and selectedframes are depicted in Fig. 2a. The boundary is locatedat the bottom of each frame. We can classify the bubblemotion into four dynamical stages which are represented bythe individual rows of Fig. 2a. The four stages <strong>from</strong> top tobottom are bubble expansion, bubble collapse, jetting, andthe reexpansion of the bubble. Initially, the bubble expandswithin 100 s to its maximum diameter of 2 mm. Due to theproximity to the boundary the bubble flattens at the bottom.Thus it obtains a nonspherical shape at maximum expansion.During shrinkage the upper more curved part of the bubbledevelops a liquid jet flow 3,4 through the center of the bubbletowards the rigid boundary causing the mushroomlike shapeat time of 213 s in Fig. 2. This jet flow impacts betweena Electronic mail: c.d.ohl@utwente.nl204 and 213 s onto the boundary. The minimum volume ofthe bubble is reached around 216 s after bubble creation.The bubble then reexpands with a roughened surface and astructure consisting of micro<strong>bubbles</strong> pointing upwards. 5The jet flow inside the bubble originates <strong>from</strong> a flowfocusing mechanism. 3–10 In Fig. 2b the jet is visualizedwith diffuse stroboscopic illumination. The left frame depictsthe bubble at time of 204 s with the jet crossing through thecenter of the bubble. The jet impact on the boundary is photographedin the right frame of Fig. 2b. Here, the jet haspenetrated through the lower bubble wall and is surroundedby an annular ring, presumably a vapor and gas mixture. Thevelocity of the jet at impact is estimated <strong>from</strong> these twoframes to be approximately 40 m/s.The flow tangential and very close to the surface is studiedwith streak images <strong>from</strong> fluorescent particles 8 m indiameter, red fluorescent polymer microspheres, Cat. No.36-3, Duke Scientific Corp., Palo Alto, CA, USA, density of1.1910 3 kg/m 3 . Here, the particles are not embedded in agrease matrix but sediment freely onto the microscope slide.Therefore, they are injected gently into the liquid about aminute before the experiment to allow for their settling.The fluorescence is excited with a 50 W mercury lamp<strong>from</strong> below. Excitation and imaging of the particles are donewith a 5 microscope objective on an inverted microscopeAxiovert CF40, Zeiss GmbH, Göttingen, Germany. The excitationlight green is seperated <strong>from</strong> the fluorescent imagered with a dichroic mirror and a long pass filter. An additional<strong>laser</strong> line filter just below the microscope slide protectsthe microscope optics. The particle trajectories are recordedwith a sensitive camera Sensicam QE, PCO GmbH,Kelheim, Germany, 12801024 pixels. Therefore, the camerais opened for a variable time at specific moments of thebubble dynamics. Due to the low light level four neighboringpixels are summed up, thus reducing the optical resolution to5 m per pixel. By this method we obtain for a single <strong>cavitation</strong>bubble streak images <strong>from</strong> approximately 100–500particles. A timing unit controls the start of the recording, theexposure duration, and the trigger of the <strong>laser</strong>.Figure 3 depicts an example of particle streaks for thefour stages corresponding to the rows of Fig. 2. The brightspot in the center is due to the plasma emission during thebubble creation and marks the center of the bubble projectedonto the surface. During expansion the particles move approximatelya similar distance over the exposure time of100 s outwards Fig. 3a as they move inwards Fig. 3bduring shrinkage. Thus volume pulsation does not produce0003-6951/2006/897/074102/3/$23.0089, 074102-1© 2006 American Institute of PhysicsDownloaded 18 Aug 2006 to 130.89.86.60. Redistribution subject to AIP license or copyright, see http://apl.aip.org/apl/copyright.jsp
074102-2 Ohl et al. Appl. Phys. Lett. 89, 074102 2006FIG. 1. Color online Layer of grease mixed with coloredparticles before left frame and after centerframe it has been exposed to a <strong>cleaning</strong> bubble. Therightmost frame depicts the surface after a secondbubble has been generated at the same location.Thereby, some remains of the grease <strong>from</strong> the first shotare removed and the size of the cleaned area isenlarged.considerable transport of the particles. However, after theimpact of the jet Fig. 3c all particles become largely displacedand the center region is cleared completely <strong>from</strong> particles,see Fig. 3d.The averaged velocities during the different stages of thebubble dynamics are quantitatively analyzed by measuringthe streak lengths <strong>from</strong> the images. Figure 4 presents themodulus of the averaged velocity plotted as a function of theinitial distance <strong>from</strong> the center r=0. In the expansion andcollapse stages <strong>from</strong> 0 to 100 s and <strong>from</strong> 100 to 200 s,respectively the maximum of the averaged radial velocitiesis around ±1 m/s with positive velocities during expansionand negative during shrinkage. The velocity drops to zero forr=0 which is plausible as the center is a stagnation point.Only during the time interval of the jet impact and radialspreading 200−230 s considerably higher particle velocitiesof 10 m/s are found. The highest velocities are reachedvery close to the region of jet impact. In the streak images30 s later 230−260 s all particles within a distance of0.9 mm <strong>from</strong> the center are washed away, demonstrating thatit is the <strong>induced</strong> jet flow which is responsible for the <strong>cleaning</strong>effect.In conclusion, we have found that the most prominentboundary layer flow on the substrate occurs when the jetflow spreads radially on the surface. It is this relatively shorttime interval where the highest shear stress is exerted and thesurface becomes cleaned. Possibly, a similar <strong>cleaning</strong> mechanismmight be responsible in an ultrasonic water bath. There,many <strong>bubbles</strong> are driven into resonant pulsations by continuousacoustic waves. When they are driven to large enoughoscillations they can undergo a violent collapse, and in thepresence of a boundary they develop a jet. 11 Although, thelifetime of the bubble studied in this letter would correspondto a driving frequency of only a few kilohertz in an ultrasoundbath, we suggest that the <strong>cleaning</strong> mechanism is similarfor smaller <strong>bubbles</strong>, thus for higher and more relevantfrequencies. Still, further research has to be undertaken tocompare the importance of the jet <strong>induced</strong> shear flow withother proposed <strong>cleaning</strong> mechanisms. 12–16This work was supported by grants <strong>from</strong> the “Stichtingvoor Fundamenteel Onderzoek der Materie FOM” and the“Nederlandse Organisatie voor Wetenschappelijk OnderzoekNWO.”FIG. 2. Color online a Selected frames <strong>from</strong> a highspeedseries of a <strong>laser</strong>-<strong>induced</strong> <strong>cavitation</strong> bubble near aboundary. The time in the upper part of each frame isthe framing time of the bubble after generation with the<strong>laser</strong>. The four rows relate to four stages of the bubbledynamics: initial bubble expansion, bubble collapse, jetimpact, and reexpansion. b Stroboscopic pictures visualizingthe liquid jet within the bubble left and impactingon the boundary right.Downloaded 18 Aug 2006 to 130.89.86.60. Redistribution subject to AIP license or copyright, see http://apl.aip.org/apl/copyright.jsp