2009 Annual Reports - Bureau of Fisheries and Aquatic Resources
2009 Annual Reports - Bureau of Fisheries and Aquatic Resources
2009 Annual Reports - Bureau of Fisheries and Aquatic Resources

You also want an ePaper? Increase the reach of your titles
YUMPU automatically turns print PDFs into web optimized ePapers that Google loves.
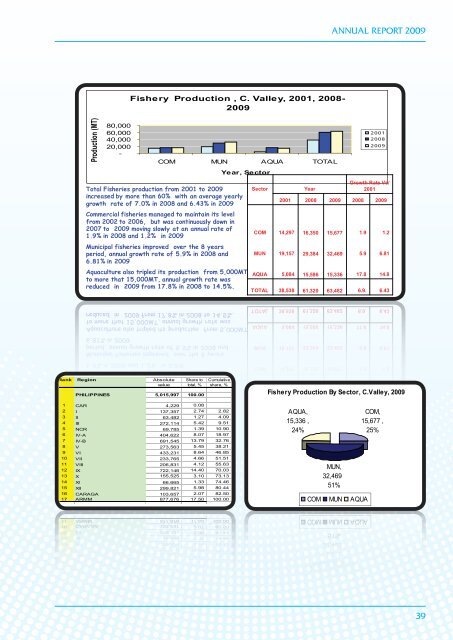
Aquaculture also tripled its production from 5,000MTto more that 15,000MT, annual growth rate wasMunicipal fisheries improved over the 8 yearsperiod, annual growth rate <strong>of</strong> 5.9% in 2008 <strong>and</strong>2007 to <strong>2009</strong> moving slowly at an annual rate <strong>of</strong>1.9% in 2008 <strong>and</strong> 1.2% in <strong>2009</strong>Commercial fisheries managed to maintain its levelfrom 2002 to 2006, but was continuously down inTotal <strong>Fisheries</strong> production from 2001 to <strong>2009</strong>increased by more than 60% with an average yearlyProduction (MT)Fishery Production , C. Valley, 2001, 2008-<strong>2009</strong>16 CARAGA 103,657 2.07 82.5017 ARMM 877,676 17.50 100.00Rank Region Absolute Share to Cumulativevalue total, % share, %AQUA,15,336 ,MUN,32,469Growth Rate Vs/2001COM,15,677 ,ANNUAL REPORT <strong>2009</strong>Production (MT)80,00060,00040,00020,000-Fishery Production , C. Valley, 2001, 2008-<strong>2009</strong>Total <strong>Fisheries</strong> production from 2001 to <strong>2009</strong>increased by more than 60% with an average yearlygrowth rate <strong>of</strong> 7.0% in 2008 <strong>and</strong> 6.43% in <strong>2009</strong>Commercial fisheries managed to maintain its levelfrom 2002 to 2006, but was continuously down in2007 to <strong>2009</strong> moving slowly at an annual rate <strong>of</strong>1.9% in 2008 <strong>and</strong> 1.2% in <strong>2009</strong>Municipal fisheries improved over the 8 yearsperiod, annual growth rate <strong>of</strong> 5.9% in 2008 <strong>and</strong>6.81% in <strong>2009</strong>COM MUN AQUA TOTALYear, SectorAquaculture also tripled its production from 5,000MTto more that 15,000MT, annual growth rate wasreduced in <strong>2009</strong> from 17.8% in 2008 to 14.5%.SectorYear20012008<strong>2009</strong>Growth Rate Vs/20012001 2008 <strong>2009</strong> 2008 <strong>2009</strong>COM 14,297 16,350 15,677 1.9 1.2MUN 19,157 29,384 32,469 5.9 6.81AQUA 5,084 15,586 15,336 17.8 14.8TOTAL 38,538 61,320 63,482 6.9. 6.43TOTAL 38,538 61,320 63,482 6.9. 6.43reduced in <strong>2009</strong> from 17.8% in 2008 to 14.5%.AQUA 5,084 15,586 15,336 17.8 14.86.81% in <strong>2009</strong>MUN 19,157 29,384 32,469 5.9 6.81COM 14,297 16,350 15,677 1.9 1.2Rank Region Absolute Share to Cumulativevalue total, % share, %PHILIPPINES 5,015,997 100.00growth rate <strong>of</strong> 7.0% in 2008 <strong>and</strong> 6.43% in <strong>2009</strong>Fishery Production By Sector, C.Valley, <strong>2009</strong>1 CAR 4,229 0.082 I 137,357 2.74 2.823 II 63,482 1.27 4.094 III 272,114 5.42 9.515 NCR 69,785 1.39 10.906 IV-A 404,622 8.07 18.977 IV-B 691,545 13.79 32.768 V 273,563 5.45 38.21-9 VI 433,231 8.64 46.8520,00010 VII 233,765 4.66 51.5111 VIII 206,831 4.12 55.6312 IX 722,146 14.40 70.0340,00060,00013 X 155,525 3.10 73.1314 XI 66,665 1.33 74.4680,00015 XII 299,821 5.98 80.4416 CARAGA 103,657 2.07 82.5017 ARMM 877,676 17.50 100.00SectorYear, Sector2001 2008 <strong>2009</strong> 2008 <strong>2009</strong>AQUA,15,336 ,24%YearCOM MUN AQUA TOTALMUN,32,46951%COM MUN AQUACOM,15,677 ,25%<strong>2009</strong>20082001COM MUN AQUA15 XII 299,821 5.98 80.4414 XI 66,665 1.33 74.4651%13 X 155,525 3.10 73.1312 IX 722,146 14.40 70.0311 VIII 206,831 4.12 55.6310 VII 233,765 4.66 51.519 VI 433,231 8.64 46.858 V 273,563 5.45 38.217 IV-B 691,545 13.79 32.766 IV-A 404,622 8.07 18.975 NCR 69,785 1.39 10.9024%25%4 III 272,114 5.42 9.513 II 63,482 1.27 4.092 I 137,357 2.74 2.821 CAR 4,229 0.0839PHILIPPINES 5,015,997 100.00Fishery Production By Sector, C.Valley, <strong>2009</strong>