Summary Report - WSP Group
Summary Report - WSP Group
Summary Report - WSP Group
- No tags were found...

Create successful ePaper yourself
Turn your PDF publications into a flip-book with our unique Google optimized e-Paper software.
This summary report has been written to helpcommercial businesses, developers and tenants puta hard dollar value against the so-called ‘soft’ benefi tsof improved health and productivity as a result of theimpact on indoor environment quality (IEQ) of sixdifferent Heating, Ventilation and Air Conditioning(HVAC) systems.Against a Base Option of a Grade A building with acode compliant variable air volume system, the studyassesses fi ve typical HVAC design alternatives currentlybeing used in the Australian marketplace:– Option 1 – Displacement (Underfl oor Air) Ventilationwith minimum code-compliant freshair rates;– Option 2 – Displacement Ventilation with 100%fresh air;– Option 3 – Chilled Beams with 100% fresh air;– Option 4 – Chilled Ceilings with 100% fresh air; and– Option 5 – Natural Ventilation, designed for exhaust viaa central atrium, with heating.Interpreting available research, the study ranks eachoption on the basis of market rate capital cost premiumsand energy costs, health and productivity benefi ts andcalculates the overall cost of each system incorporatingall criteria. The study also interprets research from aconservative and an optimistic viewpoint.The clear fi nding is that while capital cost is currentlythe key driver behind the selection of air-conditionedoutcomes, using other criteria the cheapest optionwould seem to fail to deliver in the short to medium term.The system of full fresh air displacement ventilation(Option 2) was the clear winner when it comes to theprovision of excellent indoor environmental quality,while the system of variable air volume which is thestandard HVAC system in commercial offi ce buildingsin Australia (Base Option) was found to deliver thepoorest performance.Figure AUsing a Base Option of a Grade A building with a codecompliant variable air volume system, an assessmentwas made of the potential for each system to deliversavings through improved health and productivity onthe basis of a number of IEQ principles estimates,measured in terms of annual per m 2 NLA costs. Theresults ranged from a comparative loss of $5/m 2 /yearfor a natural ventilation system to a comparative benefi tof $248/m 2 /year for a system of displacement ventilationwith 100% fresh air.Figure BThe full story is told when the annual cost savings areextrapolated into a Net Present Value analysis of eachof the design options, incorporating nominal energy andcapital cost implications. The results, summarised in thetable below, with negative costs indicating a saving innet present terms, communicate the overall economicargument for adopting alternative technologies insteadof the industry standard Base Option.Figure CGiven the study fi nally ranks the options, with anallocation of equal weight to the capital cost, energyconsumption and occupant health and productivity ofeach system, Option 5 (Natural Ventilation) was a clearwinner, with Option 3 (Chilled Beams) the preferred ofthe air-conditioned options. All alternatives deliveredresults equal to or better than the Base Option.It is easy to see why chilled beams are the currentalternative of preference, offering a relativelysympathetic capital cost impact while still deliveringgood energy and IEQ outcomes. Most importantly, therewas no assessment methodology used in this study thatshowed support for what is the current industry standardBase Option.The results of this study should motivate tenants todemand better design solutions for new buildings andto be prepared to pay a premium for buildings whichdeliver signifi cant ongoing savings to their bottom line.This document provides a summary of the full report.A copy of full study is available from Lincolne Scott.Figure A: Annual cost savingConservative and optimistic estimatesof annual cost impacts of design options ($/m 2 NLA)BaseOption Option 1 Option 2 Option 3 Option 4 Option 5Conservative estimate of annual savings $0 $22 $33 $8 $8 -$5Optimistic estimate of annual savings $0 $86 $247 $114 $163 $151Figure B: Net present valueof design optionsNet present value of design option(incorporating energy, capital cost and productivity/health benefits)(negative value denotes reduced net cost over time period)BaseOption(VAV)Option 1(Disp. Air)Option 2(Disp.& 100%Fresh Air)Option 3(ChilledBeams)Option 4(ChilledCeilings)Option 5(NaturalVent)Conservative assessment after 10 years $0 -$87 -$150 -$69 $77 -$178Conservative assessment after 20 years $0 -$211 -$333 -$127 $19 -$193Optimistic assessment after 2 years $0 -$60 -$341 -$200 -$147 -$446Optimistic assessment after 5 years $0 -$271 -$968 -$493 -$569 -$843Optimistic assessment after 10 years $0 -$572 -$1,866 -$915 -$1,174 -$1,412Figure C: Overall rankingScore by rank in each criteriaBaseOption Option 1 Option 2 Option 3 Option 4 Option 5Capital cost 5 3 2 4 1 6Energy cost 2 2 2 3 3 6Health and productivity benefi t 1 3 6 4 5 2Overall score 8 8 10 11 9 145
1In recent years, the long-standing Heating, Ventilation, andAir Conditioning (HVAC) solution for Grade A commercialbuildings – Variable Air Volume (VAV) – has been challengedby a range of alternative systems including displacementventilation, chilled beams and natural ventilation.In many cases, these alternatives carry a capital costincrease and are instead sold on their capacity to deliverimproved energy effi ciency and, most importantly, theircapacity to improve the health and productivity of offi ceworkers – but to date little work has been done to quantifythese benefi ts in hard dollar terms.This study seeks to put a dollar fi gure to these benefi tsthrough the following analysis:– determining an appropriate average cost to associatewith the employment of an average offi ce worker;– reviewing the costs and causes of unapproved leave(eg sick leave and other impromptu leave) and voluntaryIntroduction_staff turnover;– identifying a typical code compliant HVAC designsolution for the base case and a series of HVAC designalternatives to that base case solution that are identifi edanecdotally as healthier HVAC design solutions;– reviewing literature and research which has consideredand measured the impact of HVAC design parameterson occupant productivity and wellbeing;– correlating the literature on research on health andproductivity with the design features of alternativeHVAC options to arrive at conservative and optimisticcost impacts; and– combining all data to deliver an annual cost impact foreach option and an economic assessment regardingthe feasibility of each HVAC design option.It also considers optimistic and conservative cost savingfi ndings in the light of points awarded by well-knownrating schemes Green Star (Australia) and LEED (USA)as a means of reviewing the validity of both the ratingschemes and the research included in the study.Data used in this study is based on Lincolne Scott’sexperience in HVAC systems costs; governmentdepartment and statistical surveys on the costs ofunapproved leave and voluntary separation from theworkplace, as well as average expenditure on employeecosts; and research papers and studies concerningthe health and productivity impacts of outside airrates, ventilation effectiveness, thermal comfort andindividual control.This study refers to costs and benefi ts on a per squaremetre basis. Unless otherwise stated, this is measuredin terms of per square metre of Net Lettable Area (NLA).It is important to note that every effort is made to providerealistic estimates of savings, but the difference betweenconservative and optimistic estimates indicates howdiffi cult real life outcomes are to accurately determine.6
2Leave,turnoverandproductivity_Figure 2.1: Reasons for sick leaveCause for sick leaveIllness contracted in offi ce environmentthrough airborne sourcesIllness contracted in offi ce environmentthrough contaminated surfacesRelevance IndoorEnvironment Quality (IEQ)Usually caused by poor indoor air qualityand exacerbated by poor thermal comfortUsually caused by poor offi ce hygiene andexacerbated by poor thermal comfortTo set the framework under which actual cost savingscan be calculated, the fi rst section of the reportexamines the opportunities to make ongoing savingsthrough an improved work environment for staff, byconsidering the following:– the average cost to a business of employing staff;– how much sick leave and staff turnover costs businesses;– how much the cost of sick leave can be attributed to thework environment;– how much the incidence of staff turnover can beattributed to the work environment; and– what scope (if any) exists for improving the productivityof staff and what would that mean in terms of realwork delivered.2.1 The cost of employing staffBased on Australian Bureau of Statistics fi gures for theaverage salary for full-time workers in NSW metropolitanareas, NSW employer contributions to superannuation,additional employee on-costs including payroll tax andsick leave provisions, and overheads including rent forthe offi ce space and provision of computer and offi cefacilities, it is calculated that the total cost of employingeach staff member is $91,342.On the basis that each employee requires 15m 2 of NLA,this equates to a total cost of employment per m² NLAof $6,090 per year.2.2 Absenteeism and sick leave2.2.1 Annual cost of absenteeismAccording to a recent survey conducted by theNSW Department of Workplace Relations and SmallBusiness, on average, 2.7% of the Australian workforceis absent on unapproved leave on any given day.For absenteeism, it is fairly reasonable to say that thecost to an employer of someone not being at work dueto unapproved leave is 100% of the cost of employingthem for that time.Therefore, assuming that productivity is zero whenworkers are absent, the average cost of absenteeismper m² NLA is $164 per year.2.2.2 Reasons for absenteeismThe reasons for unapproved leave are complicated andpoorly documented, by both the private and public sectors.A review of recent studies informed the followingbreakdown of the reasons for sick leave. See Figure 2.1.Sick leave attributedto this cause (%)Cost due to thiscause of unapprovedleave ($/m 2 /year)15% $2510% $16Injury caused by home environment Not related to offi ce IEQ 10% $16Injury caused by offi ce environment Marginal association with offi ce IEQ 5% $8Injury caused by non-offi ce environment Not related to offi ce IEQ 10% $16Stress related to work Partial link to offi ce IEQ 20% $33Non-work related stress Marginal link to offi ce IEQ 20% $33Other reasons Not related to offi ce IEQ 10% $162.3 Staff turnover through voluntaryseparationThis section investigates the cost to businesses of staffturnover, and the proportion of that cost which mightbe due to the offi ce environment. It considers:– cost of voluntary separation for each staff memberleaving a company;– the average rate of voluntary separation of staff; and– the reasons for voluntary separation and the potentialimpact of poor indoor environmental quality.2.3.1 Staff turnoverThere is a diverse range of opinion on the cost of staffturnover via voluntary separation. Based on the availableresearch, this study takes that cost to be 50% of anemployee’s salary, which means that the cost to anaverage business of each staff member leaving thatorganisation voluntarily is $27,136.According to the Australian Bureau of Statistics, theemployee separation rate in the Australian PublicService is 5.5%. This is the rate used by this study asthe average voluntary separation rate by employees.Therefore, if the cost of replacing a voluntarily separatedstaff member is $27,136 and the average rate ofvoluntary staff separation is 5.5%, then the total costof voluntary staff separation is $1,492 per staff member,or effectively $100/m 2 /year.2.3.2 The reasons for staff turnoverSo why do people leave their place of employmentand to what extent is that due to an unhealthy or poorphysical working environment?Just as with sick leave, the reasons for staff turnoverare complex and varied. Firstly, it is important to be ableto separate voluntary separation from company-drivenseparation, because voluntary separation is realisticallythe only component that could feasibly be reduced byimproving the offi ce environment.There is enough anecdotal evidence to reasonablyshow that staff who are physically comfortable are morelikely to be satisfi ed and stay with their current employer.Plenty of organisations spend signifi cant amounts ofmoney making their offi ce spaces more appealingto staff in an attempt to retain and lure better people.Therefore, it is reasonable to apportion a percentageof the cost of staff turnover to a poor work environment.In the absence of a serious study looking at how theseissues affect the voluntary separation rate of staff, thisstudy will take a conservative approach and apportion5% of voluntary separation to reasons associated withdissatisfaction with the work environment.This means that for the purposes of this study, theaverage cost to business of voluntary separation ofemployees as a result of a poor workplace is $5/m 2 /year.2.4 Staff productivityThe above factors only account for the costs ofemployee absence or turnover caused by a poor indoorenvironment. The next chapter provides more detailregarding estimates about productivity improvementas a result of an improved indoor environment.For the purposes of this study, the annual expenditureon staff per m 2 will be used as the benchmark formeasuring productivity. This means that for each1% improvement in productivity, the average businesswill produce an additional $61/m 2 /year in revenue.Of course, revenue generated by staff in a successfulbusiness is signifi cantly higher than their cost to thebusiness, but this approach allows for an extra levelof conservatism in calculation of benefi ts.7
3AustralianSelectionof optionsforcomparison_Six commercial building design approaches are consideredin this study. The aim of selecting design approachoptions for comparison is based on the following:– the standard base case for a building design is a GradeA building (based on the Property Council of Australia’sGrading Matrix) which complies with AustralianStandards for the design of HVAC systems throughthe use of standard, commonplace technology;– HVAC design options which are able to addresskey indoor environmental quality performanceindicators such as ventilation rates and effectiveness,thermal comfort and individual control over comfort; and– alternative HVAC systems that have alreadybeen successfully implemented into projects in themarketplace.3.1 Options for comparisonEach of the HVAC design options adopted forcomparison is listed below.3.1.1 Base Option –industry standard practiceThe base case for this study is the typical approachto designing commercial offi ce buildings in Australia,which has prevailed for at least the last 10 to 20 years,characterised as follows:– a central air-handling and conditioning plant supplyingcold air (around 14 degrees Celsius) to offi ce spaces,with variations in the quantity of air supplied used tocontrol the overall temperature;– a very high degree of mixing of the air supplied to thespace with the air in the space with the intention ofachieving an average temperature of 21–24 degrees;– the reuse and re-reticulation of exhaust air from offi cespaces around the building to reduce the amount ofenergy needed to cool (or heat) the supply air;– a level of outside (fresh) air mixed into the supplyair in accordance with the minimum required by theAustralian Standard (AS1668.2)(7.5 litres per secondper person); and– effi cient controls aimed at saving energy, with a typicalbase building electricity consumption of 94kWh per m 2and a typical natural gas consumption of 75MJ per m 2for a Sydney offi ce base building.3.1.2 Option 1 – Displacement Ventilationwith recirculated airThis fi rst variation on the Base Option uses adisplacement ventilation system instead of the variableair volume system of our base model. Displacementventilation systems supply air at a lower velocity andhigher temperature at low level, rather than mixing air ata high velocity and low temperature into a space.3.1.3 Option 2 – Displacement Ventilationwith full fresh airThis option is a variation on Option 1 with a displacementventilation system that provides 100% fresh air to thespace rather than just the minimum levels of fresh airto the offi ce space.8
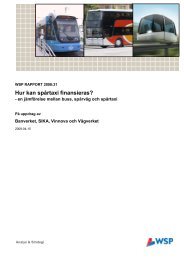
3.1.1 Base Option:– Industry standard practice3.1.2 Option 1:– Displacement Ventilationwith recirculated air3.1.3 Option 2:– Displacement Ventilationwith full fresh air9
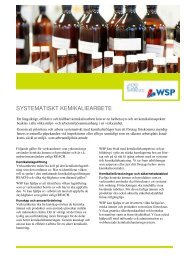
3.1.4 Option 3:– Passive Chilled Beams3.1.5 Option 4:– Chilled Ceilings10
3.1.4 Option 3 – Passive Chilled BeamsThis option represents an entirely differentair-conditioning approach to the Base Option or Options1 and 2. Passive Chilled Beams use chilled waterelements in a space to remove heat and passivelyentrain air movement.3.1.5 Option 4 – Chilled CeilingsThis option represents a slight variation on Option 3,with the use of chilled ceilings instead ofchilled beams.3.1.6 Option 5 – Natural VentilationMany commercial buildings built before the 1960s usednatural ventilation to varying degrees of effectiveness.A signifi cant number included a large number of cellularoffi ce spaces with operable windows for control.Others with open-plan style layouts used high ceilingsto assist with the natural ventilation performance.3.2 <strong>Summary</strong> of benchmarksThis section provides a preliminary summary of theperformance of each option against the followingbenchmarks:– Capital Cost (in terms of $/m 2 of NLA) – including;Mechanical Costs; Building/Architectural Costs;and Floor Area Costs (the effective cost of providingenough fl oor area for ducts, risers, atria, etc. asrequired by that option).– Energy Cost (in terms of $/m 2 of NLA per annum)– annual energy consumption taken for each optionis based on a minimum outcome of a 4.5 Star ABGR(Australian Building Greenhouse Rating) base buildingscore; and– Performance against Green Star and LEED IEQcredits – a hypothetical analysis of the relevant creditsthat each design option would obtain from the IEQcategories in the Green Building Council of Australia’sGreen Star rating scheme and in the US Green BuildingCouncil’s LEED rating scheme.3.3 Capital costsThe options considered by this study can be rankedon the basis of capital costs as follows:1. Option 5 (Natural Ventilation)2. Base Option (Variable Air Volume)3. Option 3 (Chilled Beams with 100% outside air)4. Option 1 (Displacement with minimum outsideair rates)5. Option 2 (Displacement with 100% outside air)6. Option 4 (Chilled Ceilings with 100% outside air)Figure 3.1:Capital cost breakdown for each option on a per m 2NLA basis.3.4 Energy consumption and costsThe options considered by this study can be rankedon the basis of energy costs as follows:1. Option 5 (Natural Ventilation)2. Option 3 (Chilled Beams with 100% outside air) andOption 4 (Chilled Ceilings with 100% outside air)3. Option 1 (Displacement with minimum outsideair rates),4. Option 2 Displacement with 100% outside air)Base Option (Variable Air Volume).Note that Option 5 (Natural Ventilation) is signifi cantlylower in electricity consumption than the other optionsas a result of an absence of fans or mechanical plantfor cooling.Figure 3.2:Table of energy costs per m 2 NLA per annum foreach option.Energy costs are taken as $0.12/kWh for electricityand $0.013/MJ for natural gas.3.5 IEQ credits from Green Star and LEEDThe study makes a hypothetical analysis of points thatwould be obtained under the Green Star and LEEDenvironmental rating schemes.The results indicate a greater proportion of IEQ pointsavailable in Green Star for various HVAC design optionsas compared with LEED. Up to 40% of IEQ points canbe affected by the selection of the HVAC option in GreenStar, whereas in LEED, the impact of HVAC selection isonly 20% of IEQ points.The full version of the report covers this comparisonin greater detail.Figure 3.1: Capital cost breakdownfor each option on a per m 2 NLA basisCategory of Capital CostBaseOption Option 1 Option 2 Option 3 Option 4 Option 5Mechanical Costs $280 $280 $305 $320 $460 $80Building/Architectural Costs $101 $193 $193 $95 $101 $100Cost of Floor Area Required $34 $36 $36 $16 $16 $80Total Capital Costs $415 $500 $534 $431 $577 $260Figure 3.2: Table of energy costsper m 2 NLA per annum for each optionBaseOptionOption 1PointsOption 2PointsOption 3PointsOption 4PointsOption 5PointsABGR Base Building Rating 4.5 Stars 4.5 Stars 4.5 Stars 5 Stars 5 Stars Beyond5 StarsElectricity Consumption (kWh/m 2 /year) 94 94 94 76 76 30Gas Consumption (MJ/m 2 /year) 75 75 75 65 65 100Electricity Cost ($/m 2 /year) $11.28 $11.28 $11.28 $9.12 $9.12 $3.60Gas Cost ($/m 2 /year) $0.98 $0.98 $0.98 $0.85 $0.98 $1.3011
4QuantifyingimprovedIEQ_This chapter summarises current literature on indoorenvironment quality, looking for keys to understandinghow an improved indoor environment might affectoccupant health and productivity. The full version ofthis paper explores this literature in greater detail.The specifi c issues investigated in current literatureby this study include the following:– Ventilation (outside/fresh air) rates;– Ventilation Effectiveness (the age of air);– Designing for Thermal Comfort (as opposed to justtemperature control); and– Individual Control of Thermal Comfort.For each issue, the primary focus is to understand thelink between improved design and improved occupanthealth and productivity.4.1 Minimum fresh airThe minimum fresh air is the amount of air providedto the occupants of an artifi cially conditioned building.Metrically, it is described in litres of air per second perperson occupying the building.The Australian Standard AS1668.2 varies dependingon the design, but generally, for a typical offi ce building,the standard requires 7.5l/s/person.A reasonable amount of research has been carriedout into the effects of fresh air supply on productivity.Based on the available research, the study concludesthat productivity can be improved by increasing theoutside air rate when compared to our Base Option.Figure 4.1:Summarises the improved fresh air rates with each option.The research clearly indicates the following:– Sick Building Syndrome is an important cause of sickleave and reduced productivity in the offi ce environment;– low ventilation rates are a signifi cant cause of SickBuilding Syndrome;– increasing ventilation rates affects the rate of contagionof airborne illnesses;– increasing ventilation rates affects worker productivityand wellbeing;– increases in ventilation rates have the greatest impactbetween the code compliant rate and about 25l/s/person.Increases beyond 30l/s/person would not seem to haveas much of an impact.There are, of course, signifi cant variations in the extentto which these fi ndings impact health and productivity.To account for this, this study takes two approachesto assessing the impact of ventilation rates on leaveand productivity – a conservative approach and anoptimistic approach.4.1.1 Conservative approachCompared with a standard code-compliant VAVapproach, a conservative assessment of cost benefi tfrom improved fresh air ventilation rates is that an annualsaving of up to around $7–$10/m 2 could be achievedby increasing the minimum outside air rate supply or byproviding a well designed natural ventilation system.Figure 4.2:Conservative assessment of cost benefi t from improvedventilation rates.Figure 4.1: Improved fresh air ratesBase OptionVariableAir VolumeOption 1Displacementwith reticulationOption 2Displacementwith 100% fresh airOption 3Chilled BeamsOption 4Chilled CeilingsOption 5Natural VentilationMinimum fresh air rates 7.5l/s/person 7.5l/s/person 23l/s/person 15l/s/person 15l/s/person >6 air changesper hourFigure 4.2: Conservative assessment ofcost benefits from improved ventilation ratesEstimated impact on cost for each optionImpact of variations in ventilation ratesCost/Benefit(fromchapter 2)BaseOptionOption 1Displacement andmin. fresh air%impact$savedOption 2Displacement and100% fresh air%impact$savedOption 3Chilled Beams%$impact savedOption 4Chilled Ceilings%$impact savedOption 5Natural Ventilation%$impact savedAbsence due to illness contracted at work from airborne sources $25.00 0% 0% $0.00 23% $5.63 15% $3.75 15% $3.75 23% $5.63Increase in productivity (staff cost equals $6,090/m² NLA) $6,090 0% 0% $0.00 0.08% $5.14 0.06% $3.43 0.06% $3.43 0.08% $5.14Total Cost Saving ($/m²/year) $0.00 $0.00 $10.76 $7.18 $7.18 $10.76Figure 4.3: Optimistic assessment ofcost benefit from improved ventilation ratesEstimated impact on cost for each optionImpact of variations in ventilation ratesCost/Benefit(fromchapter 2)BaseOptionOption 1Displacement andmin. fresh air%impact$savedOption 2Displacement and100% fresh air%impact$savedOption 3Chilled Beams%$impact savedOption 4Chilled Ceilings%$impact savedOption 5Natural Ventilation%$impact savedAbsence due to illness contracted at work from airborne sources $25.00 0% 0% $0.00 38% $9.50 25% $6.25 25% $6.25 38% $9.50Increase in productivity (staff cost equals $6,090/m² NLA) $6,090 0% 0% $0.00 2.50% $152.25 1.70% $103.53 1.70% $103.53 2.50% $152.25Total Cost Saving ($/m²/year) $0.00 $0.00 $161.75 $109.78 $109.78 $167.7512
4.1.2 Optimistic approachCompared with a standard code-compliant VAVapproach, an optimistic assessment of cost benefi tfrom improved fresh air ventilation rates is that anannual saving of up to around $107–$167/m 2 couldbe achieved by increasing the minimum outside airrate supply or by providing a well designed naturalventilation system.Figure 4.3:Optimistic assessment of cost benefi t from improvedventilation rates.4.2 Ventilation efficiency and freshair deliveryThe ventilation effi ciency of an HVAC design describeshow well the fresh air that is being supplied to a spaceis provided to occupants of the building.Ventilation effi ciency is typically measured using theAir Change Effectiveness value, which is effectivelythe proportion of contaminants in the air exhaustedcompared with the air in the breathing zone.Many of the fi ndings which have been discussed withregard to minimum outside air rates are easily transferredto ventilation effi ciency. The benefi ts of increasing theminimum outside air rate are improved further by betterdistribution and delivery of the outside air.Some research has been directed specifi cally on theproductivity and health benefi ts associated with higherventilation effi ciency and has found that such systemsimprove productivity and occupant health over typicalVAV systems.Well-designed displacement ventilation is consideredto provide the best indoor air quality of any of the HVACsystems reviewed by this study. Important researchshows how this is borne out in the signifi cant reductionin infection rates between people that share a mixed-airindoor environment and people who share an indoorenvironment acclimatised with improved levels ofventilation effectiveness.The ventilation effectiveness for each of the optionsreviewed by this study is shown below:Figure 4.4:Ventilation effectivenessKey research outcomes indicate that:– Sick Building Syndrome is an important cause of sickleave and reduced productivity in the offi ce environment;– improving ventilation effectiveness can reduce theeffects of Sick Building Syndrome;– improving the air change effectiveness reducesthe amount of indoor air pollutants within the space;– the reduction in indoor air pollutants provided byimproved air change effectiveness can be enoughto reduce the rate at which airborne illness is spreadwithin an offi ce building;– the reduction in indoor air pollutants provided byimproved air change effectiveness has a positiveimpact on worker wellbeing and productivity; and– improvements in health and productivity resulting fromimproved air change effectiveness are entirely separatefrom improvements related to ventilation rates.4.2.1 Conservative ApproachRelative reductions in illness and unapproved leavecaused by airborne sources are described below:Figure 4.5:Conservative estimate of reductions in sick leave dueto improved ventilation effi ciencyCompared with a standard code-compliant VAVapproach, a conservative assessment of cost benefi tsfrom improved ventilation effectiveness is that an annualsaving of up to around $2/m 2 could be achieved throughthe use of displacement ventilation or natural ventilation,with more modest improvements also possible throughthe use of full fresh air, once-through systems such aschilled beams and ceilings.Figure 4.6:Conservative estimate of cost savings due to improvedventilation effi ciency.Figure 4.4: Ventilation effectivenessBase OptionVariable Air VolumeOption 1Displacement withreticulationOption 2Displacement with100% fresh airOption 3Chilled BeamsOption 4Chilled CeilingsOption 5Natural VentilationAir Change Effectiveness 0.8 1.4 1.4 1 1 1.4Figure 4.5: Conservative estimate ofreductions in sick leave due to improvedventilation efficiencyExtrapolated impact from each optionImpact of improved thermal comfortBaseOption Option 1 Option 2 Option 3 Option 4 Option 5 Justification for benefitAbsence due to illness contracted in offi ce from airborne sources 0% 8% 8% 4% 4% 8% Improved ventilation effectiveness improves the removal of pollutants fromthe space – it reduces the age of the air and the amount of contaminantsoccupants will be subject to. Values based on improvements against VAVaccording to Wells-Riley study, with a 50% safety factor applied.Figure 4.6: Conservative estimate of costsavings due to improved ventilation efficiencyImpact of improved ventilation effectivenessEstimated savings for each option compared with Base OptionCost/Benefit Option 1 Option 2 Option 3 Option 4 Option 5Base%$ %$%$%$%Option impact saved impact saved impact saved impact saved impact(fromchapter 2)$savedAbsence due to illness contracted in offi ce from airborne sources $25.00 0% 8% $2.05 8% $2.05 4% $0.93 4% $0.93 8% $2.05Total Cost Saving ($/m²/year) $0.00 $2.05 $2.05 $0.93 $0.93 $2.0513
4.2.2 Optimistic approachOptimistic estimates of leave and productivity impactsfrom improved ventilation effi ciency are as follows.Figure 4.7:Optimistic estimate of leave and productivity impactsdue to improved ventilation effi ciency.Compared with a standard code-compliant VAVapproach, an optimistic annual saving of up to around$5.50/m 2 could be achieved by improving the ventilationeffectiveness through the use of displacement ventilationor natural ventilation, with more modest improvementsalso possible through the use of full fresh air, oncethroughsystems such as chilled beams and ceilings.Figure 4.8:Optimistic assessment of cost savings associated withimproved ventilation effi ciency.4.3 Designing for thermal comfortThe thermal comfort of a building, defi ned in theInternational Thermal Comfort Standard ISO7730 (1993),is primarily made up of six contributing factors:– Air temperature;– Radiant temperature;– Humidity;– Air velocity;– Clothing levels; and– Activity rate.The International Thermal Comfort Standard ISO7730describes the proportion of users who are dissatisfi edwith their internal environment as a percentage oftotal users for typical HVAC thermal comfort designconditions. This benchmarking assists in measuringthe proportion of the dissatisfi ed workplace that canbe made satisfi ed by various design initiatives.The HVAC system used in a building can affect thermalcomfort by infl uencing:– Air temperature;– Radiant temperature;– Humidity; and– Air velocity (draught).The options assessed in this study provide variationsin the level of thermal comfort, by addressing the aboveconditions to varying degrees, as follows.Figure 4.9:Capacity of various options to control key thermalcomfort parameters.Figure 4.7: Optimistic estimate of leaveand productivity impacts due to improvedventilation efficiencyEstimated benefit from each optionVentilation EffectivenessAttributes AddressedBaseOption Option 1 Option 2 Option 3 Option 4 Option 5 Justification for benefitAbsence due to illness contracted in offi ce from airborne sources 0% 17% 17% 8% 8% 17% Improved ventilation effectiveness improves the removal of pollutants fromthe space. It reduces the age of the air and the amount of contaminantsoccupants will be subject to. Values based on improvement against VAVaccording to Wells-Riley study.Increase in productivity 0% 0.06% 0.06% 0.03% 0.03% 0.03% Occupants not on unapproved leave will still be affected by changesin indoor air quality. It is taken that the number of workers that will haveproductivity affected at work is equivalent to the number of workers onunapproved leave. The extent it is affected is considered proportionateto the impact of ventilation effectiveness on unapproved leave.Figure 4.8: Optimistic assessment ofcost savings associated with improvedventilation efficiencyImpact of improved ventilation effectivenessEstimated savings for each option compared with Base OptionCost/Benefit Option 1 Option 2 Option 3 Option 4 Option 5Base%$ %$%$%$%Option impact saved impact saved impact saved impact saved impact(fromchapter 2)$savedAbsence due to illness contracted in offi ce from airborne sources $25.00 0% 17% $4.25 17% $4.25 8% $2.00 8% $2.00 17% $4.25Increase in productivity (staff cost equals $6,090/m² NLA) $6,090 0% 0.06% $3.88 0.06% $3.88 0.03% $1.83 0.03% $1.83 -.06% $3.88Total Cost Saving ($/m²/year) $0.00 $8.13 $8.13 $3.83 $3.83 $8.13Figure 4.9: Capacity of various optionsto control key thermal comfort parametersImpact of improved thermal comfortBase OptionVariable Air VolumeOption 1Displacement withreticulationOption 2Displacement with100% fresh airOption 3ChilledBeamsOption 4Chilled CeilingsOption 5Natural VentilationAir TemperatureRadiant Temp – HVACDraughtHumidityPredominant PMV Range ± 1 ± 1 ± 1 ± 1 ± 0.5 ± 1.514
Note that when compared with air-conditioned offi ceenvironments, Option 5 provides a higher variation incomfort performance that the Base Option or Option 1through to Option 4.The available research indicates:– variations in air temperature (when standardisedagainst other thermal comfort variables) have beenfound to have an impact on accident rates, and henceproductivity as well as accidents within the workplace; and– variations in air temperature (when standardised againstother thermal comfort variables) have been found tohave an impact on work pace and mental performance(and hence productivity).4.3.1 Conservative approachA conservative assessment of the impacts of thermalcomfort variations is summarised as follows.Figure 4.10:Conservative assessment of the impacts of thermalcomfort variations.Compared with an industry standard VAV approach thesummary of this assessment is that the use of naturalventilation in Sydney will cost an estimated $40/m 2 /yearin lost productivity compared with an industry standardair-conditioned building due to reduced thermal comfort.The cost impacts of these variations are summarisedas follows.Figure 4.11:Conservative cost benefi t impacts of thermal comfortvariations for each option.4.3.2 Optimistic approachAn optimistic assessment of the benefi ts associated withvariations in thermal comfort is summarised as follows.Figure 4.12:<strong>Summary</strong> of optimistic benefi ts associated withvariations in thermal comfort.Compared with a standard code-compliant VAVapproach, an optimistic assessment of the cost savingsassociated with variations in thermal comfort is thatincorporating chilled ceilings (and thus introducinggenuine radiant cooling) would provide a cost benefi tof up to $50/m 2 /year.The other key fi nding is that failing to address thermalcomfort could result in productivity and associatedlosses in the order of $80/m 2 /year.Figure 4.10: Conservative assessment ofthe impacts of thermal comfort variationsExtrapolated impact from each optionImpact of improved thermal comfortBaseOption Option 1 Option 2 Option 3 Option 4 Option 5 Justification for changeAbsence due to Injury caused by offi ce environment 0% 0% 0% 0% 0% -1.3% Reduced control over air temperature has been found to increase error ratesIncrease in productivity 0% 0.31% 0% 0% 0% -0.65% Improved mental performance and work pace associated with improvedthermal comfortFigure 4.11: Conservative cost benefitimpacts of thermal comfort variationsfor each optionImpact of improved thermal comfortEstimated savings for each option compared with Base OptionCost/Benefit Option 1 Option 2 Option 3 Option 4 Option 5Base%$ %$%$%$%Option impact saved impact saved impact saved impact saved impact(fromchapter 2)$savedAbsence due to Injury caused by offi ce environment $8.00 0% 25% $1.25 25% $1.25 0% $0.00 0% $0.00 -1.3% -$0.10Increase in productivity (staff cost equals $6,090/m² NLA) $6,090 0% 0.31% $18.88 0.31% $18.88 0% $0.00 0% $0.00 -0.65% -$39.59Total Cost Saving ($/m²/year) $0.00 $20.13 $20.13 $0.00 $0.00 -$39.69Figure 4.12: <strong>Summary</strong> of optimistic benefitsassociated with variations in thermal comfortExtrapolated impact from each optionImpact of improved thermal comfortBaseOption Option 1 Option 2 Option 3 Option 4 Option 5 Justification for changeAbsence due to Injury caused by offi ce environment 0% 0% 0% 0% 12.0% -16.0% Improved thermal comfort minimises error and accident ratesStaff Turnover due to Dissatisfaction with Workplace 0% 0% 0% 0% 60.0% -100.0% A very common complaint with most offi ce environments is the poorthermal comfortIncrease in productivity (staff cost equals $6,090/m² NLA) 0% 0% 0% 0% 0.75% -1.25% Improved mental performance and work pace associated with improvedthermal comfort15
Figure 4.13:Optimistic assessment of cost savings associatedwith variations in thermal comfort.4.4 Individual control of thermal comfortWhile thermal comfort is an important component inproviding excellent indoor environmental quality, thereis a growing body of research showing how affordingan occupant control over their environment signifi cantlyincreases an occupant’s tolerance for a wider range ofconditions.The HVAC system used in a building can affectthermal comfort by allowing Individual control of:– Air temperature;– Radiant temperature; and– Air movement (draught).The options assessed in this study provide varyingdegrees of individual control over thermal comfort,as follows.Figure 4.14:Extent of individual thermal comfort control foreach option.Available research regarding individual control thermalcomfort in the workplace indicates that:– occupants who have more control over factorsinfl uencing thermal comfort are generally more satisfi edwith their indoor environment and more productive;– occupants with individual control over factors infl uencingthermal comfort tolerate a wider range of internalconditions and temperatures; and– there is a fairly linear relationship between the levelof individual control afforded to occupants over theirinternal environment and the increase in perceivedcomfort, satisfaction and productivity. This is true bothfor the extent of individual control (whether or not it isshared) and the number of thermal comfort variablesthat can be adjusted to suit the user’s preferences.The benefi ts of individual control of thermal comfortfrom each system are as follows.Figure 4.15:<strong>Summary</strong> of benefi ts allocated for individual controlof thermal comfort.Figure 4.13: Optimistic assessment ofcost savings associated with variations inthermal comfortImpact of improved thermal comfortEstimated savings for each option compared with Base OptionCost/Benefit Option 1 Option 2 Option 3 Option 4 Option 5Base%$ %$%$%$%Option impact saved impact saved impact saved impact saved impact(fromchapter 2)$savedAbsence due to injury caused by offi ce environment $8.00 0% 0% $0.00 0% $0.00 00% $0.00 12% $0.96 -16.0% -$1.28Staff turnover due to dissatisfaction with workplace $5.00 0% 0.0% $0.00 0.0% $0.00 0.0% $0.00 60.0% $3.00 -100.0% -$5.00Increase in productivity (staff cost equals $6,090/m² NLA) $6,090 0% 0% $0.00 0% $0.00 0% $0.00 0.75% $45.68 -1.25% $76.13Total Cost Saving ($/m²/year) $0.00 $0.00 $0.00 $0.00 $49.64 -$82.41Figure 4.14: Extent of individual thermalcomfort control for each optionExtent of Individual ControlVariable Air VolumeOption 1Displacementwith reticulationOption 2Displacement with100% fresh airOption 3Chilled BeamsOption 4Chilled CeilingsOption 5Natural VentilationAir Movement None Control overair movement for each userControl overair movement for each userNone None Around 15% of occupantshave control over aperturesAir Temperature None None None None None Zoned control of heatingprovides some control foreach group of fourRadiant Temperature None None None None None NoneFigure 4.15: <strong>Summary</strong> of benefits allocated forindividual control of thermal comfortThermal Comfort Attributes AddressedExtrapolated impact from each optionBaseOption Option 1 Option 2 Option 3 Option 4 Option 5 Justification for changeStaff Turnover due to Dissatisfaction with Workplace 0% 25% 25% 0% 0% 20% Individual control and shared individual control of air movement andtemperatures for these options is considered to satisfy some of thoseoccupants dissatisfi ed with their work environmentIncrease in productivity 0% 0.31% 0.31% 0% 0% 0.35% Dissatisfi ed occupants are considered to be 5% less productive thansatisfi ed occupants. Individual control of air movement and temperaturecan offset the productivity loss of dissatisfi ed occupants16
4.4.1 Conservative approachA conservative assessment is that the provision ofvarious types of individual thermal comfort controlscan reduce costs by as much as $20/m 2 /year.Figure 4.16:Cost benefit summary of individual thermal comfort control.4.4.2 Optimistic approachAn optimistic assessment is that the provision of varioustypes of individual thermal comfort controls proposed bythis study could reduce costs by as much as $77/m 2 /year.Figure 4.17:Optimistic cost benefi t analysis of individual thermalcomfort control provisions.4.5 <strong>Summary</strong> of impacts from improved IEQ4.5.1 Annual IEQ cost impacts of HVACdesign optionsThe total IEQ cost impacts of alternative designs basedon the fi ndings are summarised as follows:Figure 4.18:<strong>Summary</strong> of annual IEQ cost impacts for design options.– From a conservative assessment, displacementventilation which includes individual control achievesthe highest annual return, signifi cantly higher thanchilled surface technology, which is also a signifi cantimprovement in return on the base case. Naturalventilation generates a loss in annual income whencompared conservatively with the base case.– When an optimistic appraisal of cost impacts iscarried out, all options return signifi cant annual costsavings when compared with the Base Option. Whiledisplacement with fresh air clearly provides the highestreturn, chilled element technology performs better thandisplacement with minimum fresh air.– Even conservative estimates of savings for all airconditionedalternatives indicate a signifi cant magnitudeof savings available when compared with the base case.4.5.2 Breakdown of annual IEQ costimpacts of HVAC design optionsThe conservative estimates of the cost impacts alongeach IEQ principle are shown below.Figure 4.16: Cost benefit summary ofindividual thermal comfort controlImpact of improved thermal comfortEstimated savings for each option compared with Base OptionCost/Benefit Option 1 Option 2 Option 3 Option 4 Option 5Base%$ %$%$%$%Option impact saved impact saved impact saved impact saved impact(fromchapter 2)$savedStaff Turnover due to dissatisfaction with workplace $5.00 0% 25% $1.25 25% $1.25 0% $0.00 0% $0.00 20% $1.00Increase in productivity (staff cost equals $6,090/m² NLA) $6,090 0% 0.31% $18.88 0.31% $18.88 0% $0.00 0% $0.00 0.35% $21.32Total Cost Saving ($/m²/year) $0.00 $20.13 $20.13 $0.00 $0.00 $22.32Figure 4.17: Optimistic cost benefit analysis ofindividual thermal comfort control provisionsImpact of improved thermal comfortEstimated savings for each option compared with Base OptionCost/Benefit Option 1 Option 2 Option 3 Option 4 Option 5Base%$ %$%$%$%Option impact saved impact saved impact saved impact saved impact(fromchapter 2)$savedStaff Turnover due to dissatisfaction with workplace $5.00 0% 25% $1.25 25% $1.25 0% $0.00 0% $0.00 20% $1.00Increase in productivity (staff cost equals $6,090/m² NLA) $6,090 0% 1.25% $76.13 1.25% $76.13 0% $0.00 0% $0.00 -1.02% $62.12Total Cost Saving ($/m²/year) $0.00 $77.38 $77.38 $0.00 $0.00 $63.12Figure 4.18: <strong>Summary</strong> of annual IEQ costimpacts for design optionsConservative and Optimistic estimates ofannual cost impacts of design options ($/m 2 NLA)BaseOption Option 1 Option 2 Option 3 Option 4 Option 5Conservative estimate of annual savings $0 $22 $33 $8 $8 -$5Optimistic estimate of annual savings $0 $86 $248 $114 $163 $15117
Figure 4.19:Conservative breakdown of IEQ impacts ($/m 2 NLA/year).When considered optimistically, the results are quitedifferent, as shown below.Figure 4.20:Optimistic breakdown of IEQ impacts ($/m 2 NLA/year).4.5.3 Consideration of IEQ cost impactsover a period of timeAssuming a discount rate (interest rate on moniesborrowed) of 7% and 3% Infl ation rate, the data shownin Figure 21 provides an indication of the net presentvalue of cost savings from design options over avariety of time frames.Figure 4.21:<strong>Summary</strong> of conservative and optimistic NPV of IEQbenefi ts ($/m 2 NLA/year).These results show that even using a conservativeassessment of benefi ts, alternative air-conditioningstrategies have the potential to bring signifi cant costbenefi ts to a development over typical life cycles.For example, a design incorporating chilled beams(Option 3) is estimated to return a net present benefi tof $66/m 2 NLA after a period of 10 years. This meansthat if the premium for chilled beams at the time ofpurchase was less than $66/m 2 NLA, then the benefi tsof improved IEQ would pay for that investment in lessthan 10 years.4.5.4 Comparison of IEQ benefits withGreen Star and LEED weightingsFor interest, this study compared the cost savingsestimated with the proportionate performance of eachcategory in the IEQ component of two well knownrating schemes – LEED (v2.1) and Green Star (v2.0),considering two key relationships between the studyand those rating tools:– the relative difference between IEQ savings providedby each option compared and the points awardedacross the category for each option; and– the way in which rating schemes refl ect the impactof different IEQ considerations compared with actualpredicted savings as a result of addressing eachcomponent.The fi ndings from this brief and fairly agricultural revieware as follows:– Green Star Scores are generally in proportion toOptimistic estimates from this study, with a slight underratingof the outcome found to be the most effective;– LEED, which generally has a low proportion of pointsallocated to these IEQ issues, generally would seemto overrate the benefi ts of displacement with minimumfresh air rates (Option 1) and natural ventilation (Option 5);Figure 4.19: Conservative breakdown of IEQimpacts ($/m 2 NLA/year)Conservative breakdown of IEQ benefits ($/m 2 NLA)BaseOption Option 1 Option 2 Option 3 Option 4 Option 5Ventilation Rates $0 $0 $11 $7 $7 $11Ventilation Effectiveness $0 $2 $2 $1 $1 $2Thermal Comfort $0 $0 $0 $0 $0 -$40Individual Control of Comfort $0 $20 $20 $0 $0 $22Total Conservative Annual Benefi t $0 $22 $33 $8 $8 -$5Figure 4.20: Optimistic breakdown of IEQimpacts ($/m 2 NLA/year)Optimistic breakdown of IEQ benefits ($/m 2 NLA)BaseOption Option 1 Option 2 Option 3 Option 4 Option 5Ventilation Rates $0 $0 $162 $110 $110 $162Ventilation Effectiveness $0 $8 $8 $4 $4 $8Thermal Comfort $0 $0 $0 $0 $50 -$82Individual Control of Comfort $0 $77 $77 $0 $0 $63Total Conservative Annual Benefi t $0 $86 $247 $114 $163 $151Figure 4.21: <strong>Summary</strong> of conservativeand optimistic NPV of IEQ benefits($/m 2 NLA/year)ValueNet Present Value of IEQ benefits after a set operating periodPresentBaseOption Option 1 Option 2 Option 3 Option 4 Option 5Conservative assessment after 10 years $0 $181 $269 $66 $66 -$37Conservative assessment after 20 years $0 $305 $452 $111 $111 -$63Optimistic assessment after 2 years $0 $154 $460 $211 $305 $277Optimistic assessment after 5 years $0 $365 $1,087 $499 $721 $655Optimistic assessment after 10 years $0 $666 $1,985 $912 $1,317 $1,19718
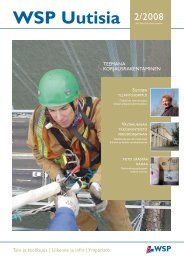
– both rating tools would appear to be based on apremise that offi ce spaces are air-conditioned asstandard, making it diffi cult to account for the negativethermal comfort impacts associated with a naturalventilation system.To review the two in more detail, Figure 4.22 comparesthe conservative and optimistic proportionate savings forthe four key IEQ principles (ventilation rates, ventilationeffectiveness, thermal comfort and individual comfortcontrol) with the corresponding points available for each.Figure 4.22:Percentage of cost benefi t or points allocatedto IEQ principle.This graph indicates the following trends:– based on the fi ndings of this report, both Green Starand LEED would appear to overestimate the benefi t ofimproved ventilation effectiveness. Note, however, thatthis report only allows modest productivity gains forimproved ventilation effectiveness due to the reducedavailability of research regarding this issue, and thatintuitively, the benefi ts should be greater;– based on the fi ndings of the report, Green Star andLEED overestimate the benefi t of thermal comfort,or perhaps more accurately, by setting the minimumthermal comfort benchmark at the level provided bya code compliant air-conditioning system, miss outon properly accounting for the thermal comfort issuesassociated with natural ventilation;– the impact of ventilation rates is quite well addressed byGreen Star and grossly underestimated by LEED, whichdoes not allocate points to improving fresh air deliveryrates at all;– individual control of thermal comfort is fairly welladdressed by both rating schemes.Particularly given the potential savings available fromimproved health and productivity across the four IEQcategories, the general impression would be that theirimpact is underestimated by LEED in particular, andalso to an extent by Green Star. LEED only awards amaximum of 20% of IEQ points to the selection of theHVAC system, which is probably too low. Green Starawards a maximum of 41%, which may or may notbe a little low.Generally, Green Star would seem to be adequate atfairly interpreting the benefi t of different IEQ initiativesthrough points, whilst LEED is borderline, probablyinadequate. A recommendation for both rating toolswould be to change thermal comfort targets to refl ectthe productivity benefi t of providing minimum levelsof temperature control, as well as to increase theproportion of points available for outside air ratesas compared with ventilation effectiveness.%100Figure 4.22: Percentage of cost benefitor points allocated to IEQ principleVentilation RatesVentilation EffectivenessThermal ComfortIndividual Control of Comfort9080706050403020100Conservative Optimistic Green Star LEED19
5Fulleconomicanalysis_This section of the study integrates the cost benefi tsobtained from alternative HVAC designs in chapter 4with the capital cost and energy cost values taken foreach option in chapter 3.Through conservative and optimistic life cycle assessmentsof the impact of the design options based on capitalcosts, energy costs and IEQ cost impacts, the aim is tocommunicate the extent to which design options couldtheoretically generate a return on investment.The assessment assumes a Discount Rate (rate ofreturn that could be realistically achieved over the timeperiod from money saved in capital costs in the present)of 7% and an Infl ation Rate (rate at which the cost ofelectricity, gas and wages will increase on averageper year over the estimated time frame) of 3%.The values are measured in $/m 2 NLA. A negative costindicates a saving over the specifi ed time period.5.1.1 Conservative cost benefit analysisA conservative cost benefi t analysis of each optioncompared with the Base Option after 10 years and20 years shows that all design options recover thecapital cost premiums associated with them after10 years, with the exception of Option 4 (which has avery high capital cost premium) and Option 5 (which hasa lower capital cost than the Base Option to begin with).Figure 5.1:Conservative estimate of cost in present dollar termsof design options ($/m 2 NLA).5.1.2 Optimistic cost benefit analysisAn optimistic cost benefi t analysis of each optioncompared with the Base Option after 2, 5 and 10years shows all design options recover the capitalcost premiums associated with them within two years.Figure 5.2:Optimistic estimate of cost in present dollar terms ofdesign options ($/m 2 NLA).The results of both conservative and optimistic life cycleassessments also indicate that the energy savings andcapital cost savings generated by a naturally ventilatedoffi ce space (rather than an air-conditioned space)outweigh the ongoing productivity costs of a spacewhich has a reduced thermal comfort, particularly ifsome level of individual control is afforded to occupantsover heating and air movement. Indeed, based onthis analysis and on a raw cost assessment, naturalventilation would seem, over the medium term at least,to be the preferred design option in terms of life cyclecost. Note this is dependent on the building being in aclimate suited to the use of natural ventilation.The best value air-conditioned option over the mediumand long term, based on both assessments, is Option 2– Displacement Ventilation with 100% fresh air, despitea capital cost premium of $119/m 2 NLA compared withthe Base Option of VAV.The chilled element systems also perform comparativelybetter based on the optimistic assessment, becausemore credit is attributed to the benefi t of increasingminimum outside air rates.Base Option Option 1 Option 2 Option 3 Option 4 Option 5 $100Figure 5.1: Conservative estimate of costin present dollar terms of design options($/m 2 NLA)0-100Comparative cost inpresent dollar termsof design optionafter 20 years ($/m 2 )Comparative cost inpresent dollar termsof design optionafter 10 years ($/m 2 )-200-300-400Figure 5.2: Optimistic estimate of costin present dollar terms of design options($/m 2 NLA)Cost in present dollarterms of design optionafter 10 years ($/m 2 )Base Option Option 1 Option 2 Option 3 Option 4 Option 5 $0-500-1000Cost in present dollarterms of design optionafter 5 years ($/m 2 )-1500Cost in present dollarterms of design optionafter 2 years ($/m 2 )-200020
6Conclusion_This study interprets research and laboratory studiesto put both conservative and optimistic savingsbenchmarks around some of the more typical HVACdesign alternatives currently being investigated in themarketplace.It ranks six HVAC systems on the basis of:– Capital cost;– Energy costs;– Impact on occupant health and productivity(measured in dollars); and– Overall cost incorporating all of the above.6.1 Capital costsOn the basis of capital costs, the options consideredby this study can be ranked as follows:1. Option 5 (Natural Ventilation)2. Base Option (Variable Air Volume)3. Option 3 (Chilled Beams with 100% outside air)4. Option 1 (Displacement with minimum outside air rates)5. Option 2 (Displacement with 100% outside air)6. Option 4 (Chilled Ceilings with 100% outside air).Capital costs are the best indication as to why the BaseOption is currently the most common design solution.With the exception of natural ventilation, which wouldnot meet the brief of a client desiring a Grade-A qualityspace, the Base Option is the least expensive optionin terms of capital costs.Given that in the vast majority of cases, the capital costof building services is not paid for by the same entityas the energy costs or salaries, it is natural for developersto drive the lowest-capital cost outcome for newcommercial buildings.However, this list also provides an important insightinto how the tenants control minimum targets,because comfort levels provided by natural ventilationsystems are generally not considered acceptable forcommercial buildings.6.2 Energy costsOn the basis of energy costs, the options considered bythis study can be ranked as follows:1. Option 5 (Natural Ventilation)2. Option 3 (Chilled Beams with 100% outside air) andOption 4 (Chilled Ceilings with 100% outside air)3. Option 1 (Displacement with minimum outside air rates),Option 2 (Displacement with 100% outside air) and theBase Option (Variable Air Volume).Chilled element technology generally has the potentialto deliver reduced energy consumption compared withthe other air-conditioned options, mainly due to theuse of water as the primary medium for removing heatinstead of air. These systems typically have much lowerfan energy, allowing for greater effi ciencies in operation.Energy effi ciency is one of the key drivers behind chilledbeams in the Sydney market at the moment.Option 2 would normally have a higher rate of energyconsumption than Option 1, but they are considered tohave an equivalent rate of energy consumption becausethe capital costs for Options 1, 2 and the Base Optioninclude plant required to deliver a minimum 4.5 StarABGR outcome.All options are heavily infl uenced by climate. Theserankings are based on the climate in Sydney, Australia.21
6.3 Impact on health and productivityObviously a line similar to that of capital costs orenergy costs is not as easy to draw. But the fi ndingsindicate generally that even conservative estimates ofproductivity benefi ts can deliver important savings.On the basis of impact on health and productivity coststhe options considered by this study could be taken asbeing ranked as follows:1. Option 2 (Displacement with 100% outside air)2. Option 4 (Chilled Ceilings with 100% outside air)3. Option 3 (Chilled Beams with 100% outside air)4. Option 1 (Displacement with minimum outside air rates)5. Option 5 (Natural Ventilation)6. Base Option (Variable Air Volume).Option 2, Full fresh air displacement ventilation is a clearwinner when it comes to the provision of excellent indoorenvironmental quality.The rankings of Options 3, 1 and 5 could be rearrangedbased on subjectivity and what health issues wereconsidered as most important. Natural ventilation isconsidered as the poorest alternative mainly because ofthe large negative imposed by reduced thermal comfort,but this study clearly found that this impact is off-set byimprovements through better air quality and control overcomfort parameters.What is most clear is that the Base Option delivers thepoorest performance when indoor environment is usedas the primary benchmark. This should be of concernto almost all tenants in commercial buildings in Australia.The standard practice for HVAC systems in commercialoffi ce buildings in Australia would appear to be wellbelow par and compromising the bottom line of thosetenants. Ironically, based on the research, tenants wouldprobably be better off with a well-designed naturallyventilated building in terms of occupant wellbeing thanone with an air-conditioning system designed to codeto provide that comfort.6.4 Overall ranking of optionsIt is reasonable to presume that capital cost, energyconsumption and occupant health and productivitymight be equally ranked in importance by a new tenantadopting a triple-bottom-line approach to the selectionof new accommodation.Applying an equal rating to all criteria (capital cost,energy cost, IEQ benefi t), a reasonable overall rankingof each of the options reviewed by this study couldbe determined as follows:Figure 6.1:Overall ranking of each option.Based on this methodology, Natural Ventilation (Option5) is a clear winner, with Chilled Beams (Option 3) thepreferred of the air-conditioned options, and with allalternatives equal to or better than the Base Option. It iseasy to see why chilled beams are the current alternativeof preference, offering a relatively sympathetic capitalcost impact while still delivering good energy andIEQ outcomes.If it is accepted that air conditioning must be provided,then we must exclude Natural Ventilation as analternative. In this instance, Displacement Ventilationwith full fresh air and Chilled Beams (Options 2 and3) deliver the best outcomes when all considerations(capital cost, energy and productivity/health gains)are weighted equally.This leans more heavily in favour of full fresh airDisplacement Ventilation (Option 2) where the NetPresent Value of each option is compared usinga conservative life cycle review. This is due tothe increased magnitude of savings attributableto productivity and health benefi ts as comparedwith energy savings.Figure 6.1: Overall ranking of each optionScore by rank in each criteriaBaseOption Option 1 Option 2 Option 3 Option 4 Option 5Capital Cost 5 3 2 4 1 6Energy Costs 2 2 2 3 3 6Health and Productivity Benefi t 1 3 6 4 5 2Overall Score 8 8 10 11 9 14Who we areLincolne Scott is a building services and environmentalengineering consultancy that is recognised for itsleadership, innovation, integrity and vision across theAsia Pacifi c region.Lincolne Scott works closely with clients to makeprojects work successfully. Success is judged againstenvironmental and commercial outcomes and thisbalanced approach is fundamental to achieving newindustry benchmarks and innovation. Integration and22
When the Net Present Value of each option is comparedusing an optimistic appraisal of productivity and healthgains, then the options which deliver the best IEQperformance are clear winners, with all options offeringimprovement and long-term savings over an industrystandard VAV system.Again, these fi ndings stress the impact of market leverson the selection of options. Capital cost is the keydriver behind the selection of air-conditioned outcomes,despite the fact that using other criteria, the cheapestoption would seem to fail to deliver in the short tomedium term.6.5 Other conclusions – rating schemesThe study compared calculated savings for IEQ benefi tswith the way that popular green building rating systemsGreen Star and LEED weigh the importance of indoorenvironmental quality initiatives associated with HVACsystem design.Both rating tools, by operating on an assumptionthat commercial buildings assign air conditioning asstandard, over-rated the benefi ts of a naturally ventilatedsolution, and seems to have over-estimated the benefi tsprovided by ventilation effi ciency.But generally, Green Star would seem to be adequateat fairly interpreting the benefi t of different IEQ initiativesthrough points, while LEED is borderline, probablyinadequate.It is recommended that both rating tools changethermal comfort targets to refl ect the productivitybenefi t of providing minimum levels of temperaturecontrol, as well as to increase the proportion of pointsavailable for outside air rates as compared withventilation effectiveness.Office locationsAdelaideLevel 1911 Waymouth Street AdelaideGPO Box 1968 Adelaide 5001South Australia 5000 AustraliaTelephone 61 8 8110 9500Facsimile 61 8 8110 9599adelaide@lincolnescott.comAucklandLevel 4, 205 Queen Street AucklandPO Box 68-810 Newton1010 New ZealandTelephone 64 9 966 4455Facsimile 64 9 966 4444BangkokLevel 27, Fortune TownOffi ce Building,1 Ratchadaphisek Road,Dindaeng, Dindaeng DistrictBangkok, 10400 ThailandTelephone66 2 642 1034-5, 642-1246Facsimile 66 2 642 1218bangkok@lincolnescott.comBrisbane1 Gardner ClosePO Box 2227 MiltonQueensland 4064 AustraliaTelephone 61 7 3368 6600Facsimile 61 7 3368 6699brisbane@lincolnescott.comCairnsSuite 6, 22 Lily StreetPO Box 650N North CairnsQueensland 4870 AustraliaTelephone 61 7 4051 2299Facsimile 61 7 4051 2392cairns@lincolnescott.comCanberraLevel 1, 3 Hobart PlaceGPO Box 1551Canberra ACT 2600 AustraliaTelephone 61 2 6201 9600Facsimile 61 2 6201 9666canberra@lincolnescott.comHonoluluSuite 1850, 1132 Bishop StreetHonolulu Hawaii 96813United States of AmericaTelephone 1 808 536 1737Facsimile 1 808 537 5829honolulu@lincolnescott.comMelbourneLevel 5, Midtown Tower246 Bourke Street MelbourneVictoria 3000 AustraliaTelephone 61 3 8663 7880Facsimile 61 3 8663 7800melbourne@lincolnescott.comPerth35 Ventnor AvenueWest Perth 6005 Western AustraliaPO Box 516 West PerthWestern Australia 6872 AustraliaTelephone 61 8 9426 4900Facsimile 61 8 9481 1279perth@lincolnescott.comSan DiegoSuite 1410, 401 West A StreetSan Diego California 92101United States of AmericaTelephone 1 619 233 3733Facsimile 1 619 233 3735sandiego@lincolnescott.comSingapore150 Cecil Street #15-01Singapore 069543Telephone 65 6222 3963Facsimile 65 6222 0781singapore@lincolnescott.comSydneyLevel 1, 41 McLaren StreetPO Box 6245 North SydneyNew South Wales 2060 AustraliaTelephone 61 2 8907 0900Facsimile 61 2 9957 4127sydney@lincolnescott.comcollaboration are key elements of design and deliveryat Lincolne Scott. A way of working which has seenLincolne Scott’s involvement in the design of Australia’sfi rst 6 Star Green Star building, CH2; Australia’s fi rst5 Star Green Star As Built building, 30 The Bond; andHawaii’s fi rst LEED Platinum building, The NELHAGateway Energy Centre. Amongst many other worldfi rsts, Lincolne Scott was also the building servicesand environmental engineers behind Australia’s fi rstRIBA Lubetkin Award winning Southern Cross Station.Advanced Environmental is a specialist service ofLincolne Scott focussed on delivering environmentallysustainable engineering solutions for the built environment.Vision Design is a collective of expert designers who customiselight solutions to aesthetically lift the built environment.Lincolne Scott continues to be driven by strong corporateethics and corporate responsibility, and was the fi rstcompany in the Asia Pacifi c to become climate neutralacross their Australian and Asian-Pacifi c network of offi ces.Lincolne Scott is a <strong>WSP</strong> <strong>Group</strong> company, who are listedon the London Stock Exchange.precinct.com.au23
lincolnescott.com