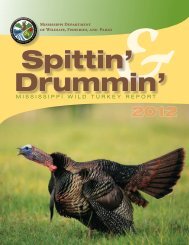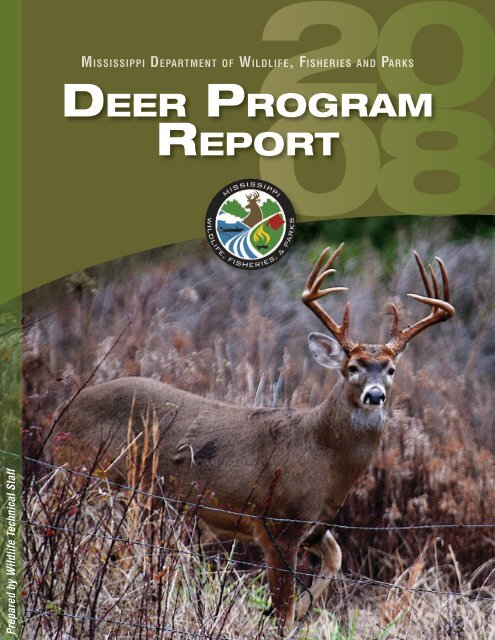
DEER PROGRAM REPORT
DEER PROGRAM REPORT
DEER PROGRAM REPORT

You also want an ePaper? Increase the reach of your titles
YUMPU automatically turns print PDFs into web optimized ePapers that Google loves.
MississippiDeer Program Report2008Mississippi Department of Wildlife, Fisheries and Parks1505 Eastover Drive | Jackson, MS 392112007-2008 Mississippi Deer Program Report
ii2007-2008 Mississippi Deer Program Report
DedicationThis and all future Deer Data Books are dedicated to Bill Lunceford.On September 20, 2007, the Mississippi Department of Wildlife, Fisheries, and Parks and the sportsmen of Mississippi lost ahero. William (Bill) Lunceford passed away as a result of complications due to a previous injury. Bill became a quadriplegic after a divingaccident in 1979. After rehabilitation, he came back to work with the MDWFP, as the Deer Management Assistance Program (DMAP)Coordinator. He filled this role until his retirement on June 30, 2006. The work he completed in his position is immeasurable. Using amouthpiece, wooden dowel, and large eraser, he typed faster than most of the staff. His knowledge of computer programs combinedwith deer management experience made the rest of the staff’s roles easier. He combined the DMAP data for the entire state annually andproduced reports to assist the field biologists in making better deer management decisions. The data and reports eventually becamethe Deer Program Report. His work has impacted millions of acres of deer habitat in the state. He also assisted other states with theimplementation of DMAP programs.Bill was a man of Christian values, strong work ethic, and immense knowledge. It was impossible to not make friends with him.After his accident, he continued his passion of hunting deer. He designed a rifle mounted on a football helmet, with trigger activationby solenoid from a mouthpiece. He was a crack shot with this weapon, bagging several deer, and designed several versions in differentcalibers.Bill traveled the state to give motivational speeches. He proved that adversity can be overcome. You just have to want to. Many liveshave been touched, and changed, by Bill’s time on Earth. As a firm believer, Bill can now walk again.You will be missed.In Memory of Bill Lunceford1945 - 20072007-2008 Mississippi Deer Program Report iii
2008G o v e r n o r o f M i s s i s s i p p iHaley BarbourL i e u t e n a n t G o v e r n o rPhil BryantS e n a t eWildlife, Fisheries, & Parks CommitteeTommy A. GollottChairman, BiloxiSidney AlbrittonPicayuneCindy Hyde-SmithBrookhavenEric PowellCorinthBilly HudsonVice-Chairman, PurvisBob M. DearingNatchezEzell LeePicayuneBill StoneAshlandMerle FlowersSouthavenChris McDanielEllisvilleGary TollisonOxfordH o u s e o f R e p r e s e n t a t i v e sWildlife, Fisheries, & Parks CommitteeBlaine “Bo” EatonChairman, TaylorsvilleDeryk R. ParkerVice-Chairman, LucedaleBrian AldridgeAshlandTracy ArinderMortonC. Scott BoundsPhiladelphiaBryant W. ClarkPickensAngela CockerhamMagnoliaMark DuVallMantachiePhilip GunnClintonSteven A. HorneMeridianBennett MaloneCarthageWarner F. McBrideCourtlandAmerica (Chuck)MiddletonPort GibsonBilly NicholsonLittle RockSteve PalazzoBiloxiJohn C Stanley IVChairman, CorinthC o m m i s s i o n o n W i l d l i f e , F i s h e r i e s , a n d P a r k sBryan JonesVice Chairman,Yazoo CityJerry MunroeBiloxiCharles RigdonColumbusSam Polles, Ph.D.Executive DirectorAl TuckDeputy DirectorA d m i n i s t r a t i o nRobert L. CookDeputy AdministratorDon BrazilDirector of LawEnforcement, Wildlife,and Fisheriesiv2007-2008 Mississippi Deer Program Report
Table of ContentsDedication.......................................................................................................................................................................................................iiiGovernor and Legislative Committees.............................................................................................................................................................ivCommission on Wildlife, Fisheries, and Parks.................................................................................................................................................ivTable of Contents..............................................................................................................................................................................................vAcknowledgments...........................................................................................................................................................................................viIntroduction..................................................................................................................................................................................................... 1Wildlife Technical Staff Directory ................................................................................................................................................................. 2-3Wildlife Management Areas ........................................................................................................................................................................ 4-5Wildlife Management Area Directory............................................................................................................................................................ 6-7Wildlife Management Area Harvest Information.............................................................................................................................................. 8Wildlife Management Area Narratives......................................................................................................................................................... 9-19Regional Narratives.................................................................................................................................................................................. 20-23Road Kill Survey Data.................................................................................................................................................................................... 24Depredation................................................................................................................................................................................................... 25Chronic Wasting Disease.......................................................................................................................................................................... 26-27Epizootic Hemorrhagic Disease................................................................................................................................................................ 28-29Statewide Deer Herd Health Evaluations................................................................................................................................................... 30-34Statewide Sex Ratio and Fawn Crop Estimates.............................................................................................................................................. 35Deer Tags.................................................................................................................................................................................................. 36-37Antler Regulations......................................................................................................................................................................................... 38High Fenced Enclosures................................................................................................................................................................................ 39Deer Management Assistance Program.................................................................................................................................................... 40-43Statewide DMAP Data............................................................................................................................................................................... 44-45Mississippi Soil Resource Area Map ............................................................................................................................................................. 46Batture Soil Resource Area Summary of DMAP Data.................................................................................................................................... 47Delta Soil Resource Area Summary of DMAP Data........................................................................................................................................ 48Upper Thick Loess Soil Resource Area Summary of DMAP Data.................................................................................................................. 49Lower Thick Loess Soil Resource Area Summary of DMAP Data.................................................................................................................. 50Upper Thin Loess Soil Resource Area Summary of DMAP Data................................................................................................................... 51Lower Thin Loess Soil Resource Area Summary of DMAP Data.................................................................................................................... 52Black Prairie Soil Resource Area Summary of DMAP Data ........................................................................................................................... 53Upper Coastal Plain Soil Resource Area Summary of DMAP Data................................................................................................................. 54Lower Coastal Plain Soil Resource Area Summary of DMAP Data................................................................................................................ 55Coastal Flatwoods Soil Resource Area Summary of DMAP Data................................................................................................................... 56Interior Flatwoods Soil Resource Area Summary of DMAP Data.................................................................................................................. 57Enforcement of Deer-related Citations........................................................................................................................................................... 58Citations Summary by County....................................................................................................................................................................... 59Hunting Incident/Accident Summary........................................................................................................................................................ 60-612007-2008 Research Project Summaries................................................................................................................................................. 62-65Magnolia Records Program........................................................................................................................................................................... 66Pope and Young Record Non-typical Deer..................................................................................................................................................... 67Pope and Young Record Typical Deer............................................................................................................................................................ 67Boone and Crockett Record Non-typical Deer................................................................................................................................................ 68Boone and Crockett Record Typical Deer....................................................................................................................................................... 68Status............................................................................................................................................................................................................ 70Recommendations......................................................................................................................................................................................... 712007-2008 Mississippi Deer Program Report
AcknowledgementsNumerous people are responsible for the information presented in this report. The vision and work of Mississippi Game and Fish Commissionpatriarchs like Fannie Cook and Bill Turcotte initiated plans in the 1930’s that ultimately provided Mississippi Sportsmen with thedeer population we enjoy today.Leaf River Refuge Manager Quinton Breeland, Upper Sardis Refuge Manager Garald Mize, and other dedicated Commission employeesprotected, trapped, and relocated hundreds of deer throughout the state during the days of Mississippi’s deer restoration. In addition, gamewardens of the deer restoration era protected a growing deer population through the early period of wildlife conservation. During this timein the history of Mississippi’s Wildlife Management Agency, game wardens provided their own gun and vehicle. Mobile communication withother officers was little more than a futuristic dream. Wildlife enforcement, or the game warden that interfered with the “jacklighting” of deerand illegal harvest of game, was not a welcome sight to some hunters at that time. Refuge managers and game wardens of the restorationera are pioneers of the deer population restoration success of today.Today the conservation officer is considered differently. Most men and women who enjoy the bountiful wildlife that exist today regard theconservation officer as a partner in wildlife conservation. As those who are responsible for the deer populations we treasure are remembered,the conservation officers of today should not be forgotten.The Mississippi Legislature is also to be thanked for their historic and sustained funding of this agency. Since the establishment of theGame and Fish Commission in the days of the Great Depression, the Mississippi Legislature has funded efforts necessary for the wildlifeconservation success story of the white-tailed deer.Mississippi landowners have made deer in the Magnolia State a reality. Without landowner desire to have deer, most agency efforts wouldhave proved ineffective. Those of us who hunt, study, or admire the white-tailed deer truly thank you.This report would not have been possible without the efforts and cooperation of the Mississippi Department of Wildlife, Fisheries, andParks (MDWFP) wildlife bureau technical staff and field personnel. An extra-special appreciation is extended to Dene Smith for assistancewith many aspects of producing and mailing this report and to Cindy W. Clark who was responsible for the report design. Also, a specialthanks to Rick Dillard who coordinates the Magnolia Records Program on his own time.Additionally, Mississippi’s deer hunters deserve special recognition. Your data collection efforts, concern, and support for white-tailed deerare vital to the success of the White-tailed Deer Program.Look for this information on www.mdwfp.com/deer. If you have any questions, feel free to contact us.Cover photo courtesy of Christopher Shea (christophershea.net).Special thanks and recognition goes out to Bill Lunceford. Bill had the vision and foresight to put the first DMAP Annual Report togetherin 1988. In 1993 the report changed to the Mississippi Deer Data book. Without Bill’s vision of the DMAP program and the DeerData Book, today’s report would not have been possible.Chad DacusDeer ProgramCoordinatorAmy BlaylockRegional DeerBiologistChris McDonaldRegional DeerBiologistWilliam T. McKinleyRegional DeerBiologistLann WilfRegional DeerBiologistFEDERAL AID IN WILDLIFERESTORATIONA PITTMAN-ROBERTSONFUNDED PROJECTThis report is produced by the Technical Guidelines Project, Statewide Wildlife Development Project and Statewide Wildlife InvestigationsProject and is primarily funded by Federal Aid in Wildlife Restoration.vi2007-2008 Mississippi Deer Program Report
IntroductionPhoto by Christopher SheaWhite-tailed Deer Program Report2007-2008The first Deer Management Assistance Program (DMAP) report was completed in 1988. The DMAP report evolved into the Mississippi DeerProgram Report in 1992. Since its inception, the purpose of this report was to consolidate all deer-related information obtained by theMississippi Department of Wildlife, Fisheries, and Parks (MDWFP) personnel. Compilation of these data provides managers the opportunityto analyze trends in deer harvest and physiological condition. In the future, managers will have a chronicled reference to more effectivelycritique effects of changes in season framework, hunter success, and climatic conditions on the deer population.Decision makers such as the Mississippi Legislature and the Mississippi Commission on Wildlife, Fisheries, and Parks have served thesportsmen of the state well. Deer harvest and management opportunities exist today that were considered far-fetched twenty years ago.Deer hunting regulations are subject to change each year.Annual mail surveys are used to monitor trends in hunter harvest and effort. There is a 2 year lag in reporting mail survey data. The 2007Deer Program Report contained the mail survey data from the 2005-2006 hunting season. There was no mail survey conducted following the2006-2007 hunting season. Hopefully a survey will be conducted following the 2007-2008 hunting season so this trend data can continue tobe reported.The MDWFP began using a new computer summary program (XtraNet) in 2004-2005. Data from 2001-2008 was analyzed using XtraNet,while data prior to 2001 was analyzed using DeerTrax, the old computer summary program. This may be the cause for drastic differences insome numbers. Once all of the historic data is entered into the XtraNet system, the numbers are expected to fall along the same trend andeliminate the drastic drop in the graphs and tables. Additionally, all DMAP summary tables and graphs now include harvest reports fromWMAs that collect deer harvest data.Sample methods were unchanged for the following data sets:• Hunter effort and harvest information collected on state-operated WMAs• Employee observations of deer mortality due to motor vehicle collisions• Enforcement Bureau monitoring of deer hunting-related citations• Deer research projects conducted in cooperation with Mississippi State University Forest and Wildlife Research CenterDepartment wildlife biologists continued to inform and educate sportsmen relative to deer management needs and issues. Our goals areto provide insight into current deer management needs while providing the leadership to identify and guide future issues. All known mediasources were utilized in this process. In addition, public presentations were made to hunting, civic, and conservation groups throughout thestate. This report captures a portion of the informational and educational efforts.2007-2008 Mississippi Deer Program Report
Wildlife Technical Staff DirectoryAdministrative & Office StaffWildlife directoryLarry CastleWildlife Director601.432.2196larryc@mdwfp.state.ms.usRonald S. SeissAssistant Wildlife Director601.432.2213ron.seiss@mdwfp.state.ms.usDene SmithAdministrativeAssistant601.432.2300dene@mdwfp.state.ms.usJason PriceGIS Coordinator601.432.2123jasonp@mdwfp.state.ms.usCharlie “Buck”WelchGIS Specialist601.432.2122charliew@mdwfp.state.ms.usSmall GameDeer ProgramProgramChad M.DacusCoordinator601.432.2177chad.dacus@mdwfp.state.ms.usAmy C.Blaylock662.417.6005amycblaylock@gmail.comChrisMcDonald601.757.2313chrismcd@hughes.netWilliam T.McKinley662.582.6111williamm@mdwfp.state.ms.usLann M. Wilf662.299.1454lannw@mdwfp.state.ms.usRick Hamrick662.320.9345rickh@mdwfp.state.ms.usWaterfowl ProgramPrivate Lands Habitat ProgramEd PennyCoordinator601.432.2241scottb@mdwfp.state.ms.usKevin Brunke601.432.2242kevinb@mdwfp.state.ms.usHoustonHavens662.299.0273houston_havens@yahoo.comScott Edwards662.325.7490sedwards@cfr.msstate.eduJohn Gruchy662.274.1050john.gruchy@gmail.comRuss Walsh601.408.3399wrwalsh@gmail.com2007-2008 Mississippi Deer Program Report
Wildlife Technical Staff DirectoryWMA ProgramRandy SpencerWMA Coordinator601.432.2198randys@mdwfp.state.ms.usJeff MangrumMitigation LandsCoordinator601.737.5831owma@bellsouth.netScott Baker601.432.2241scottb@mdwfp.state.ms.usJackie Fleeman662.873.3497jfleeman@bellsouth.netJerry Hazlewood662.423.1455mdwfp@avsia.comBrad Holder662.832.2110bdholder@hotmail.comJoshua L. Moree601.835.3050jlmoree@gmail.comWildlife directoryAlligator/FurExotic SpeciesBlack BearWild Turkey ProgramBearer ProgramProgramProgramDave GodwinCoordinator662.325.5119dgodwin@cfr.msstate.eduJoe KoloskiNWTF/MDWFPCo-op Biologist601.824.2933jkoloskinwtf@yahoo.comAdam Butler601.695.6795butler@mdwfp.state.ms.usRicky FlyntCoordinator601.432.2217rickyf@mdwfp.state.ms.usRichard G.RummelProgram Leader601.432.2360richardr@mdwfp.state.ms.usBrad YoungProgram Leader601.432.2242brad.young@mdwfp.state.ms.usRegional Biologists ProgramJim WillcuttProgram Leader662.325.7490jwillcutt@cfr.msstate.eduMatt Brock601.723.0370mattbrock02@yahoo.comAshley Gary662.418.0290a.gary@gmail.comChad Masley662.322.7990chadmasley@hotmail.comAlan Mumbower601.941.1317mumbower@gmail.comRoger Tankesly601.540.5445rogertankesly@gmail.com2007-2008 Mississippi Deer Program Report
Wildlife Management AreasWMA Data2007-2008 Mississippi Deer Program Report
Wildlife Management Areas2007-2008summary of Wildlife Management Area (WMA) deer harvest and hunter activity is presented in Figure 1. The majority of data was collectedA from self-service permit stations. Mandatory check-in and harvest reporting is required from hunters on most WMAs.Throughout the year, conservationofficers monitor compliance of hunterschecking-in on WMAs. Differencesin compliance rates among WMAs areseen each year. These differences aremainly due to the degree of hunter acceptanceof the check-in system. Someconservation officers assigned to WMAshave informed hunters of the importanceof accurate check-in more than those onother areas. Also, some officers haveenforced the mandatory check-in regulationmore diligently. The size of a WMAand control of hunter access also affectscompliance rates.Some WMAs provide very restrictivehunting opportunities due to area size,habitat type, and management objectives.Location and soil region in whicha WMA occurs impacts deer productivity.Because of these factors, as well asother unique differences among areas,caution should be exercised in comparingdata among WMAs (Table 2).Figure 1Wildlife Management AreaReported Deer Harvestedand Hunter MandaysHunter man-days for the 2007-2008season increased from last year by approximately12,800. The 2006-2007 season showed the first increase in hunter effort in five seasons. We are now possibly beginning torecover from decreases in past seasons. Reasons for these decreases varied. Hurricane Katrina certainly decreased hunter activity, as didthe increase in fuel prices that followed the hurricane in 2005-2006. Hunter opportunity has generally remained stable or increased on mostWMAs; therefore, opportunity is not likely a causative factor of this decrease.Table 1. Wildlife Management Area AntlerCriteria for the 2007-2008 SeasonWildlifeManagementAreaBienvilleBlack PrairieCalhoun CountyCanal/John BellCaney CreekCaston CreekChickasawChickasawhayChoctawCopiah CountyDivide SectionHamerHell CreekJohn StarrMinimumAntlerCriteria12/1512/1512/154pt12/1512/1512/1512/1512/1512/1512/1515/184pt12/15WildlifeManagementAreaLake GeorgeLeaf RiverLeroy PercyLittle BiloxiMahannahMalmaisonMarion CountyMason CreekNanih WaiyaOkatibbeeO’KeefeOld RiverPascagoulaPearl RiverMinimumAntlerCriteria15/1812/1515/1812/1516/2015/1812/1512/154pt4pt15/1812/1512/154ptWildlifeManagementAreaRed CreekSandy CreekSardis WaterfowlShiplandStonevilleSunflowerTallahalaTuscumbiaTwin OaksUpper SardisWard BayouWolf RiverYockanookany*1st number indicates Inside Spread 2nd number indicates Main Beam Length*MinimumAntlerCriteria12/1512/154pt15/1815/1815/1812/154pt15/1812/1512/1512/1512/15Similar to hunter effort, total reportedharvest increased by 431 deer from lastseason (Figure 1). The 2007-2008 seasonwas the fourth and fifth seasonsthat many WMAs had minimum insidespread criteria for legal bucks. Beginningwith the 2007-2008 season, all WMAswith minimum inside spread criteria implementedminimum main beam lengthcriteria also (Table 1). A legal buck mustmeet either the minimum inside spreador the minimum main beam length.WMAs without an inside spread andmain beam criteria are noted on Table2 by an *. Harvest should continue toincrease for a few years before levelingoff. However, an increase in harvest canonly be expected if hunter effort remainsconstant or increases.Average success rate also increasedacross WMAs. Therefore, the increasedharvest may be partially attributed toincreased deer populations on WMAs.Other behavioral changes within thedeer herd are also likely culprits in theincreased harvest.WMA Data2007-2008 Mississippi Deer Program Report
Wildlife Management Area DirectoryEast CentralPaul WindhamWMA SupervisorLarry WaddellConservation OfficerNanih Waiya662.724.2770Randy AkinsConservation OfficerOkatibbee601.737.5831Brent BaucumWildlife ManagerOkatibbee601.737.5831Clayton LottConservation OfficerBienville601.469.5993Brian GordonWildlife ManagerTallahala601.739.3671Art BradshawConservation OfficerCaney Creek601.537.3555NortheastWMA DirectoryDoug EppsWildlife SupervisorJimmy DreweryWildlife ManagerTuscumbia662.284.0740David OverbyConservation OfficerDivide Section662.423.1455Clark AdamsConservation OfficerDivide Section662.862.2723Tim RyanConservation OfficerDivide Section662.423.1455Justin HughesConservationAssociate BiologistCanal Section662.862.2723John TignerWildlife ManagerJohn Bell Williams601.537.3555North CentralFord GrissettConservationAssociate BiologistJohn TaylorConservation OfficerChoctaw662.285.6928Wayne GordonWildlife ManagerJohn Starr Forest662.840.5172Steve ColemanConservation OfficerHell Creek662.685.4508Matt GrayConservation OfficerChickasaw662.447.0141Jack GriffinWildlife ManagerHell Creek662.685.4508Doug SwordsWildlife ManagerChickasaw662.447.0141NorthwestBobby YoungConservation OfficerUpper Sardis662.234.6125Vic TheobaldConservation OfficerSardis Waterfowl662.236.9762Donnie CainConservation OfficerCalhoun County662.628.6328Walt HardyConservation OfficerCharles Ray Nix662.563.6330Josh NunleyConservationAssociate BiologistCharles Ray Nix662.563.6330Dalton AdamsConservation OfficerMalmaison662.453.5409Robbie KiihnlConservation OfficerO’Keefe662.326.80292007-2008 Mississippi Deer Program Report
Wildlife Management Area DirectorySouthwestKallumHerringtonWMA SupervisorPatrick RushConservation OfficerOld River601.772.9024AJ SmithConservation OfficerCaston Creek601.384.3606Ricky McDanielConservation OfficerWolf River601.795.8682Mark ReidWildlife ManagerSandy Creek601.835.3050Med PalmerWildlife ManagerCopiah County601.277.3636Danny StringerConservation OfficerMarion County601.736.0066DeltaSoutheastWMA DirectoryStephen “Slim”ChandlerWMA SupervisorBobby HodnettConservation OfficerSunflower662.828.3456Jason KerrConservation OfficerSunflower662.828.3456Dwight MorrowWMA SupervisorBen HareWildlife ManagerPascagoula601.947.6376Michael EveretteConservation OfficerPascagoula228.588.3878Mitch GeoffWildlife ManagerPascagoula RiverBryanWilliamsonConservationAssociate BiologistHoward MillerMike ThompsonConservation OfficerShipland662.873.9331NathanielEmersonWildlife ManagerPearl River601.859.3421Ronnie HurstConservation OfficerChickasawhayTed HooperConservation OfficerMason Creek601.928.3720Jay LandrumWildlife ManagerChickasawhay601.344.0600Lynn McCoyWildlife ManagerWard Bayou228.826.1012Scottie JonesWMA SupervisorLee HarveyConservation OfficerMahannah601.636.2045Shannon ChunnWildlife ManagerMuscadineLe Don CooleyWildlife ManagerLeaf River601.598.2323Ronnie LeeWildlife ManagerLittle Biloxi601.928.3720Doyle BondWildlife ManagerRed Creek601.928.42962007-2008 Mississippi Deer Program Report
Table 2. Wildlife Management Area Harvest Informationfor the 2007-2008 SeasonWMA DataWildlife Total Buck Doe Total Mandays/ Mandays/Management Area Acreage Harvest Acres/Deer Harvest Acres/ Buck Harvest Acres/Doe Mandays Deer AcreBienvilleBlack PrairieCalhoun CountyCanal/John Bell*Caney CreekCaston CreekChickasawChickasawhayChoctawCopiah CountyDivide SectionHamerHell Creek*John StarrLake GeorgeLeaf RiverLeroy PercyLittle BiloxiMahannahMalmaisonMarion CountyMason CreekNanih Waiya*Okatibbee*O’KeefeOld RiverPascagoulaPearl River*Red CreekSandy CreekSardis Waterfowl*ShiplandStonevilleSunflowerTallahalaTuscumbia*Twin OaksUpper SardisWard BayouWolf RiverYockanookanyTOTAL25,3005,8259,88832,50030,90027,78528,31935,00024,3146,58315,3363,9092,5008,2448,38341,4112,20014,98012,67510,0167,20027,3467,6556,8836,10015,04239,2176,00083,34516,4074,0003,6422,00060,11528,0002,6005,67542,00013,23410,3012,483735,313154424516592251243110613664501178177813171259773371002958421001515811418711713910781541250242,6431641392201973361,1112281,129229482407822710649353116988110110399739772371053583924005,556203286202286514201260732731,10320610310012301116317731766701415233104298513140243810322884111462512486814297083191,4562534853302934901,6343882,059368941,0952611,2502508389862441,8732493231801,1392016881915374675455,9532658003045006993466501966001,65433227654301554298511440665035945736497466331362192614164119963315864984419151,1874691946596021,0663,4735552,5006081003071122781831,1981,1505501,6641711522182,1041233622351,0742,4511,50083,3458644446076671,9394834331165003,3095421663,1692441,9504,5122,6743,4696,3053,2453,5423,3832,7131,305951,7633447,7065401,9651,6462,0252,3342,1171,7941,0571,6521,0993,4661,5853,4194,0071716196983,7522,8442651,2069,7081,5712,96119999,119216432729139511053325422692320994211613213257183628263510622849123410032202715631315980.130.040.200.140.090.120.220.090.150.510.180.330.040.210.040.190.250.130.130.200.320.080.230.150.270.070.090.260.040.240.040.170.350.060.100.100.210.230.120.290.08AVERAGE 17,934 64 449 36 739 29 2,865 2,418 49 0.17WMA following statewide antler criteria.*2007-2008 Mississippi Deer Program Report
2007-2008 WMA Deer Harvest NarrativesHarvested on Copiah WMA by Shawn Phillips on December 8th.Bienville WMAWritten by: Scott BakerBienville WMA is 31,000 acres within the Bienville National Forest located north of Morton. Forthe fourth year bucks had to meet minimum antler requirements to be legal for harvest. Duringthe 2007-2008 season, legal bucks were those with a minimum inside spread of 12 inches orone main beam length of at least 15 inches. Antlerless deer had to weigh at least 65 pounds. The2007-2008 season was the third year antlerless deer were legal for harvest during gun season.Season Harvest Man-days2005-2006.................87............... 1,8062006-2007.................74............... 1,9242007-2008...............154............... 3,169Deer harvest consisted of 100 bucks and 54 does. Total harvest increased 108% from the previous year and hunter effort increased by65%.Management for the Red-cockaded woodpecker, which is an endangered species that resides on the WMA, has indirectly improved deerhabitat on Bienville WMA over previous years. However, in 2005 Hurricane Katrina damaged much of the hardwoods along creeks throughoutthe area. The MDWFP has proposed new openings in timber thinning/harvest areas which will provide additional food sources for wildlife.As deer populations continue to grow in response to habitat improvements, it has become necessary to increase antlerless hunting opportunities.For the 2008-2009 season, antlerless hunting opportunities on Bienville WMA will include archery season, primitive weapon season,a portion of modern firearms season from December 16-21, and January archery season.WMA NarrativesBlack Prairie WMAWritten by: Jerry HazlewoodBlack Prairie WMA offers a lottery draw hunt that has provided a very high success rate during the past several years. Hunter effortand harvest were both significantly higher than the previous year, with a harvest in 2007-2008 of 12 bucks and 30 does. Deer harvest asa whole increased from the previous season. Man-days of effort increased 136% and harvest increased 45%. There were no significantchanges in deer hunting regulations, opportunity, or bag limits to account for the increase in man-days of effort.Season Harvest Man-days2005-2006.................54.................. 3772006-2007.................29.................. 1032007-2008.................42.................. 244Hunters who desire a quality buck are passing up young bucks and waiting for an opportunityto harvest a mature buck; therefore, fewer young bucks are being harvested. The result is anincrease in buck quality because bucks are allowed to grow older. Habitat quality is maintainedby keeping the deer population below carrying capacity, planting supplemental food plots, andsummer agriculture crops on approximately 1,600 acres.2007-2008 Mississippi Deer Program Report
2007-2008 WMA Deer Harvest NarrativesCalhoun County WMAWritten by: Brad HolderCalhoun County WMA is a 10,900 acres located near Bruce, MS in Calhoun County. This area is unique because it offers extensiveopportunity to those who hunt deer with dogs. Harvest on the WMA continues to be skewed towards bucks. Thirty bucks and 15 doeswere harvested this past season. We would like to see more does than bucks harvested during future seasons. Buck and doe weights andSeason Harvest Man-days2005-2006.................57............... 1,4062006-2007.................57............... 1,9902007-2008.................45............... 1,950lactation were 5-10% greater than average for all age classes when compared to averages forthe Upper Coastal Plain soil region. However, buck and doe weights are down slightly whencompared to the past 5 seasons on the WMA. Antler indices continue to improve on the area.Those who hunt deer without dogs continue to find hunting conditions less favorable in theaging pine stands on Calhoun County WMA. The canopy closure occurring in the mid-rotationpine stands and 2-4 year old clear-cuts on most of the WMA are making it harder to encounterdeer. However, timber thins and small clear-cuts continue to improve habitat to an extent. The logging decks and lanes provide additionalareas that can be planted or maintained as openings.Canal Section and John Bell Williams WMAsWritten by: Jerry HazlewoodSeason Harvest Man-days2005-2006.................67............... 3,1402006-2007...............131............... 3,9122007-2008...............165............... 4,512Canal Section WMA (32,500 ac.) and John Bell Williams WMA (3,000 ac.) share commonboundaries. Harvest data is combined for both WMAs. These areas stretch approximately 54linear miles along the west side of the Tennessee-Tombigbee Waterway from MS Hwy. 4 at BaySprings Lake to 5 miles south of MS Hwy. 45 at Aberdeen. These WMAs lie in Tishomingo, Prentiss, Itawamba, and Monroe counties.During the past deer season, a total of 4,512 man-days were recorded for deer hunting with a harvest of 165 deer, consisting of 111bucks and 54 does. The majority of usage and harvest occurred during the gun seasons with 2,736 man-days and 77 bucks harvested. Doeharvest was not allowed during gun season. Man-days increased 15% while harvest increased 26%. There were no changes in regulationsor habitat to explain these increases.Antlered buck harvest criteria and bag limit are the same as statewide. Approximately 250 acres of the area is handicapped hunting only,200 acres is archery only, and 100 acres is primitive weapon only for deer hunting.The WMAs have 164 winter food plots and 79 summer food plots. The winter food plots did exceptionally well due to early acquisition ofseed and fertilizer which led to early planting dates. Acorn production throughout the WMA was very good.WMA NarrativesCaney Creek WMAWritten by: Scott BakerCaney Creek WMA is 31,000 acres within the Bienville National Forest located near Forest. For the fourth year bucks had to meet minimumantler requirements to be legal for harvest. During the 2007-2008 season, legal bucks were those having a minimum inside spread of12 inches or one main beam length of at least 15 inches. Antlerless deer had to weigh at least 65 pounds.Deer harvest numbers consisted of 63 bucks and 29 does. Total harvest increased by 46% from last year and hunter effort increasedby 14%. This was the first increase in hunter effort in the last five years. This could be due to improved hunter compliance or an overallincrease in use and harvest.Season Harvest Man-days2005-2006.................79............... 2,3712006-2007.................63............... 2,3472007-2008.................92............... 2,674As deer populations continue to grow in response to habitat improvements on the area, ithas become necessary to increase antlerless hunting opportunities. For the 2008-2009 season,antlerless hunting opportunities on Caney Creek WMA will include archery season, primitiveweapon season, a portion of modern firearms season from December 16-23, and Januaryarchery season.Measures are being taken to improve habitat conditions on the area. The U.S. Forest Service conducted timber harvest operations onCaney Creek WMA and continued spring prescribed burns, which should increase available browse for deer and other wildlife. As a resultof the timber harvest operation, the MDWFP will be allowed to maintain several areas as permanent wildlife openings, which will improvehabitat conditions on the area for years to come.Caston Creek WMAWritten by: Joshua L. MoreeSeason Harvest Man-days2005-2006.................61............... 2,6932006-2007.................44............... 2,8872007-2008.................25............... 3,469Caston Creek WMA is 27,785 acres located within the Homochitto National Forest nearMeadville in Franklin and Amite counties. The fire maintained pine stands combined with mixedpine-hardwood and hardwood stands attract many visitors to the WMA. Total reported deer harvest decreased 43% for the 2007-2008hunting season compared to the 2006-2007 hunting season, with 25 deer harvested, which consisted of 17 bucks and 8 does. Buck harvestdecreased by 5 and doe harvest decreased by 14 compared to the previous season. Total reported deer hunting man-days increased 20%compared to the 2006-2007 hunting season.102007-2008 Mississippi Deer Program Report
2007-2008 WMA Deer Harvest NarrativesChickasaw WMAWritten by: Brad HolderChickasaw WMA is 28,000 acres located within the Tombigbee National Forest near Houston in Chickasaw County. A total of 73 bucksand 51 does were harvested this past season. Man-days continue to exhibit an increasing trend on the area. Weights for most buck and doeSeason Harvest Man-days2005-2006...............151............... 5,7322006-2007.................98............... 6,2812007-2008...............124............... 6,305age groups are average to above average when compared to the Interior Flatwoods soil region.Antler indices continue to increase for all age classes. Fifty-two percent of the total doe harvestconsisted of 3.5+ year old does. Continued harvest is a must to keep deer numbers in check.Winter food plots planted in clovers, oats, and wheat responded to cooler temperatures and increasedrainfall in late fall and early winter. A great mast crop this past fall and winter disperseddeer. However, hunters still reported seeing deer and experienced decent success.Chickasawhay WMAWritten by: Joshua L. MoreeChickasawhay WMA is a large U.S. Forest Service area spanning across 122,153 acres inJones and Wayne counties. The fire maintained pine stands combined with scattered creeksand drains on the area attract many outdoor types. Total reported deer hunting man-daysincreased 15% for the 2007-2008 hunting season while total reported harvest drasticallydecreased 59% compared to the 2006-2007 hunting season. A total of 31 deer were harvestedSeason Harvest Man-days*2005-2006.................34............... 2,1292006-2007.................75............... 2,8292007-2008.................31............... 3,245*Man-days and harvest are from still hunting only area.consisting of 17 bucks and 14 does. Harvest data indicated that the lactation rate for mature does was 62%, an increase from the previousyear’s rate of 36%. Buck and doe weights across all age classes were similar to the previous five-year averageChoctaw WMAWritten by: Brad HolderChoctaw WMA is 24,500 acres located within the Tombigbee National Forest near Ackerman in Choctaw County. Harvest consisted of 66bucks and 40 does this past season. Buck and doe harvest weights were slightly below average for all age classes when compared to averagesfor the Upper Coastal Plain soil region. Lactation for all doe age classes was at or below average. These numbers along with a largepercentage (62%) of 3.5+ year old does in this past season’s harvest indicate overpopulation. An increase in harvest, particularly of does,is needed to improve herd health parameters. However, antler indices continue to improveslightly on the area, presumably due to the progressive antler criteria on the WMA. Deer werea little more scattered and harder to pattern this year due to the abundant acorn crop. Winterfood plots maintained in wheat, oats, and clovers responded to colder weather and increasedrainfall. Prescribed burns on the WMA should help to increase natural deer browse and cover.Copiah County WMAWritten by: Joshua L. MoreeCopiah County WMA is comprised of 6,583 acres owned by the State of Mississippi. The WMA consists of pine stands with mixed pinehardwoodsalong the creeks and drains. Numerous permanent openings throughout the WMA are maintained with native vegetation andsupplemental plantings. A full-time wildlife manager was assigned to the WMA in the spring of 2007. Habitat conditions on the WMA wereimproved prior to the 2007-2008 hunting season by conducting prescribed burns and creating additional permanent openings with fundsprovided by the National Wild Turkey Federation.Season Harvest Man-days2005-2006.................80............... 1,1022006-2007.................77.................. 7292007-2008...............136............... 3,383Season Harvest Man-days2005-2006...............107............... 2,9262006-2007...............111............... 5,6552007-2008...............106............... 3,542Total reported deer hunting man-days increased 364% to 3,383 for the 2007-2008 huntingseason. Total reported deer harvest increased 77% to 136 (70 bucks and 66 does) comparedto the 2006-2007 hunting season. Buck harvest increased by 54 and doe harvest increasedonly by 5 compared to the previous hunting season. Harvest data indicated that the lactationrate for mature does was 70%, an increase from the previous year’s rate of 60%. Doe weightswere similar to the previous five year average; however, buck weights were lower.Measures are being taken to improve habitat conditions on the WMA. MDWFP personnel conducted prescribed burns on approximately1,000 acres in February and March of 2008. Additionally, plans are underway to create more permanent openings and expand the prescribedfire regime on the WMA.WMA NarrativesDivide Section WMAWritten by: Jerry HazlewoodDivide Section WMA (15,300 ac.) lies along both sides of the Tennessee-Tombigbee Waterway from the northwest side of Bay SpringsLake northward to MS Hwy. 25 near Pickwick Lake. A small portion of the area is in Prentiss County and the remainder is in TishomingoCounty. This WMA annually undergoes intense habitat management to increase the value to wildlife and provide a quality hunting experi-2007-2008 Mississippi Deer Program Report11
2007-2008 WMA Deer Harvest Narrativesence. The WMA has 141 winter food plots and 78 summer food plots. The food plots range in size from one-half acre to two acres. Approximatelyone-third of the WMA is spoil area, which is material excavated during the construction of the Tennessee-Tombigbee Waterway.This acreage is very poor soil still in early stages of plant succession.Season Harvest Man-days2005-2006.................61............... 2,3892006-2007.................60............... 2,9022007-2008.................64............... 2,713Divide Section WMA is a primitive weapon only area for deer with a season bag limit of twoantlerless deer and one legal antlered buck. Regulations state that a buck must have a minimuminside spread of 12 inches or one main beam of at least 15 inches to be legal for harvest.Legal antlerless deer must weigh at least 65 pounds live weight. Approximately 950 acres ofthis area is devoted to youth and handicapped only deer hunting. Youth and handicapped huntersmay use modern firearms.Fourteen bucks were harvested during the 2007-2008 season, which was an increase of 5 from the 2006-2007 season. The antlerlessharvest was 50 and has been stable over the last 5 years. Man-days decreased by 189 or approximately 7% from the previous year.The winter food plots on the area did exceptionally well due to early acquisition of seed and fertilizer which led to earlier planting datesthan last year. Due to two consecutive nights of freezing weather in late April of 2007, acorn production throughout the WMA was basicallynonexistent. During the fall of 2007, many hunters in northern Tishomingo County reported sick and dead deer and many deer wereharvested that had sloughing hooves. The conditions suggest there was a severe outbreak of hemorrhagic disease in the area. The overalleffect on the deer herd in this area is yet to be determined. The late spring freeze and drought of 2007, coupled with the quality of foodplots on the WMA, may have made deer more visible during hunting season. This may explain the slight increase in harvest. Therefore, theincrease in harvest on this area may not represent the overall population.Hamer WMAWritten by: Brad HolderHamer WMA is 4,000 acres located near Sardis in Panola County. The antler criteria on thisarea increased to a 15 inch minimum inside spread or one main beam at least 18 inches longfor the 2007-2008 season. Fifteen bucks and 35 does were harvested during the 2007-2008Season Harvest Man-days2005-2006.................98............... 1,3882006-2007.................76............... 1,2702007-2008.................50............... 1,305season. Older does (3.5+ years old) continue to make up a large portion (55%) of the total doe harvest. Buck and doe weights were belowaverage compared to the Upper Thick Loess soil region this past season. Both parameters indicate a deer herd exceeding habitat carryingcapacity. Antler quality improved slightly because of progressive antler criteria for the area. Increased harvest should improve body weightsand antler quality. Habitat conditions should continue to improve with large scale prescribed burning and future timber thins which willstimulate growth of more cover and browse.WMA NarrativesHell Creek WMAWritten by: Jerry HazlewoodDeer hunting opportunity on this area is by permit only. Deer hunting activity and harveston Hell Creek WMA changed very little from last year. There were no significant changes indeer hunting regulations, opportunity, or bag limits. The deer harvest of 11 deer consisted of2 bucks and 9 does. Habitat management efforts to improve 400 acres of mid-rotation pineplantations should be beneficial to white-tailed deer on Hell Creek WMA for years to come.John Starr Forest WMAWritten by: Brad HolderJohn Starr Forest WMA is 8,244 acres located near Starkville in Oktibbeha County. Total deer harvest continues to remain fairly consistenton the area. Thirty-three bucks and 45 does were harvested this past season. Man-days were down slightly (9%) from last year. Deerweights and doe lactation were down compared to last season. Weights for bucks and does are average to slightly below average comparedSeason Harvest Man-days2005-2006.................88............... 1,2732006-2007.................81............... 1,9332007-2008.................78............... 1,763Season Harvest Man-days2005-2006.................16.................. 1802006-2007.................12.................... 992007-2008.................11.................... 95to the Upper Coastal Plain soil region. Antler measurements continue to exhibit a slightlyincreasing trend over past seasons. Acorn production on the area was similar to many otherparts of the state with increased abundance causing deer to remain spread out in the woods.Food plots were slow to get started but began to grow well when temperatures cooled and rainfallincreased in late fall and early winter. The development of new food plots, prescribed burns,timber thins, and increased harvest should continue to increase deer herd health indices.Lake George WMAWritten by: Jackie FleemanLake George WMA is 8,383 acres located near Holly Bluff in Yazoo County and is primarily 16 year-old replanted bottomland hardwoodtimber. The 2007-2008 season was the first year that allowed a legal buck to have a 15-inch minimum inside spread or 18-inch minimummain beam. Previously, legal bucks were those having at least 4 points and a 15 inch minimum inside spread. Also, hunters could apply for122007-2008 Mississippi Deer Program Report
2007-2008 WMA Deer Harvest Narrativesa tag that would allow them to harvest a buck with at least one unforked antler. Both of theseregulations appear to be supported by the majority of the deer hunters in the area. Twenty ofthese special buck tags were issued and none were reported as used. Deer hunting man-daysincreased from 297 in 2006-2007 to 344 in 2007-2008, continuing the trend of increased mandayson the area. Buck harvest increased from 8 to 10, and doe harvest remained at 7. Bodyweights were excellent for bucks and does, and antler indices were outstanding as well. Buckharvest consisted of 2.5, 3.5, and 4.5 year-old bucks.Season Harvest Man-days2005-2006.................14.................. 2862006-2007.................15.................. 2972007-2008.................17.................. 344Rainfall was consistent until late summer and resulted in good browse availability. Mast crop production was excellent where available,but most trees were not old enough to produce mast. Warm weather and abundant food limited deer movement during much of the winter.This area has a fairly low deer density, but buck quality and herd abundance is improving due to excellent habitat.Leaf River WMAWritten by: Joshua L. MoreeLeaf River is one of, if not the most, storied WMAs in Mississippi. The rich history and excellent hunting make this area a popular drawfor south Mississippi hunters. The 41,411-acre WMA, located within the Desoto National Forest in Perry County, is a mix of fire-maintainedpine stands with scattered creeks and drains. A full-time wildlife manager was assigned to the WMA prior to the 2007-2008 hunting season.Funds provided by the National Wild Turkey Federation allowed the creation of additional permanent openings on the WMA.Total reported man-days increased 33% to 7,706 compared to the previous season. This increase is likely due to improved huntercompliance due to a wildlife manager being present on the WMA. Total reported deer harvestincreased 20% to 78 (42 bucks and 36 does) compared to the 2006-2007 season. Buck harvestincreased by 5 and doe harvest increased by 8 compared to the previous season. Harvestdata indicated that the lactation rate for mature does was 36%, which was slightly lower thanthe previous year’s rate of 38%. Doe weights were similar to the previous five year average;however, buck weights were slightly lower.Season Harvest Man-days2005-2006.................41............... 3,7882006-2007.................65............... 5,7942007-2008.................78............... 7,706Leroy Percy WMAWritten by: Jackie FleemanLeroy Percy WMA is 2,200 acres located about 5 miles west of Hollandale on MS Hwy. 12. Only primitive weapons and archery equipmentare allowed for deer hunting. Reported harvest was 9 bucks and 4 does, which is up slightly from 6 bucks and 4 does harvestedSeason Harvest Man-days2005-2006.................12.................. 4722006-2007.................10.................. 5542007-2008.................13.................. 540Little Biloxi WMAWritten by: Joshua L. Moreeduring the 2006-2007 season. This was the first year requiring legal bucks to have a 15-inchminimum inside spread or 18-inch minimum main beam. Previously, legal bucks were thosehaving at least 4 points and a 15-inch minimum inside spread. Also, hunters could apply fora tag that would allow them to harvest a buck with at least one unforked antler. Nineteen tagswere issued and no tags were reported as used. Hunting pressure this season was downslightly at 540 man-days compared to 554 man-days last season.Season Harvest Man-days2005-2006...................6.................. 6622006-2007.................19............... 1,9952007-2008.................17............... 1,965Little Biloxi WMA is 15,622 acres located near McHenry in Harrison and Stone counties andis a popular hunting destination for many coastal county residents. Most roads and food plotsthat were inaccessible from Hurricane Katrina were opened prior to the 2007-2008 huntingseason. Additionally, hunter compliance is expected to improve with a full-time wildlife managerpresent on the WMA. Total reported man-days decreased slightly to 1,965 for the 2007-2008 season. Reported harvest decreased by 2deer to 17, which consisted of 8 bucks and 9 does.WMA NarrativesMahannah WMAWritten by: Jackie FleemanMahannah WMA is 12,675 acres located approximately 12 miles north of Vicksburg in Issaquena and Warren counties. Deer hunting isby permit only except for the January archery hunt which is open to the public. This was the first year under the regulations that requiredlegal bucks to have a 16-inch minimum inside spread or a 20-inch minimum main beam. Also, hunters could apply for a tag that wouldallow them to harvest a buck with at least one unforked antler. Four hundred and seventy of these special buck tags were issued on MahannahWMA and twenty-seven were reported as used. Both of these regulations appear to be supported by the majority of deer hunters on thearea. Man-days decreased slightly to 1,646. Overall deer harvest decreased to 125. Doe harvest decreased from 106 to 74. Buck harvestincreased from 46 to 51 due to increased use of the special buck tags. Below normal rainfall for much of the summer and fall resulted infair browse conditions. Acorn production was excellent. The warm weather during much of the winter resulted in limited deer movementwhich caused a reduction in deer sightings.2007-2008 Mississippi Deer Program Report13
2007-2008 WMA Deer Harvest NarrativesSeason Harvest Man-days2005-2006...............126............... 1,7662006-2007...............152............... 1,7552007-2008...............125............... 1,646A deer herd health evaluation was conducted on Mahannah WMA on February 28, 2008. Atotal of eleven does were collected. Overall, the current herd health indices on Mahannah WMAwere equal to the expected values for the WMA and the Delta. Dressed weight, reproductivepotential, and conception date indices were equal or slightly better than the expected values forthe WMA and the Delta. Kidney fat index was slightly below the expected value for the area, butequal to the expected value for the Delta. The primary concern during 2007 was that the rangeof conception dates was almost 2 months long, but this year the range dropped to only 38 days. Conception dates ranged from December8 until January 15. This year’s herd health evaluation seems to confirm that the 2006 selective timber harvest, an intensified antlerlessharvest program, and the excellent mast crop this year have improved deer herd health on this areaMalmaison WMAWritten by: Brad HolderSeason Harvest Man-days2005-2006.................89............... 2,3942006-2007.................85............... 1,7272007-2008.................97............... 2,025Malmaison WMA is 9,483 acres located near Grenada in Carroll, Grenada, and Leflore counties.Total deer harvested increased by 12% with 31 bucks and 66 does harvested during the2007-2008 season. Lactation rates and weights for all doe age classes increased comparedto the past 5 seasons and were greater than Delta soil region averages. Buck weights for the2.5+ year old age class decreased. Deer density appears to be fairly high as indicated by browse pressure. Antler measurements continueto improve slightly when compared to past seasons. This is probably due to progressive antler regulations on the area which many hunterssupport. Above average acorn production on the WMA provided deer with abundant winter food. This probably explains the increase in doeweights.WMA NarrativesMarion County WMAWritten by: Joshua L. MoreeMarion County WMA, located southeast of Columbia, is 7,200 acres owned by the State of Mississippi. The WMA consists mainly of firemaintainedlongleaf pine stands with mixed pine-hardwoods along creeks and drains. Numerous permanent openings throughout the WMAare maintained with native vegetation and supplemental plantings.Total reported man-days increased 11% for the 2007-2008 season while total reported harvest decreased 9% compared to the 2006-2007 season. A total of 73 deer were harvested consisting of 40 bucks and 33 does. Buck harvest decreased by 7 compared to the previousseason; however, doe harvest remained the same. Harvest data indicated that the lactation rate for mature does was 92%, an increase fromSeason Harvest Man-days2005-2006.................49............... 1,3882006-2007.................80............... 2,1012007-2008.................73............... 2,334Mason Creek WMAWritten by: Joshua L. Moreethe previous year’s rate of 83%. Buck and doe weights across all age classes were not significantlydifferent from the previous five year average.Acorn production was high on the WMA. The excellent acorn crop along with increasedbrowse production from openings created by Hurricane Katrina likely explains why huntersreported fewer deer observationsThe 27,272-acre Mason Creek WMA, located within the Desoto National Forest in GreeneCounty, adjoins the larger Chickasawhay WMA to the south. Hunter compliance continued toimprove this year with the continued presence of a full-time area manager. While there is nocheck-in station on Mason Creek, hunters are still required to record harvests on the dailySeason Harvest Man-days2005-2006.................19............... 1,7442006-2007.................28............... 1,7512007-2008.................37............... 2,117permit card. Reported man-days increased 21% to 2,117 for the 2007-2008 season. Reported harvest increased 32% to 37 (24 bucks and13 does).Habitat management has been very limited on Mason Creek WMA. However, plans are underway to improve wildlife habitat across thearea. Proposed habitat improvements by the U.S. Forest Service include creation of additional permanent openings, timber thinning, andprescribed burns.Nanih Waiya WMAWritten by: Jerry HazlewoodNanih Waiya WMA is 7,655 acres located near Philadelphia in Neshoba and Winston counties. Man-days for the 2007-2008 seasonincreased 26% from the previous year. Reported harvest included 38 bucks and 62 does, an increase of 138% and 38% respectively. Thisis the fourth year of significant increases in man-days and harvest. Harvest success increased from 4% in 2006-2007 to 6% in 2007-2008.The increase in usage and harvest in the past few years is most likely due to the development and maintenance of an extensive road andtrail system throughout the bottomland allowing hunters unprecedented access. Most notable for the past hunting season was the lowwater levels and the outstanding acorn crop in the usually flooded bottomland.142007-2008 Mississippi Deer Program Report
2007-2008 WMA Deer Harvest NarrativesAfter 8 hunting seasons on this WMA, deer hunting potential remains largely untapped, particularlyin the more remote areas throughout the WMA. The early successional habitat, whichcomprises most of the WMA, has provided an abundant food supply for deer. Populations continueto remain at higher levels than when mature hardwood timber dominated the area. Thisearly successional habitat will soon be reaching a closed-canopy stage over a large portion ofthe WMA. The openings created by Hurricane Katrina during 2005 and smaller isolated stormsSeason Harvest Man-days2005-2006.................52.................. 8542006-2007.................61............... 1,4202007-2008...............100............... 1,794will provide a short-term increase in the amount of available deer browse. In an effort to manage deer populations, doe harvest opportunityextends throughout the entire season.Okatibbee WMAWritten by: Jerry HazlewoodOkatibbee WMA is 6,883 acres located near Collinsville in Lauderdale County. Man-days increased 8% from the previous year. Totalharvest was 29 for the second consecutive year, which included 10 bucks and 19 does.Hurricane Katrina and isolated storm damage had a lasting impact on the WMA. Timber damage has opened many of the previouslyclosed canopy stands. This has resulted in an increase in browse for deer. Some of the areas were so severely damaged that reforestationin hardwoods was the best option to reclaim the areas. High winds damaged stands of mature, bottomland hardwood more than uplandstands of mixed pine-hardwood. Downed timber from the storms is still scattered throughout much of the WMA and hunter access islimited but roads and trails have been cleared.Season Harvest Man-days2005-2006.................14.................. 4512006-2007.................29.................. 9832007-2008.................29............... 1,057Winter food plots did extremely well and there was an exceptional acorn crop.Timber management practices are being implemented to increase deer browse. Most of themature, upland pine stands have been thinned and burned. As a result of Katrina, the mature,closed-canopy bottomland hardwood stands which dominated most of the area have had theecological impact of a timber thin.O’Keefe WMAWritten by: Brad HolderO’Keefe WMA is 5,919 acres located near Lambert in Quitman County. Thirty-two bucksand 26 does were harvested during the 2007 – 2008 season. Buck weights continue to exhibita slightly increasing trend when compared to the past 5 seasons. Doe weights and lactationrates increased slightly from the 2006 season but decreased when compared to the 2002-2005seasons. Increases in doe and buck weights from last year were probably due to a great 2007 acorn crop. A lower percentage (31%) of3.5+ year old does in this past season’s harvest suggests fewer deer in the local herd. Antler production continues to improve due to implementationof progressive antler criteria (15-inch minimum inside spread and 18-inch minimum main beam length) which has gained approvalfrom those hunting the WMA. This area is surrounded by crop land which provides plentiful, high-quality summer and winter forage.Hunters indicated deer were a little more dispersed and harder to pattern this season. Future timber thins of selected stands are planned forO’Keefe WMA. This will provide additional benefits in the form of cover and browse for deer.Old River WMAWritten by: Joshua L. MoreeOld River WMA, located in Pearl River County near Poplarville, is owned by the State of Mississippi. It is a mix of bottomland hardwoodsand few upland areas covering over 15,000 acres in the Pearl River Basin. The WMA was in the direct path of Hurricane Katrina as it roaredthrough south Mississippi in August 2005. Increased sunlight from downed timber increased browse production and created dense coverSeason Harvest Man-days2005-2006...................5.................. 2072006-2007...................9.................. 3602007-2008.................42............... 1,099Season Harvest Man-days2005-2006.................60............... 1,6152006-2007.................62............... 1,8252007-2008.................58............... 1,652for many wildlife species. Timber salvage operations conducted after the hurricane improvedhunter access to the WMA. Man-days increased 205% to 1,099 for the 2007-2008 season.Hunter compliance also improved due to an increased presence of law enforcement personnelon the WMA. Reported harvest increased from 9 to 42 for the 2007-2008 hunting season. Atotal of 28 bucks and 14 does were reported harvested.WMA NarrativesPascagoula River WMAWritten by: Joshua L. MoreePascagoula River WMA, located in George and Jackson counties, is owned by the State of Mississippi. It is a mix of bottomland hardwoodscovering over 37,000 acres of the Pascagoula River Basin. Much of the WMA was heavily damaged by Hurricane Katrina; however,much effort has been taken to improve access and clear permanent openings across the WMA. Also, an increased presence of law enforcementpersonnel has improved hunter compliance.2007-2008 Mississippi Deer Program Report15
2007-2008 WMA Deer Harvest NarrativesSeason Harvest Man-days2005-2006.................11............... 1,9002006-2007.................30............... 2,4762007-2008...............100............... 3,466Man-days increased 40% for the 2007-2008 season, while harvest increased 233% comparedto the 2006-2007 season. A total of 100 deer were reported harvested consisting of84 bucks and 16 does. Harvest data indicated the lactation rate for mature does to be 55%.However, due to a small sample size, this rate is likely not representative of the entire WMA.Buck and doe weights across all age classes were similar to the previous 5-year average.Pearl River WMAWritten by: Jackie FleemanSeason Harvest Man-days2005-2006.................13.................. 7152006-2007................n/a................... n/a2007-2008.................15................ 1585Pearl River WMA is 6,000 acres along the Ross Barnett Reservoir north of Hwy. 43 nearCanton in Madison County. There is a 1,500-acre Youth and Handicap Only area within thewaterfowl refuge. Regulations state that a buck must have 4 or more antler points to be legalfor harvest and antlerless deer must weigh at least 65 pounds live weight. There were 11bucks and 4 does reported harvested on the area. Three new self service check stations were constructed in 2007. These should result inimproved harvest data on Pearl River WMA. Man-days doubled from the 2005-2006 season to the 2007-2008 season.Habitat conditions on the WMA were favorable for deer with good browse and habitat improvements will continue. A carbon dioxide wellwas drilled in the Youth and Handicap Only Area in the summers of 2007 and 2008. As a result of this operation, Denbury Onshore hasmade improvements to a 30-acre cut-over within Hurricane Lake and along roadsides. Once the drilling is completed, the drill pad will bemaintained as a permanent wildlife opening.Red Creek WMAWritten by: Joshua L. MoreeRed Creek WMA, located within the Desoto National Forest, is 91,139 acres spanning across Season Harvest Man-daysStone, George, and Harrison counties. Akin to Little Biloxi WMA, the area is a popular drawfor many coastal county residents. Hunter compliance has been low on the WMA due to a lackof agency personnel present on the area. A full-time wildlife manager was assigned to Red2005-2006...................9............... 3,9332006-2007.................17............... 4,0032007-2008.................15............... 3,419Creek during the 2007-2008 season, so hunter compliance should begin to improve. Man-daysdecreased 15% to 3,419 for the 2007-2008 season. Reported harvest decreased by 2 deer to 15 (14 bucks and 1 doe) compared to the2006-2007 season.WMA NarrativesSandy Creek WMAWritten by: Joshua L. MoreeSandy Creek WMA, located near Natchez in Adams and Franklin counties, is 16,407 acres located within the Homochitto National Forest.The WMA consists mainly of upland mixed pine-hardwood and bottomland hardwood forests. A full-time wildlife manager was assigned toSeason Harvest Man-days2005-2006.................37............... 2,0122006-2007.................36............... 2,6282007-2008.................81............... 4,007the WMA prior to the 2007-2008 season. Man-days increased 52% to 4,007 compared to the2006-2007 season. Hunter compliance likely increased due to an increased presence of MD-WFP personnel on the WMA. Reported harvest increased 125% to 81 (62 bucks and 19 does)for the 2007-2008 season. Buck harvest increased by 40 while doe harvest increased only by 5compared to the previous season.Sardis Waterfowl WMAWritten by: Brad HolderSardis Waterfowl WMA is 2,480 acres located north of Oxford in Lafayette County. Thearea’s four-day, permit only youth hunt provides a unique opportunity to hunt an unpressured, Season Harvest Man-dayshigh density deer herd. Five bucks and 9 does were harvested during the 2007 season. This 2005-2006.................20.................... 78was opposite the usual harvest of more bucks than does. Number of deer harvested was down 2006-2007.................24.................... 96by almost half from the 2006 season. Low body weights and lactation rates suggest overpopulation.Very few fawns were observed during the summer of 2007. All these factors indicate a2007-2008.................14.................. 171herd stressed from overpopulation. Increased participation from youth hunters is needed to harvest a greater number of deer. The additional2-day December hunt, awarded to those who harvested at least one doe during their November hunt, seemed to increase doe harvestthis past season. This coupled with no antler restrictions should continue to help increase deer harvest on the WMA. Habitat on the areashould see improvement within the next couple of years due to scheduled timber thins and prescribed burns.162007-2008 Mississippi Deer Program Report
2007-2008 WMA Deer Harvest NarrativesShipland WMAWritten by: Jackie FleemanShipland WMA is 3,642 acres located near Mayersville in Issaquena County. This WMA is the only state-owned land in the Batture soilregion. The west boundary is the Mississippi River. Only primitive weapons and archery equipment are allowed for deer hunting. The WMAconsists of bottomland hardwood and an approximately 100-acre sand field. Timber thinning in the recent past has greatly increased thebrowse and escape cover on the WMA. This was the first year that required a legal buck to have a 15-inch minimum inside spread or 18-inch minimum main beam. Previously, legal bucks were those having at least 4 points and a 15-inch minimum inside spread. Also, hunterscould apply for a tag that would allow them to harvest a buck with at least one unforked antler. Twenty of these special buck tags wereSeason Harvest Man-days2005-2006.................20.................. 6282006-2007.................28.................. 8402007-2008.................18.................. 619issued on Shipland WMA, and one was reported as used. Both of these regulations appear tobe supported by the majority of deer hunters on the area. Hunting pressure decreased to 619man-days in 2007-2008. Harvest included 12 bucks and 6 does, which was down from 12bucks and 16 does last season. Mast production was excellent and normal rainfall during thesummer resulted in fair browse conditions. The mild winter resulted in limited deer movementwhich caused a reduction in deer sightings.Stoneville WMAWritten by: Jackie FleemanStoneville WMA is 2,500 acres located about 4 miles north of Leland in Washington County.Most of the timber on the area was cut in the mid to late 1990s. This WMA has abundant Season Harvest Man-daysbrowse and escape cover. Only primitive weapons and archery equipment are allowed for deer 2005-2006.................13.................. 721hunting. This was the first year that required a legal buck to have a 15-inch minimum inside 2006-2007.................12.................. 590spread or 18-inch minimum main beam. Previously, legal bucks were those having at least 4 2007-2008...................7.................. 698points and a 15-inch minimum inside spread. Also, hunters could apply for a tag that wouldallow them to harvest a buck with at least one unforked antler. Twenty of these special buck tags were issued and none were reported asused. Both of these regulations appear to be supported by the majority of deer hunters on the area. Hunting pressure increased to 698man-days in 2007-2008. Deer harvest decreased to 7. This harvest included 4 bucks and 3 does. No other scientific data was collected becauseno personnel are assigned to this WMA. Normal rainfall during the summer resulted in good browse conditions while acorn productionwas excellent. The mild winter resulted in limited deer movement which limited deer sightings.Sunflower WMAWritten by: Jackie FleemanSunflower WMA is 60,000 acres encompassing the entire Delta National Forest near Rolling Fork in Sharkey County. This was the firstyear that required a legal buck to have a 15-inch minimum inside spread or 18-inch minimum main beam. Previously, legal bucks werethose having at least 4 points and a 15-inch minimum inside spread. Also, hunters could apply for a tag that would allow them to harvesta buck with at least one unforked antler. Two hundred of these special buck tags were issued on Sunflower WMA and three were reportedas used. Both of these regulations appear to be supported by the majority of deer hunters on the area. Normal rainfall during summer andfall resulted in good browse conditions. The mild winter resulted in limited deer movement which caused a reduction in deer sightingsSeason Harvest Man-days2005-2006...............146............... 5,1232006-2007.................95............... 3,7712007-2008...............117............... 3,752during the later deer seasons. Acorn production was excellent. Buck harvest increased from 49in 2006-2007 to 86 in 2007-2008. Doe harvest decreased from 46 to 31. Man-days remainedstable at 3,752.A deer herd health evaluation was conducted on Sunflower WMA on March 10-11, 2008. Atotal of 11 does were collected. Overall herd health indices on Sunflower WMA were better thanthe expected values for the WMA and the Delta. The kidney fat index was 127% of the historicalexpected value for Sunflower and was 139% of the expected value for the Delta. Reproductive timing was early with mean conceptionoccurring around December 24. The range of conception was November 26-January 11. The reproductive potential was excellent with 2.2fetuses per doe. The herd health evaluation suggests that harvest on Sunflower WMA has kept the deer population in balance with existinghabit conditions, and that the population could be increased.WMA NarrativesTallahala WMAWritten by: Scott BakerTallahala WMA is 28,120 acres within the Bienville National Forest located near Montrosewithin Jasper, Newton, Scott, and Smith counties. For the 2007-2008 season, legal buckswere those having a minimum inside spread of 12 inches or minimum main beam length of 15inches. Antlerless deer had to weigh at least 65 pounds live weight. Harvest consisted of 81bucks and 58 does. Harvest increased 88% from last year. Deer hunters accounted for 2,844man-days, which were up from the previous year by 48%. For the 2008-2009 season, antler-Season Harvest Man-days2005-2006.................57............... 2,2272006-2007.................74............... 1,9242007-2008...............139............... 2,8442007-2008 Mississippi Deer Program Report17
2007-2008 WMA Deer Harvest Narrativesless hunting opportunities on Tallahala WMA will include archery season, primitive weapon season, a portion of modern firearms seasonfrom December 16-23, and January archery season. The U.S. Forest Service continues to conduct spring prescribed burns on the WMA.This helps to encourage browse production.Tuscumbia WMAWritten by: Jerry HazlewoodTuscumbia WMA, located near Corinth in Alcorn County, comprises 2,600 acres and consistsprimarily of abandoned agricultural fields and beaver slash. The area is comprised of twoseparate units. The northern unit (1,400 ac.) is mainly permanent water and slash, which isnot easily accessed and provides little deer habitat. The southern unit (1,200 ac.) has mostlySeason Harvest Man-days2005-2006...................0.................... 612006-2007...................6.................. 2522007-2008.................10.................. 265abandoned agricultural fields and seven newly constructed waterfowl impoundments. Both units experience frequent flooding in the wintermonths.Archery hunting was allowed October 1-December 9, an increase of 8 days of hunting opportunity which accounted for the majority ofthe increase in man-days. Deer hunting is not the primary use of the area, and only 10 deer (4 bucks and 6 does) were harvested. Effortand harvest numbers are low due to the small size of the area, limited deer habitat, and low public access.WMA NarrativesTwin Oaks WMAWritten by: Jackie FleemanTwin Oaks WMA is 5,675 acres of bottomland hardwoods located 5 miles southeast of Rolling Fork in Sharkey County. Deer hunting isrestricted to permit only archery and primitive weapon hunts, except for the January archery season, which is open to the public. This wasthe first year that required a legal buck to have a 15-inch minimum inside spread or 18-inch minimum main beam. Previously, legal buckswere those having at least 4 points and a 15-inch minimum inside spread. Also, hunters could apply for a tag that would allow them toSeason Harvest Man-days2005-2006.................57............... 1,2062006-2007.................70.................. 9802007-2008.................78............... 1,206harvest a buck with at least one unforked antler. Six hundred of these special buck tags wereissued on Twin Oaks WMA and 10 were reported as used. Hunter effort increased to 1,206man-days in 2007-2008. Buck harvest increased from 20 to 29, and doe harvest decreasedfrom 50 to 49. Normal rainfall during the summer resulted in good browse conditions whileacorn production was excellent. The mild winter and abundant food limited deer movement,which caused a reduction in deer sightings.A deer herd health evaluation was conducted on Twin Oaks WMA on March 6, 2008. A total of 9 does were collected. Overall herd healthindices on Twin Oaks WMA were better than the expected values for the WMA and the Delta. Dressed weight, reproductive potential, andkidney fat index were better than the expected values for the WMA and the Delta. Reproductive timing was early with a mean conceptiondate of December 21. The range of conception was 34 days, ranging from December 8-January 11.Upper Sardis WMAWritten by: Brad HolderUpper Sardis WMA is 42,274 acres located within the Holly Springs National Forest nearOxford in Lafayette County. Man-days increased by 7% from the 2006-2007 season and seemsto be increasing slightly when compared to the past 9 seasons. Harvest continues to exhibita decreasing trend when compared to the past two seasons. This is the second consecutiveSeason Harvest Man-days2005-2006...............212............... 6,7262006-2007...............169............... 8,9952007-2008...............154............... 9,708season that harvest favored does, and hopefully this trend will continue. Seventy bucks and 84 does were harvested. Weights for bucks anddoes and lactation rates have decreased over the past 3 seasons. These figures also remain below Upper Coastal Plain soil region averages.Declining averages combined with a large percentage (73%) of 3.5+ year old does in the past season’s harvest indicate an overpopulateddeer herd. Increased harvest is needed to improve the herd parameters. Reduced harvest success may have been attributed to hunterchoice and a very good acorn crop, which dispersed deer. Planted winter forages such as clovers, wheat, and oats benefited from coolertemperatures and increased rainfall in the fall and early winter.Ward Bayou WMAWritten by: Joshua L. MoreeWard Bayou WMA is 13,234 acres of bottomland hardwoods and some upland areas nestledwithin the Pascagoula River Basin near Moss Point in Jackson County. Many of the low-lyingareas are boat accessible through navigable waters off the main river channel. Hunting accessis often dependent upon rainfall and river levels. Man-days increased 41% to 1,571 comparedto the 2006-2007 season. Harvest increased by 10 deer to 12 (8 bucks and 4 does) for the2007-2008 season.Season Harvest Man-days2005-2006...................3............... 1,0782006-2007...................2............... 1,1122007-2008.................12............... 1,571182007-2008 Mississippi Deer Program Report
2007-2008 WMA Deer Harvest NarrativesWolf River WMAWritten by: Joshua L. MoreeSeason Harvest Man-days2005-2006.................57............... 2,4842006-2007.................63............... 3,0352007-2008.................50............... 2,961Wolf River WMA, located in Lamar and Pearl River counties near Poplarville, consists of10,801 acres owned by Weyerhaeuser Company. The WMA consists of various aged pineplantations interspersed with minor stream bottoms. Man-days decreased slightly by 2% to2,961 for the 2007-2008 season. Harvest decreased by 13 deer to 50 (31 bucks and 19 does)compared to the 2006-2007 season. Buck harvest increased by 2 while doe harvest decreased by 15 compared to the previous season.Harvest data indicated the lactation rate for mature does was 94%, an increase from the previous year’s rate of 69%. Buck weights weresimilar to the previous 5-year average; however, doe weights were slightly above the previous 5-year average.Yockanookany WMAWritten by: Brad HolderYockanookany WMA is 2,379 acres located near McCool in Attala County. The 2007 – 2008 harvest increased significantly over past seasonsand consisted of 9 bucks and 15 does. This harvest ratio needs to continue and increase to manage populations at a desirable level.Season Harvest Man-days2005-2006.................12.................. 1892006-2007...................7.................. 1662007-2008.................24.................. 199The deer herd is overpopulated as indicated by a large percentage (77%) of 3.5+ year old in theharvest. Despite overpopulation, doe weights, lactation, and buck weights are above averagefor the Upper Coastal Plain soil region. This can partially be explained by this past winter’sbanner mast crop. Habitat conditions should continue to improve on the area with creation ofadditional food plots. Future timber management will create more cover and seasonal browsefor deer.WMA NarrativesDeer harvested on Sunflower WMA by Mark Allison on December 18th.2007-2008 Mississippi Deer Program Report19
2007-2008 Regional NarrativesWMA NarrativesNorth RegionWritten by: William T. McKinleyThe North region is experiencing some of the most rapidly expandingdeer herds in the state. Deer herds that have been afforded protectionon the antlerless side are becoming overpopulated. The sentimentagainst harvesting antlerless deer is still strong in the north region,and is the strongest of any region in the state. Overall, the herdappears relatively healthy over the past five years. However,site visits to this region have revealed grossly overpopulateddeer herds on the lands that continue to refrain from antlerlessharvest.Harvest rates dropped from 1 deer per 161 acres to 1deer per 193 acres. The summer drought in 2007 appearsto have caused decreased weights and lactationrates for the north region deer herd. Average lactationrates decreased by 4% and body weights ondoes decreased by 4 pounds. The percent of 3½+year old does in the harvest decreased, but is stillhigh at 49%, indicating an expanding herd.Buck harvest is changing due to increasing management.Hunters are realizing that age is a limiting factorin their harvest, and are choosing to let some statelegal bucks go. The percent of 4½+ year old bucks inthe harvest is on an increasing trend, but is still thelowest of any region in the state. However, even withthe increase in management, the percent of 1½ yearold bucks in the harvest continues to be higher in thenorth region than in most of the state.Hemorrhagic Disease, also known as bluetongue,was quite high in some localized areas, mainly in Tishomingoand Tippah Counties. While this disease did removesome deer from the herd, hunters should notworry. The deer will bounce back quickly in these areasand numbers will still need to be controlled.The frequent summer rains, coupled with whatappears to be a good acorn crop will improvethe health of the north region deer herd.In 2007, the late spring freeze practicallyeliminated the white oak crop. Fawn productionshould be high, helping this herdto increase even faster.West Central RegionWritten by:Lann M. WilfThe 2007-2008 hunting season tendedto be frustrating for hunters that insisted on hunting food plots. Although adequate rainand cool temperatures created favorable conditions for food plot growth, substantiallylower use by deer was consistently reported. This can be easily explained by the excellentacorn crop. Plentiful mast dispersed deer away from food plots and reduced overall deermovement. Most successful hunters spent large amounts of time in the woods around mastproducing trees and along travel corridors. Hunters on properties in the Batture, (land west ofthe Mississippi River levee), and on those enrolled in CRP and WRP did not see the significantreduction in deer movement because of a limited presence of mast producing trees. Althoughhunters reported a slightly lower overall harvest and reduce deer visibility, the quality of bucksharvested during the 2007-2008 was well above average. Visits with local taxidermists and reports202007-2008 Mississippi Deer Program Report
2007-2008 Regional Narrativesfrom hunters support this. Many bucks scoring over 150 Boone & Crockett inches were harvested region wide. This may be a result of huntersspending more time in the woods and not on food plots. However, more properties are making great strides at targeting bucks in the 4.5+year old age class, which is protecting more high quality 3.5 year old deer. Higher quality management in addition to hunters spending lesstime on food plots should yield a higher number of quality bucks.During 2007, the MDWFP gained the capability to pool and analyze all regional harvest data submitted by DMAP cooperators working withMDWFP biologists and approved private consultants. This provides a better analysis of herd parameters in the region. Analysis of the harvestdata for the past 10 years shows an increasing trend in the total number of deer harvested on DMAP properties in the Delta region. Thehighest harvest occurred in the 2006-2007 hunting season with 9,436 deer harvested (3,727 bucks and 5,709 does). The harvest slightly decreasedto 9,333 deer (3,735 bucks and 5,598) for the 2007-2008 season. The lowest harvest in the last ten years occurred in the 2000-2001season with 6,633 total deer taken. This is closely followed by the 1999-2000 season, in which 6,649 deer were harvested. The expansion ofdeer populations and subsequent harvest is a direct result of the enrollment of approximately 500,000 acres of farmland in CRP and WRP,which has increased available deer habitat. The population in the Delta region is literally exploding, and continued intense harvest is neededto control the deer density and maintain herd healthFor the past 10 hunting seasons, average body weights for bucks and does has remained stable. For the 2007-2008 season, antler measurementsfor 4.5+ year old bucks increased, even though more lower quality management bucks are included in the data. The harvestpercentage of 3.5+ year old bucks remained high at 67% for the 2007-2008 season. The percentage of 3.5+ year old does in the harvestdecreased to 45%.Reports of hemorrhagic disease throughout the region were not significantly higher than normal. Samples were collected once again forchronic wasting disease. All samples tested negative for the disease and chronic wasting disease has not been found in Mississippi.North Central RegionWritten by: William T. McKinleyThe North Central region once again had a productive deer season, although not quite as good as the 2006-2007 season. Harvest on DMAPproperties decreased from 1 deer per 97 acres to 1 deer per 101 acres, representing a total decrease of 274 deer. Harvest continues to beskewed towards females, with over 58% of the harvest being does. Mature buck harvest (4 ½+ year olds) decreased from 25% to 23% ofthe total buck harvest. Harvest percentages increased on 1.5 and 2.5 year old bucks by 2% and 1%, respectively. Overall, the herd appearsrelatively healthy over the past five years. However, localized areas are still overpopulated and are in desperate need of a change in management.The summer droughts of 2006 and 2007 appear to have had a minimal negative impact on the north central region deer herd. Averagebody weights on does increased by 1 pound for all but the 1.5 age class, with the average mature doe weighing 111 pounds. Lactation ratesincreased by 1-2% from the previous season. The percent of 3 ½+ year old does in the harvest decreased for the first time in several yearsbut is still high at 49%, indicating an expanding herd.The record acorn crop of Fall 2007 is likely the cause for both theincreases in herd health and the decrease in total harvest. Total movementand movement distance was reduced due to the abundance offood. This meant hunters saw fewer deer and thus harvested fewerdeer. The summer drought was relieved in early fall and food plotsgrew exceptionally well. However, deer usage on these plots was reduceddue to acorn abundance.Due to the good acorn crop, fawn production will be very high inSummer 2008. Deer herds were very healthy coming out of winterand summer growing conditions have been much more favorable in2008. Frequent rains have produced abundant browse. Preliminaryobservations are showing the acorn crop to be good again this year.With plenty to eat, deer observations may be low in the 2008-2009deer season.East-Central RegionWritten by: Amy C. BlaylockThe East Central Region had a relatively successful deer season.Reported harvest increased slightly by 178 deer. Acres per deer harvestedhave remained at approximately 1 deer per 100 acres over thepast several years.Regional NarrativesDeer harvested on Caston Creek WMAby Chris Galloway on December 5th.2007-2008 Mississippi Deer Program Report21
2007-2008 Regional NarrativesThe acorn crop in 2007 seemed to makea large impact on deer movement. The decreasednumber of deer sightings causedmany people to be concerned that their populationsize had dropped. However, because ofthe massive amounts of acorns, deer didn’thave to walk far to find food. In some areas,acorns were still on the ground in Februaryand March.During the summer of 2007, much of thecropland in Madison County was planted incorn. The increased acreage of corn has had apositive effect on body condition of deer. Becauseof the increase in corn production anda bumper acorn crop, we should expect anexcellent fawn crop in 2008.Although you may have seen fewer deerthis season, many large bucks were harvestedin areas that are not usually known for producingbig deer. Areas such as west Rankinand Simpson counties produced some qualitydeer this season. Areas in Madison County,along the Big Black River, where trophies areconsistently harvested, once again producedquality deer.Morgan Farris harvested this buck while hunting with her father on private land in Hinds County.Large areas planted in CRP pines, havereached a critical age that causes canopy closure. These pine stands are just about ready for their second thin. Once these areas have beenthinned, the amount of sunlight reaching the ground should increase the amount of deer browse available. Therefore, the outlook for futuredeer habitat is positive.Reports of hemorrhagic disease in east-central Mississippi remained about the same as last season. HD/Bluetongue was found in 4 countiesin east-central Mississippi. Samples were taken from hunter harvested and road killed deer for chronic wasting disease testing. No occurrenceof CWD was found.Regional NarrativesSouthwest RegionWritten by: Chris McDonaldThe 2007-2008 hunting season was not a good one for food plot hunters. Even though environmental conditions were good for food plotgrowth, hunters reported decreased harvest success on food plots. This can be easily explained by the bumper acorn crop. Plentiful acorns(both red oaks and white oaks) dispersed deer away from food plots and reduced overall deer movement. To be successful in harvest, mosthunters had to get into the woods and off food plots. Although hunters reported a lower harvest, the quality of bucks harvested during the2007-2008 was better than normal. Visits with local taxidermists and reports from hunters support this. Many bucks scoring over 150 Boone& Crockett inches were harvested, on both high and low fertile soils. Is this a result of more hunters actually hunting in the woods and notfood plots? I think it’s a strong correlation. Another explanation is that more hunters are managing for larger bucks. Couple hunting awayfrom food plots and better management, the result should be higher quality bucks.During 2007, the MDWFP gained the capability to pool and analyze all regional harvest data submitted by DMAP cooperators working withMDWFP biologists and approved private consultants. This provides a better analysis of herd parameters in the region. Analysis of the harvestdata for the past 10 years shows a decreasing trend in the total number of deer harvested on DMAP properties in the Southwest region. Thehighest harvest occurred during the 2002-2003 hunting season with 7,562 deer harvested (2,975 bucks and 4,108 does). The harvest hassince decreased to 5,997 deer (2,197 bucks and 3,698) for the 2007-2008 season. This is largely due to a decrease in the number of DMAPcooperators and acreage enrolled in DMAP.For the past 10 hunting seasons, average body weights for bucks and does has remained stable. For the 2007-2008 season, antlermeasurements for 3.5 and 4.5 year old bucks increased, even though more lower quality management bucks are included in the data. Thepercentage of 3.5+ year old bucks harvested remained high at 59% for the 2007-2008 season. The percentage of 3.5+ year old does in theharvest decreased to 47%.Reports of hemorrhagic disease throughout the region increased significantly. This was expected because reports of hemorrhagic diseasehave been limited over the past 4 years. Samples were collected once again for chronic wasting disease. All samples tested negative for thedisease and chronic wasting disease has not been found in Mississippi.222007-2008 Mississippi Deer Program Report
2007-2008 Regional NarrativesSoutheast RegionWritten by: Chris McDonaldConditions going into the 2007-2008 hunting season were good for a successful hunting season. Deer harvest for the two previous seasonsdecreased drastically due to Hurricane Katrina. Because of the decrease in hunting opportunity, many deer were carried over for the2007-2008 season.During 2007, the MDWFP gained the capability to pool and analyze all regional harvest data submitted by DMAP cooperators working withMDWFP biologists and approved private consultants. This provides a better analysis of herd parameters in the region. During the 2005-2006hunting season (the year of Katrina), DMAP deer harvest was at a 10-year low. However, the rebound has begun. Reported DMAP harvestincreased by 148% for the 2007-2008 season compared to the year of Katrina. A high increase was also reported on WMAs. The increase inharvest is the direct result of more hunters in the woods and more deer available after hurricane recovery efforts. The percentage of 3.5+ yearold bucks was at a 10-year high with 60% of bucks harvested being 3.5+ years old. The decrease in harvest due to Katrina actually helped thebuck age structure by protecting more young bucks from harvest.Hurricane Katrina provided more deer habitat by thinning dense timber and creating more natural openings. The deer herd in the regionmay be beginning to illustrate the beneficial effects of Katrina. One year after Katrina, many biological parameters actually decreased. Thismay be due to decreased deer harvest and insufficient time for habitat recovery. However, many biological parameters increased for the 2007-2008 season, 2 years after Katrina. With more browse growth, more prescribed burning, and increased deer harvest, we may be seeing thebeginning of an increase in herd health. Only time will tell.Deer harvested on Twin Oaks WMA by Kelly Kennedy on December 8th.The hunters found the buck on the right, which was shot a few days earlier.Regional Narratives2007-2008 Mississippi Deer Program Report23
MDWFP personnel have monitored statewide deer road kill sinceJanuary 1997. All dead deer observed on or adjacent to roads andhighways are recorded during the personnel’s regular course of travelfrom October 1-January 31. Cause of death of these animals is assumedto be a vehicle collision. Specific location by county is recorded for everydeer observed. Personnel also record their monthly mileage. In thepast, average number of deer observed per 10,000 miles was calculatedby district. However, with changing district lines and MDWFP personnelroutinely traveling outside their home district, we have changed this to astatewide average and not district averages.Graphical monthly statewide summaries of these data are presentedin Figure 2. The precise value and accuracy of this method of data collectionhave not been critically evaluated. No evaluation has been madeto determine if number of vehicles on the highways has increased, decreased,or remained constant. Therefore, any inferences or interpretationof these data should be approached cautiously. Every effort has beenmade to standardize sampling protocol.When these data are examined graphically, fluctuations over time areapparent. Certain assumptions may be logical. For example, an increaseRoad Kill Survey Report2007-2008Road Kill Data By Month(In Deer Per 10k Miles) 2007-2008in observed deer vehicular related mortality is a result of increased deeractivity. Data are currently collected from October-January. Activitypeaked during the fall and winter around breeding seasons, when deeractivity is at its highest.A second assumption is if deer numbers are fluctuating annually andnumber of deer observed is density dependent, then in lower populationyears, fewer road-killed deer will be observed. Conversely, during highpopulation years, a greater number of road-killed deer will be observed.During the 2007-2008 deer season, observed road kills were slightlylower than the 2006-2007 season. However, this is likely not a resultof a reduced deer population. In addition to increasing or expandingdeer herds, road kill observations may be heavily influenced by weatherconditions and mast availability. Instead of assuming that populationsdecreased during the 2007-2008 deer season, the slight reduction inobserved road killed deer is probably a direct result of a heavy mastcrop that was prevalent throughout most of the state. This past year, observedroad kills only increased during the month of October. Observedroad kills decreased the most in November and were slightly reduced inDecember and January. This is likely due to decreased deer movementfrom exceptional mast availability throughout most regions of the state.We also collect road-kill data fromtwo outside sources: State Farm InsuranceCompany and The MississippiOffice of Highway Safety. Accordingto State Farm’s estimates, there were12,146 deer-vehicle collisions in 2005-2006, 13,197 in 2006-2007 and 13,954in 2007-2008. These estimates fit theincreasing trend from MDWFP personnel’sroad-kill observations.The data from State Farm has beenprojected for the whole insurance industry,based on State Farm’s knownauto insurance market share within eachstate. This data is based on actual comprehensiveand collision claims, and assuch, would not include deer-vehiclecollisions where the policy holder hadonly liability insurance coverage (whichis typically carried on older vehicles insome states).Figure 2Road Kill SurveyTable 3. Road Kill Data By Month (In Deer Per 10k Miles)2007-2008Month 2002-2003 2003-2004 2004-2005 2005-2006 2006-2007 2007-2008 Avg. all YearsOctoberNovemberDecemberJanuarySeason Avg.6.38.15.98.37.25.98.610.48.38.36.67.310.19.58.46.59.213.011.210.08.411.112.811.811.08.89.312.011.210.37.18.910.710.1242007-2008 Mississippi Deer Program Report
Depredation By DeerConservation officers annually deal with agricultural depredation bydeer. Landowners who experience deer depredation problems arerequired to apply for a permit before any action is taken to harass orremove problem animals. The process for permit issuance includesan on-site evaluation by an MDWFP officer to verify the occurrenceof depredation. Permits are issued primarily for agricultural damage,but ornamental vegetation is included. Miscellaneous problemssuch as deer on airport runways also occur and are handledon a case-by-case basis. Property owners should knowthat permits are not issued in every situation.A total of 81 depredation permits were issued in 32counties during 2007, which was equal to the numberof permits issued during 2006. However, the numberof counties in which depredation permits wereissued increased from 27 to 32. The number ofpermits issued by county are shown in Figure 3.This high number of permits can be attributed toa lack of adequate deer harvest during the huntingseason and the effects of drought stress onvegetation. Cases of deer depredation includeddamage to soybeans, corn, cotton, peas, wheat,alfalfa, sweet potatoes, watermelons, pumpkins,cantaloupes, gourds, peanuts, pecans, bell peppers,numerous garden and truck crops, blueberrybushes, flowers, garden shrubs, and interferenceon airports.The preferred method of controlling deer depredationproblems is adequate hunter harvest. Thislowers the deer population to levels that are in balancewith the environmental carrying capacity of thehabitat. Normally this involves cooperation amongadjoining landowners and hunting clubs.Alternative direct methods used to solve depredationproblems include scare or harassmenttactics, assorted chemical applications, electricfencing, and traditional fencing at a height thateliminates deer access. High fencing aroundgardens and small problem areas is costlybut provides assured control on a longtermbasis with little or no maintenance.In some instances, after other controlmeasures have been exhausted,deer will be lethally removed. Thisprocess seldom provides a longtermsolution but is used in someproblem situations.Depredation problems will continueto occur in Mississippi as long asFigure 3abundant deer populations exist. Extensiveproblems with agricultural depredation can be controlledwith adequate antlerless harvest. Instances of urban depredationare increasing due to escalating deer numbers and urban sprawl.Urban deer problems are magnified in cities where bowhuntinghas been banned.Depredation2007-2008 Mississippi Deer Program Report25
Chronic Wasting DiseaseDisease DataChronic wasting disease (CWD) is a progressively degenerativefatal disease that attacks the central nervous system of membersof the deer family. To date, it has been diagnosed in elk, muledeer, black-tailed deer, white-tailed deer, and most recently moose.CWD is one of a group of diseases known as transmissible spongiformencephalopathies (TSEs). These diseases are characterized astransmissible because they can be transmitted from one infected animalto another. They are further classified as spongiform due to the“spongy-like” areas which form in the brain of the infected animal,hence the encephalopathy portion of the name.The scientific community generally accepts that the infectiousagents of CWD are prions. Prions are abnormal proteins that seemto have the ability to alter the structure of normal proteins found inthe body of the animal they enter. Logical natural methods of priontransmission include, but may not be limited to, secretions and excretionsfrom infected animals. A study conducted at Colorado StateUniversity found that CWD can be transmitted experimentally fromsaliva and blood. Also, human activity contributes to environmentalprion contamination. Prions are hideously durable and impervious tomost disinfectants and natural conditions, remaining in the environmentfor years.Animals suffering from CWD typically behave abnormally by separatingthemselves from their usual social group. They often standalone, with a drooped posture, and may not respond to human presence.As the disease progresses, they will appear emaciated on closeexamination and will salivate, drink, and urinate excessively.The goal for the 2007-2008 monitoring period was to test approximately1,500 deer statewide. Routine testing involved Mississippihunters in this disease monitoring effort. Hunters throughout thestate were asked to voluntarily submit the heads of harvested deerfor CWD testing. Additionally, samples were obtained from taxidermistsand deer processing facilities. Most of these samples camefrom Deer Management Assistance Program (DMAP) cooperators,Wildlife Management Areas, MS Band of Choctaw Indians TribalLands, and National Wildlife Refuges.A total of 1,215 samples were taken from free-ranging white-taileddeer in Mississippi during 2007-2008. Samples were obtained fromhunter harvested animals, spring herd health evaluations, target animalsurveillance, and road-killed animals. Samples were obtainedfrom 71 counties (Figure 4). The samples were submitted to theSoutheastern Cooperative Wildlife Disease Study at the University ofGeorgia following the 2007-2008 hunting season. Of those samples,1,203 were tested for evidence of the CWD agent using immunohistochemistry.The remaining 12 samples were not tested becausethe containers either did not contain testable specimens or incorrecttissues were collected. Evidence of CWD was not detected.The MDWFP, in cooperation with the Mississippi Board of AnimalHealth and the U.S. Department of Agriculture/Veterinary Serviceswill continue target animal surveillance. A target profile animal is anyadult cervid that is emaciated and shows some neurological disorder.These target animals should be reported to the local county conservationofficer who has been trained to properly handle them and coordinatetheir transport to the appropriate laboratory for CWD testing.Most deer exhibiting symptoms of CWD are actually suffering fromother conditions or diseases common to white-tailed deer in Mississippi.Malnutrition, hemorrhagic disease, brain abscesses, and otherconditions may cause some of the same symptoms. However, due tothe seriousness of CWD and the importance of early detection andcontrol, it is necessary to test target animals for infection. The abilityto diagnose this disease is dependent on quick reporting becausedeer carcasses deteriorate rapidly in Mississippi’s climate.In 1967 CWD was first recognized at a captive mule deer researchfacility in Colorado. A Wyoming research facility documented thedisease in deer and elk in 1978. CWD was then documented in freerangingdeer in Colorado and Wyoming in the 1980s. Further testingfrom 1996 through the end of 2001 found additional positive animals(either captive or wild elk or deer) in Kansas, Nebraska, Montana,Oklahoma, South Dakota, and the Canadian provinces of Saskatchewanand Alberta. Then in February 2002 the first case was confirmedeast of the Mississippi River in Wisconsin, in wild white-taileddeer. In 2004, CWD was found in New York and West Virginia. As ofJuly 1, 2008, there are 11 states with CWD infected wild populations(Colorado, Illinois, Kansas, Nebraska, New Mexico, New York, SouthDakota, Utah, Wisconsin, West Virginia, and Wyoming) and two Canadianprovinces (Alberta and Saskatchewan). Additionally, CWD hasbeen found in captive cervid populations in all of the above states aswell as Minnesota, Montana, and Oklahoma.All public health officials maintain that venison is safe for humanconsumption. However, hunters who wish to take additionalsteps to avoid potential unnecessary contact with prions or environmentalcontamination can do the following:• Avoid shooting, handling, or consuming any animal that appearssick. Contact the MDWFP at 601-432-2199 if you see or harvestan animal that appears sick.• Wear latex gloves when field dressing or processing deer.• Avoid eating or contact with brain, spinal cord, spleen, lymphnodes, or eyes.• Cut through the spinal cord only when removing the head. Use aknife designated solely for this purpose.• Bone out meat to avoid cutting into or through bones. Remove allfat and connective tissue to avoid lymph nodes.• Dispose of all carcass material, including the head, in a landfill orpit dug for carcass disposal purposes.• Either process your animal individually or request that it be processedwithout adding meat from other animals.• Disinfect knives and other processing equipment in a 50% bleachsolution for a minimum of one hour.• Discontinue baiting and feeding which unnaturally concentratedeer.Deer With Chronic Wasting Disease from Wisconsin262007-2008 Mississippi Deer Program Report
Chronic Wasting DiseaseNumber of samplescollected per county**CDW has not been foundin Mississippi.Disease DataFigure 42007-2008 Mississippi Deer Program Report27
Epizootic Hemorrhagic DiseaseDisease DataHemorrhagic Disease (HD), sometimes referred to as EpizooticHemorrhagic Disease (EHD) or Bluetongue (BT), is consideredthe most important viral disease of white-tailed deer in the UnitedStates. Different subtypes of two closely related viruses cause HD:EHD and BT. Technically, there are five subtypes of BT virus and twosubtypes of EHD virus. A distinguishable difference does not visuallyexist between these diseases, so wildlife managers normally groupthe symptoms into one category and refer to the condition as HD.Biting midges of the genus Culicoides transmit HD; therefore, thedisease is seasonal, based on the abundance of midge vectors. Normaloccurrence of HD is late summer through fall (approximately lateJuly-November). Deer that become infected with the HD virus mayexhibit a variety of outward symptoms. Some mildly infected deer willexhibit few symptoms. Others which contract a more potent form ofthe virus will appear depressed, become feverish, have swollen areasaround the head or neck, and may have trouble breathing. Howeverothers, which become infected with a particularly potent form of thevirus, can die within 1 to 3 days. Normal mortality rates from HD areusually less than 25 percent. However, rates greater than 50 percentof the population have been documented. On a brighter note, HD hasdestroyed no free-ranging deer population.HD is first suspected when unexplained deer mortality is observedin late summer or early fall. Typically, archery hunters who are scoutingduring late September are the first to observe carcasses in thewoods. On some occasions HD deer are found dead during the latesummer in or adjacent to water. The fever produced by the diseasecauses the sick deer to seek water. These deer subsequently succumbto the disease in creeks and ponds.Hunters will most frequently encounter the evidence of HD whileobserving harvested deer during the winter months. During the highfever produced by HD, an interruption in hoof growth occurs. Thisgrowth interruption causes a distinctive ring around the hoof, whichis readily identifiable on close examination. Hoof injury, as well asbacterial or fungal infection can cause a “damaged” appearance on asingle hoof. HD is not considered unless involvement is noticed ontwo or more feet.Fortunately, people are not at risk by HD. Handling infected deeror eating the venison from infected deer is not a public health factor.Even being bitten by the biting midge that is a carrier of the virus isnot a cause of concern for humans. Deer, which develop bacterialinfections or abscesses secondary to HD, may not be suitable forconsumption.The case is not as clear regarding domestic livestock. A small percentageof BT infected cattle can become lame, have reproductiveproblems, or develop sore mouths. Variations exist between BT andEHD virus infection in cattle and domestic sheep. Sheep are usuallyunaffected by EHD but can develop serious disease symptoms withthe BT virus.Occasionally overpopulation of the deer herd has been blamed foroutbreaks of HD. Abnormally high deer populations are expected tohave greater mortality rates because the deer are in sub-optimal condition.Spread of the virus would be expected to be greater in densedeer herds. However, an outbreak of HD cannot be directly attributedto an overpopulated deer herd.HD can be diagnosed several ways. A reliable tentative diagnosiscan be made after necropsy by a trained biologist or veterinarian. Aconfirmed diagnosis can only be made by isolating one of the virusesfrom refrigerated whole blood, spleen, lymph node, or lung from afresh carcass.MDWFP biologists have been monitoring the presence of HD inMississippi by several methods: sudden, unexplained high deer mortalityduring late summer and early fall, necropsy diagnosis, isolationof EHD or BT virus, and observation of hoof lesions on hunter-harvesteddeer. HD or previous HD exposure is always present in Mississippideer herds. Previous HD exposure is good. Exposure yieldsantibodies to future outbreaks of the disease. Without the antibodypresence, significant mortality would occur. See Table 5 for virusisolation results from the 2007 deer herd health evaluations. All sevenstrains of HD were found in Mississippi’s deer herd during 2007.The 2007-2008 hunting season produced a moderately high HDoccurrence. Evidence of HD was reported in 35 counties during the2007-2008 hunting season (Figure 5). Researchers have documenteda distinctive 2-3 year cycle in HD outbreaks. Assuming that thesecyclic outbreaks occur, we can expect a high occurrence of HD duringthe 2008-2009 hunting season.Biting Midge(Culicoides spp.)Transmits EHDMouth Lesions from EHDHoof Sloughingfrom EHD282007-2008 Mississippi Deer Program Report
Epizootic Hemorrhagic Disease# of Deer Diagnosed with HDDisease DataFigure 52007-2008 Mississippi Deer Program Report29
2008 Deer Herd Health EvaluationsHerd HealthPhoto by Christopher SheaDeer herd health evaluations are conducted by MDWFP biologistsannually. Evaluation sites are selected each year based ona specific need for additional information, which cannot be obtainedfrom hunter-harvested deer. These sites may be on DMAP cooperatorlands, WMAs, open public lands, or areas with a special deermanagement concern. Some sites are sampled annually, others ona rotational schedule of two – three years, and some locations on anas-needed basis.Time constraints normally limit the number of locations biologistssample each year. Deer collections are normally conducted duringFebruary, March, and April. Collection timing must be late enoughto insure that all does have been bred, but early enough to precedespring green-up when foliage density reduces the ability to readilyobserve and identify deer. The sampling window is most critical inthe southern portion of the state where late breeding is a chronicproblem and early green-up of vegetation occurs.Biologists complete an application for approval to conduct eachherd health evaluation during a specific time period. The MDWFPDeer Committee reviews these applications and denies or grants approval.Other agency personnel assist the biologist in charge of thedeer collection. When non-agency personnel are participating in theprocess, specific prior approval is obtained on the application.During a typical herd health evaluation, biological data regardingreproduction, body condition, and disease are collected from maturefemales. A minimum of 10 mature females is necessary to obtain anadequate sample size to assess herd parameters. Mature does arecollected during the late afternoon on food plots or at night with theaid of a light from a truck platform, which has been designed specificallyfor this purpose. Other deer are occasionally taken by mistakeduring the collection process. Data are obtained from all deer but thepurpose of the evaluation is to obtain reproductive, physical condition,and disease data from mature females. All measurements anddata are obtained from the deer on site or at a convenient nearbylocation. All deer are donated to a charitable institution or to an individualdetermined needy by agency personnel. Neither deer nor portionsthereof are utilized by any MDWFP employees. Receipts areobtained from every deer donated. Rarely, instances have occurredwhere deer had to be disposed of in a manner where human utilizationwas not possible.ReproductionReproductive data collected during herd health evaluations includeconception dates, fawning dates, number of corpus lutea per doe,and number of fetuses per doe. Conception dates and fawning datesare determined using a fetal aging scale. Fetal length is measuredon the fetal aging scale and the length is used to calculate conceptionand fawning dates. Breeding date ranges for Mississippi are presentedin Figure 6. Data from the 2008 statewide deer herd healthevaluations are given in Table 4. Data were collected from 174 deeron 19 sites across the state.In Table 4, conception date ranges and corresponding fawningdates are given for each collection site. The earliest conception date(November 26) was detected at Sunflower WMA in Sharkey County.The latest conception date (February 29) was detected on Pace HuntingClub in Jefferson Davis County. Mean fawning dates based onthe conception dates ranged from June 23 on Ashbrook Island inWashington County to August 6 on Pace Hunting Club in JeffersonDavis County. The statewide average conception date was December29 and the corresponding state average fawning date was July 12.Sample sizes for each collection site are given as N1 or N2. Differentgroupings by age and sex are mandatory to accurately interpretcondition and reproductive data. Total 1.5+ year old fecund (capableof breeding) does are represented as N1. Mature 2.5+ year old doesare represented as N2. Both N1 and N2 deer are utilized to calculateconception dates, but only N2 deer are considered in the samplewhen reproductive rates and condition data are compared.302007-2008 Mississippi Deer Program Report
2008 Deer Herd Health EvaluationsData comparing conception ranges and mean conception dates areself-explanatory. Average number of corpus lutea (CLs) is determinedby examination of the ovaries of each N2 deer in the sample andcounting the number of CLs present. A CL is a structure in the ovarywhich forms when an egg is released. The CL functions to maintainpregnancy by the release of hormones. As in domestic livestock,healthy deer on a high plane of nutrition will produce more eggs thandeer on poor nutrition. Therefore, CL data provide a quantitative indexto gauge not only reproductive performance at a specific site butalso a general index to overall herd condition. CL data ranged from alow of 1.8 CLs per doe on Magna Vista – Section in Issaquena Countyand Pace Hunting Club in Jefferson Davis County to a high of 2.5 CLsper doe on Sunflower WMA in Sharkey County.Average number of fetuses are also self-explanatory, but will, inmost instances, be a lower number than average number of CLs becauseall CLs do not represent a viable fetus. As average numberof CLs provides an index to reproductive rates and herd condition,average number of fetuses per doe provides an additional index todetermine site-specific herd health. Average number of fetuses perdoe ranged from a low of 1.7 on Ashbrook Island in WashingtonCounty to a high of 2.4 on Cameron Plantation in Madison County.Body ConditionBody condition data collected during herd health evaluations includedressed weight and kidney fat index (KFI). Average dressedweight only includes N2 deer. A wide range of weights are apparentdue to soil type, deer herd condition, and habitat type. In general,dressed weight is a reliable indicator to help gauge herd conditionbut should not be used to compare different sites unless all soil andhabitat types are uniform.KFI provides a quantitative index to energy levels within a deerherd. KFI is calculated by expressing the weight of kidney fat as apercentage of kidney weight. Substandard kidney fat levels werefound at several areas. The highest value during 2008 was seen onCameron Plantation in Madison County. Overall, KFI was above averagein 2008. This was a direct result of the record acorn crop duringthe fall of 2007.DiseaseDuring deer herd health evaluations, blood serum samples are collectedfrom each deer. The serum samples are tested for antibodiesto various sub-types of Hemorrhagic disease (HD). HD can becaused by several different strains of either epizootic hemorrhagicdisease (EHD) virus or bluetongue (BT) virus. Presence of antibodiesindicates previous exposure, not current infection. Due to time constraints,serotype information for 2008 has not yet been analyzed.However, serotype information from the 2007 Deer Herd HealthEvaluations are shown in Table 5, because this information was notavailable at the printing of the previous Deer Program Report. Deerfrom 22 of the 27 collection sites tested positive for EHD virus, anddeer from 23 of the 27 collection sites tested positive for BT virus.Only one site tested negative for both EHD virus and BT virus.Herd HealthPhoto by Christopher Shea2007-2008 Mississippi Deer Program Report31
2008 Deer Herd Health EvaluationsTable 4. Deer Herd Health Evaluation Summary for 2008Herd HealthSoil AreaDate ofRange of#Collection SiteCollection N1 N2 Conception1 Batture Ashbrook Island, Washington County 7-Feb 11 7 29-Nov 25-Dec 10-Dec 23-Jun 1.9 1.7 85.7 81.52 UCP Big O HC, Monroe County 4-Mar 8 5 10-Dec 22-Jan 9-Jan 23-Jul 2.2 1.8 77.6 84.63 UThick Breakwater HC, Yazoo County 4-Mar 10 9 27-Nov 1-Jan 11-Dec 24-Jun 2.0 1.9 99.6 151.84 UThick Cameron Plantation, Madison County 25-Feb 8 8 5-Dec 9-Jan 28-Dec 11-Jul 2.3 2.4 99.9 247.45 UThick Clifton, Holmes County 26-Feb 7 6 7-Dec 12-Jan 23-Dec 6-Jul 2.0 1.8 90.0 157.46 LThin Cotton Branch, Franklin County 11-Mar 7 5 23-Dec 31-Jan 3-Jan 17-Jul 2.0 1.8 94.4 131.97 Batture Davis Island, Warren County 5-Mar 11 10 6-Dec 26-Jan 4-Jan 18-Jul 1.9 1.9 96.4 132.48 UThin Horseshoe Lake, Madison County 28-Feb 10 9 17-Dec 6-Feb 5-Jan 19-Jul 2.1 2.1 93.2 178.89 UCP Jumper Lake HC, Tippah County 10-Mar 10 7 27-Nov 13-Jan 16-Dec 29-Jun 2.0 2.0 72.0 58.510 Batture Magna Vista - Section, Issaquena County 4-Mar 7 5 16-Dec 21-Jan 5-Jan 19-Jul 1.8 1.8 93.4 150.111 Batture Magna Vista, Issaquena County 4-Feb 11 10 17-Dec 14-Jan 29-Dec 12-Jul 1.9 2.0 96.2 132.412 Delta Mahannah WMA, Issaquena County 28-Feb 11 10 8-Dec 15-Jan 23-Dec 6-Jul 1.9 1.9 102.5 99.713 LCP Marion Co WMA, Marion County 12-Mar 9 8 8-Dec 20-Jan 31-Dec 14-Jul 2.0 1.9 70.1 35.414 CF NASA Ammo Plant, Hancock County 2-Apr 8 8 27-Dec 15-Jan 3-Jan 17-Jul 1.9 1.8 76.8 40.515 LCP Pace Hunting Club, Jefferson Davis County 10-Mar 7 6 22-Dec 29-Feb 23-Jan 6-Aug 1.8 2.0 76.0 65.016 LThick Sligo - Ellislie, Adams County 26-Feb 9 9 18-Dec 5-Feb 13-Jan 27-Jul 1.9 1.8 95.8 185.617 UCP Smallwood JA Young, Winston County 4-Mar 10 9 17-Dec 14-Jan 31-Dec 14-Jul 2.0 2.1 81.8 132.818 Delta Sunflower WMA, Sharkey County 10-Mar 11 10 26-Nov 11-Jan 22-Dec 5-Jul 2.5 2.2 109.0 138.419 Delta Twin Oaks WMA, Sharkey County 6-Mar 9 9 8-Dec 11-Jan 20-Dec 3-Jul 2.0 2.1 112.0 183.0Total: 174 150 Average: 29-Dec 12-JulN1 = Total 1½ year-old or older fecund (capable of breeding) does N2= Mature 2½ years old and older doesMean Conception DateMean FawningDateAverage # CLSAverage # FetusesAvg. Dressed WeightAverage KFIPhoto by Christopher Shea322007-2008 Mississippi Deer Program Report
2008 Deer Herd Health EvaluationsTable 5. 2007 Serologic Test Results for Antibodiesto EHDV and BTV in Mississippi White-tailed DeerLocation County Number of Samples Prevalence SerotypesAttala County AssociationAttala 15 53% E1, E2, B2, B10, B11, B13Togo IslandClaiborne 10 60% E1, E2, B10Wilderness ForeverClaiborne 2 100% E1, E2, BTV*Williams FarmCoahoma 9 11% B11Coahoma County Conservation League Coahoma 11 64% E1, E2, B10, B11Copiah County WMACopiah 10 40% E1, E2, B10, B11Cotton Branch PlantationFranklin 2 50% E1, E2, BTV*Mahannah WMAIssaquena 10 60% E1, E2, B2, B10, B11, B13, B17Canal Section WMAItawamba 10 80% E1, E2, B10, B11Triple Creek Game FarmJasper 10 90% E1, E2, B2, B10, B11, B13, B17Bozeman PropertyMadison 11 64% E1, E2, B2, B10, B11, B13, B17Cameron PlantationMadison 5 0%Horseshoe LakeMadison 3 33% E1, E2, BTV*Yates PropertyNoxubee 15 73% E1, E2, B2, B10, B11Hamer WMAPanola 11 82% E1, E2, B10, B11Leaf River WMAPerry 11 45% E1, E2, B10, B11InfolabQuitman 6 83% E1, E2, B10Twin Oaks WMASharkey 10 20% E1, E2, B2, B10, B11Sunflower WMASharkey 7 100% E1, E2, B2, B10, B11, B17Old Pearl Game ManagementSimpson 3 67% EHDV*, BTV*Tallahatchie/PinhookTippah 11 45% E1, E2, B10Divide Section WMATishomingo 11 64% E1, E2, B10MagnoliaWarren 11 55% E1, E2, B2, B10, B11Archer IslandWashington 11 45% E1, E2, B10, B11Herd HealthBiologists conducting a herd health evaluation on aDMAP property in the Delta. Photo courtesy of MDWFP.2007-2008 Mississippi Deer Program Report33
2008 Deer Herd Health EvaluationsBreeding Date RangeHerd HealthFigure 6342007-2008 Mississippi Deer Program Report
Statewide Sex Ratio and Fawn Crop EstimatesThe MDWFP began distributing BowhunterObservation Books before the 2005 deerarchery season. Distribution of the BowhunterObservation Books has increasedin the following years. Mark Berneggerwith Southern Outdoor Technologies (WestPoint, MS) donated a deer stand retailingalmost $1,000 to help increase participationduring 2007. This stand was given away inDecember through a random drawing of returnedobservation books. Michael Mosesof Terry, MS, was the winner. Mr. Berneggerhas committed to another stand for the2008 season. The Mississippi BowhuntersAssociation and Haas Outdoors have committedto gifts as well. To be eligible for thedrawing, bowhunters record deer observedduring each bowhunt in Mississippi and returnthe book by the deadline of December1, 2008.Bowhunter Observation Books were distributedthrough sporting goods stores, feedstores, and were available online. Over 2,000books were distributed during September2007. A total of 118 books were returnedby the December 1st deadline. Participatingbowhunters observed 6,008 total deer yielding1.06 deer per hour. Bowhunters recorded 5,669.75 hours in 57counties. A description of deer observed is shown in Table 7. Datacollected was not sufficient to estimate sex ratio and fawn crop bycounty.Bowhunter Observation Books produced very similar statewide estimatesfor the past three years (Table 6). According to this data, Mississippihad about 3 does for every buck, and about 1 fawn for every 2does going into the 2007 hunting season.Referring to Table 6, the number of deer observed per hour of bowhuntinghas remained relatively unchanged over the past three years.However, some trends are noticeable. The number of does per buckappears to be increasing, suggesting that hunters are not harvestingenough antlerless deer in Mississippi. Number of fawns per doe is ona decreasing trend. A combination of factors such as overpopulation,Photo by Christopher Sheathe 2007 drought, and an increase in Hemorrhagic Disease could resultin decreasing fawn crops. Following the exceptional mast crop of2007 and relatively wet spring of 2008, the fawn crop is expected toincrease during 2008 in most areas. However, spring flooding alongthe Mississippi River could negatively impact the fawn crop in the Batturesoil region.We plan to continue distributing Bowhunter Observation Books during2008. If you would like to assist the MDWFP in collecting deerobservation data during archery season, and automatically enter intothe random drawings, you may download the book from our website(www.mdwfp.com/deer), email williamm@mdwfp.state.ms.us, or call601-432-2199 to request a book. If calling or emailing, please providea physical address to mail the book. Thanks to all bowhunters whohave assisted in collecting this data.Sex RatioTable 6. Bowhunter Observation Results 2005-2007Year Sex Ratio Fawn Crop Deer Observed Per Hour2005 1 Buck : 2.4 Does 0.6 Fawns : 1 Doe 1.062006 1 Buck : 2.69 Does 0.52 Fawns : 1 Doe 1.112007 1 Buck : 2.92 Does 0.43 Fawns : 1 Doe 1.06Table 7. Total Hours and Deer Observed in 2007Total Hours 2-3 Points 4-7 Points 8+ Points Does Fawns Unknown Deer5,669.75 549 288 188 2,993 1,294 6962007-2008 Mississippi Deer Program Report35
Deer TagsDeer TagsManagement Buck TagsDuring the 2003-2004 season sub-4 point bucks were legal forharvest for the first time since 1995. Sub-4 point tags were issuedby biologists to DMAP properties on a limited basis for managementpurposes. During the 2005-2006 season, tags were expandedto include management bucks. Management buck tags were issuedto DMAP properties allowing additional harvest of sub-optimal bucks.Tagged bucks did not count against the annual bag limit. During the2006-2007 season, tagged bucks did not count against the annual anddaily bag limit. The management buck harvest criteria were for an individualproperty and were determined by the DMAP biologist. A writtenmanagement justification issued by the MDWFP must accompany anyrequest for such a permit. Management bucks harvested under thispermit must be identified with a tag immediately upon possession.Permits were issued to the following WMAs for the 2007-2008season: Calhoun, Hamer, Lake George, Leroy Percy, Mahannah, Malmaison,O’Keefe, Shipland, Stoneville, Sunflower, Twin Oaks, UpperSardis, and Yockanookany. A total of 1,819 permits were issued tothese WMAs and 55 of these permits were used. The number of bucktags issued to WMAs since the 2003-2004 season has increased from164 to 1,819; however, reported usage of these tags remains low (Figure7).Permits were issued to the following 119 DMAP properties for the2007-2008 season: 11 Shot, 27 Break, 3 Creeks, Arkabutla COE, Ashbrook,Atwood, Backwater Brake, Barefoot, Beech Ridge, Belle ChasePlantation, Bellweather, Big Black Wildlife, Big River Farms, BighornSportsman, Black Bear, Black River, Bledsoe, Bogue Falia, Bonanza,Box B, Bozeman Farms, Breakwater, Brierfield, Brooksville, Bucksnort,Burke, Burl Branch, Cameron Plantation, Canemount Plantation,Casey Jones, Catfish Point, CGM, Chesterfield, Chief, Circle M, ClantonFarms, Clifton Plantation, Coahoma County Conservation League,Craigside Plantation, Dale Pierce, Dancin’ Coyote, Dancing Rabbit,Deer Creek, Delta Wildlife, Deviney Enclosure, Deviney Free Range,Dry Creek Lodge, Donaldson Point, Dry Grove, Duck Lake, Eastline,Egypt, Elliote Lake Farm, Ellislie, Fairview, Gaddis Farm Heifer Pasture,Goat Hill, Halifax, Hardtimes, Hartwood, Higgs, Hightower, Homewood,Horseshoe Lake, Hunters Chapel, Irwin, Itta Bena, Jack Robertson,Jay Powell, Jeff H.C., MacDuff, Magna Vista, Melton Property,Merigold, Millbrook, Miller Point, Montgomery Farms, Moore Farms,Mt. Ararat Plantation, Noxubee Refuge, Noxubee-Kemper County Line,Outpost, Palmer Farms, Palmyra, Paradise, Pinecrest, Pinhook, Prewitt,Providence, Red Gate, Refuge, Richard Reid, Riverland, Riverside,Rosedale, Smallwood, Solitude, Steve Ingram, Strong, Sun Creek, T.F.Chaney, TCP, Togo Island, Triple C, Triple Creek, W.W. Miller, WardLake, Williams Farms, Willow Break, Willow Oaks 1, Willow Oaks2,Wolf Creek Outfitters, Wood Burn, Woodstock, Wrights Creek, Y &S, Yalobusha Farms, Yates, and Yellow Creek. A total of 1,991 permitswere issued to these properties and 1,036 of these permits were used.The number of DMAP properties receiving tags has increased from 13to 119 since the 2003-2004 season. The number of buck tags issuedto DMAP properties since the 2003-2004 season has increased from358 to 1,991, and the number of buck tags used since the 2003-2004season has increased from 262 to 1,036 (Figure 8).DMAP Antlerless TagsMDWFP issues antlerless tags to DMAP properties. This allows theharvest of antlerless deer in excess of the annual and daily bag limits.These tags have been issued since the implementation of DMAP.An example of proper usage of a management buck tag.When antlerless seasons were liberalized statewide, the need for antlerlesstags was reduced. However, some landowners and managersstill have the need for more antlerless harvest than state bag limitsallow.Antlerless tags are issued by the DMAP Biologists, based on anindividual landowner’s or manager’s need. The tags can only be usedon antlerless deer on the property to which they were issued.DMAP biologists issued 4,803 tags to 173 DMAP clubs during the2007-2008 season. The increase in tags issued since the 2003-2004season correlates to increased interest in deer management in Mississippi(Figure 9).Fee ManagementAssistance ProgramThe Fee Management Assistance Program (FMAP) was implementedduring the 1989-1990 season. It began as a pilot programin two north-central counties at the request of local conservation officersto control expanding deer populations. Under this program,doe tags were purchased for $10 each at a rate of one per 50 acres.The landowner or club was required to show proof of ownership orhunting control. FMAP allowed the permittee to harvest antlerlessdeer in addition to the state bag limit. This program was acceptedand quickly spread statewide. Sportsmen realized they could properlyharvest does and still maintain a huntable population.Initially, a large number of permits were sold. However, liberalizationof antlerless opportunity has occurred throughout the state. Thishas decreased the need for permits in most areas to the point ofconsidering termination of the program. There were only 97 permitssold during the 2007-2008 hunting season.Continuation of the program is recommended because it providesan opportunity to harvest antlerless deer in excess of the season baglimit on specific areas that are in excess of the environmental carryingcapacity.362007-2008 Mississippi Deer Program Report
Deer TagsFigure 7: Buck Tags Issued and Used on WMAsFigure 8: Buck Tags Issued and Used on DMAP PropertiesDeer TagsFigure 9: Antlerless Deer Tags Issued on DMAP Properties2007-2008 Mississippi Deer Program Report37
Antler RegulationsAntler RegulationsThe 2007-2008 hunting season was the third season for Deer ManagementZone 2 in southeast Mississippi. This zone includesprivate and open public lands south of U.S. Hwy. 84 and east ofMS Hwy. 35. Within the zone, deer hunting opportunity is allowedOctober 15 through February 15. The objectives of Deer ManagementZone 2 are as follows:1) To protect adult does caring for late born fawns by openingthe season two weeks later (Oct. 15). This recommendationwas based on Deer Herd Health Evaluation Data, whichillustrates late January-early February breeding;2) To provide more hunting opportunity duringthe breeding period (Feb.1-15). This recommendationwas based on Deer Herd Health EvaluationData, which illustrates late January-early Februarybreeding; and3) To improve the age structure of adult bucksthrough more restrictive antler criteria. A legalbuck in Zone 2 is defined as having at least 4antler points AND a minimum inside spread of10 inches OR a minimum main beam lengthof 13 inches.Zone 1 includes areas north of U.S. Hwy. 84plus areas south of U.S. Hwy. 84 and west ofMS Hwy. 35. A legal buck in Zone 1 is definedas having at least 4 antler points.Inside spread antler criteria placed on manyWildlife Management Areas (WMAs) are in theirfourth year of existence. Antler criteria on manyWMAs were amended for the 2007-2008 huntingseason to include a minimum main beamlength while eliminating the 4 point restriction.Under the new WMA regulations, legal bucksmust meet either the minimum inside spread orthe minimum main beam length. Results fromstudies on the effects of the “four-point law”and apparent over-harvest of bucks on someWMAs support these regulation changes. Seethe Wildlife Management Area Harvest Informationfor the 2007-2008 Season (Table2) to determine which WMAs had insidespread and main beam criteria duringthe 2007-2008 season.Beginning in the 2003-2004season, buck tags were issuedto WMAs and DMAP propertiesallowing additional harvest ofsub-optimal bucks. For moreinformation on buck tags, seethe Deer Tags section of this reporton page 36.Figure 10382007-2008 Mississippi Deer Program Report
High-Fenced EnclosuresPhoto courtesy of MDWFPNew regulations for high-fenced enclosures containing white-taileddeer became effective July 1, 2008. The Commission on Wildlife,Fisheries, and Parks adopted Public Notice W1-3780 on November29, 2007. Public Notice W1-3780 implemented new permit requirementsand size restrictions for enclosures containing white-taileddeer. Following are highlights of the new regulations for white-taileddeer enclosures:• The owner must obtain an annual Facility Permit from the MD-WFP. The Facility Permit fee is $300.00 per year for high-fencedenclosures containing 300 acres or less. If the enclosure containsmore than 300 acres, the Facility Permit fee is $1.00 per enclosedacre. The permit will be valid from July 1 through June 30. Additionalcommercial enclosure fees may apply pursuant to Section 49-11-5,Mississippi Code of 1972.• All white-tailed deer enclosures constructed after December 31,2007, must contain a minimum of 300 contiguous acres of whichat least 50 percent of the total enclosed area must contain suitablehabitat for white-tailed deer and is not susceptible to flooding underordinary conditions.• An existing high-fenced enclosure containing less than 10 acres,confining white-tailed deer, and registered with the MDWFP prior toDecember 31, 2007, may be allowed. Reproduction of white-taileddeer within such an enclosure is prohibited. Any offspring producedshall be reported within five days of birth to the MDWFP and surrenderedto the MDWFP.2007-2008 Mississippi Deer Program Report• All permitted high-fenced enclosures containing white-tailed deershall be enrolled in the Enclosure Management Assistance Program.The owner of a permitted high-fenced enclosure must work with anMDWFP approved wildlife biologist to manage the white-tailed deerherd within the enclosure. The wildlife biologist must submit an annualmanagement plan by May 1 for the permitted high-fenced enclosureon forms provided by the MDWFP.• White-tailed deer may not be transported from the wild andplaced into a high-fenced enclosure.• All target white-tailed deer within a high-fenced enclosure mustbe tested for Chronic Wasting Disease. Target deer are deer exhibitingclinical symptoms of the disease.• As a condition of receiving a permit, high-fenced enclosure owners/operatorsare declared to have consented to periodic inspectionsof high-fenced enclosures by the MDWFP. All high-fenced enclosurescontaining white-tailed deer shall be inspected by the MDWFP at leastonce annually.The above regulations were passed to conserve and protect nativewildlife and to protect our recreational economy dependent on nativewildlife resources. Visit www.mdwfp.com/deer to read all of the newenclosure regulations.39High-Fenced Enclosures
Deer Management Assistance Program (DMAP)DMAPThrough a cooperative research program with MississippiState University in 1976, the MississippiDepartment of Wildlife, Fisheries and Parksgained information which provided biologistswith the ability to evaluate population densityrelative to carrying capacity, using conditionindicators rather than population estimates orbrowse surveys. This Cooperative Deer ManagementAssistance Program (DMAP) directlyinvolved hunters in management through thecollection of biological data. The interpretation ofthese data, in consultation with a biologist, is theguiding principle of DMAP. From a two-county pilotproject in its first year, DMAP grew steadily until participationpeaked in 1994 at almost 1,200 cooperators with over3.25 million acres under management.SPECIAL NOTE: Beginning with the 2001 data, theMDWFP began using a new computer summary program(XtraNet). This may be the cause for drastic differencesin some numbers. Once all of the historicdata is entered into the XtraNet system the numbersare expected to fall along the same trend,thus eliminating the drastic drop currently observedin the graphs and tables. Additionally,all DMAP summary tables and graphs nowinclude harvest reports from WMA’s thatcollect deer harvest data.Liberalized season structure and baglimits during the mid-1990’s allowed landmanagers the flexibility to meet harvestobjectives outside DMAP guidelines, whichresulted in a decline in DMAP participation(Figure 12). This decline reduced bothtotal acreage and number of cooperatorsin DMAP. Current enrollment includes 698cooperators with 2.29 million acres. The increasein clubs from last season can be attributedto the new organizational structureof the Wildlife Bureau with deer biologistsin areas of the state where there hasbeen a need in past, but no biologistand the addition of more non-MDW-FP DMAP consultants. Total DMAPharvest has mirrored the changesin cooperators and acreage inDMAP over the past few years(Figure 13).The ability to collect and analyzeDMAP data has been exceptional.Hundreds of thousands ofdeer are now part of the statewideDMAP database. In excess of 10,000deer have annually been available forcomparative purposes since 1983(Figure 13). Analysis of these dataover time captured the obvious trendsand subtle changes in deer herd conditionand structure. These trends and changes would have goneundocumented and possibly undetected without DMAP. Clubs andlandowners participating in DMAP may or may not be representativeof hunter goals and objectives on a statewide basis. Therefore, deerFigure 11: DMAP Cooperators by Countycondition and herd structure on DMAP lands maynot reflect herds on un-managed lands. However,a data source representing over 2 million acres iscredible and can be used to examine trend data.The extensive statewide coverage of DMAP atthe county level can be seen in Table 8.All DMAP data are evaluated based on soilregion. These data are presented in Tables 12-22. These summaries allow individual DMAPcooperators to compare their data to soil regionaverages. In these tables are two sets of averagesas well. The first is an average from 1991-1994 and thesecond is of the last five years (2003-2007). The 1991-1994average is the four years prior tothe 4-point law. Significant differencesare obvious when comparingthese averages.A significant trend in DMAPdata is obvious. The average ageof all harvested bucks has increasedfrom 2.1 years old in 1991to 3.0 years old in 2007 (Figure15). In addition, these older ageclass bucks are being producedand harvested on a declining acreagebase (Figure 16). One possiblereason for the drop in acres per 3½year old bucks over the last coupleof seasons is the more liberalizeduse of management buck tags whichallowed DMAP properties to harvestsub-optimal adult bucks. In addition,the average spread, number ofpoints, beam length, and circumferenceon all harvested bucks has increasedproportionally.The percentage of harvested bucksin the older age classes (4½+) has increasedas well (Figure 17). This increaseis the result of a shift in buckselection by hunters from younger ageclass bucks (1½ year olds) to olderanimals. Notice in the same graph, thecorresponding decline in the percentageof younger age class bucks, whichoccur in the annual harvest. These arevery evident when comparing the past10 years to the 1991-1994 average.Statewide condition data are presentedin Table 11. This table presentstrend data on various antlerparameters such as spread, length,circumference, and points. Otherinformation, such as weight and lactationdata are also provided in thistable.Soil region condition data are presented in Tables 12-22. Thesetables also present trend data on various antler parameters such asspread, length, circumference, and points. Other information, suchas weight and lactation data are provided in these tables as well.402007-2008 Mississippi Deer Program Report
Mississippi DMAP DataFigure 12: DMAP Acreage & CooperatorsFigure 13: DMAP Deer HarvestDMAPFigure 14: Acres/Deer HarvestedFigure 15: Average Age All BucksFigure 16: Acres/3.5+ BucksFigure 17: Percent Bucks by Age ClassAcres91-942007-2008 Mississippi Deer Program Report41
Table 8. DMAP Participation and Harvest by CountyDuring the 2007-2008 SeasonDMAPHarvestHarvestCountyCooperatorsAcresBucksDoesTotalAdams 22 74,988 379 572 951Alcorn 1 26,000 5 1 6Amite 7 27,679 150 206 356Attala 12 41,064 187 273 460BentonBolivar 7 41,824 263 369 632Calhoun 2 11,688 48 33 81Carroll 19 52,454 363 511 874Chickasaw 2 29,500 34 37 71Choctaw 5 31,800 72 103 175Claiborne 54 95,365 739 1,226 1,965Clarke 5 19,600 47 123 146Clay 12 30,243 104 113 217Coahoma 9 44,750 242 340 582Copiah 10 28,678 130 341 471CovingtonDesoto 1 5,000 14 7 21Franklin 2 3,700 30 24 54George 2 18,750 9 8 17Greene 4 10,652 25 29 54Grenada 5 15,000 48 103 151Hancock 1 5,880 7 8 15Harrison 1 1,400 1 3 4Hinds 22 45,688 343 590 933Holmes 17 30,226 168 305 473Humphries 4 9,800 24 75 99Issaquena 49 111,362 754 1,104 1,858Itawamba 5 61,848 211 122 333Jackson 4 24,510 47 32 79Jasper 9 43,478 106 200 306Jefferson 23 55,419 305 626 931Jeff DavisJones 1 35,000 21 13 34Kemper 11 35,492 232 292 524Lafayette 10 62.658 163 233 396Lamar 5 14,374 29 23 52Lauderdale 5 20,222 47 82 129Lawrence 4 13,501 52 102 154Leake 4 11,730 61 93 154LeeLeflore 10 13,187 65 173 238CountyLincolnLowndesMadisonMarionMarshallMonroeMontgomeryNeshobaNewtonNoxubeeOktibbehaPanolaPearl RiverPerryPikePontotocPrentissQuitmanRankinScottSharkeySimpsonSmithStoneSunflowerTallahatchieTateTippahTishomingoTunicaUnionWalthallWarrenWashingtonWayneWebsterWilkinsonWinstonYalobushaYazooTOTALCooperatorsAcresBucksDoesTotal1 3,642 18 21 3910 24,248 76 151 22719 45,216 241 671 9125 30,695 159 159 3182 5,200 18 68 8621 61,777 219 343 56218 30,404 213 351 5641 7,655 16 45 614 9,198 55 71 12617 54,900 283 406 6894 12,494 34 76 1109 19,312 115 228 3437 40,245 88 63 1512 41,778 52 35 871 6,000 8 8 162 12,214 37 75 11210 28,986 125 169 2947 42,410 107 136 2434 67,464 79 118 1973 14,000 51 78 1292 9,267 43 43 864 93,292 18 13 311 1,585 3 4 73 4,795 11 39 504 17,213 51 103 1546 21,847 101 143 2445 29,204 59 176 2357 23,444 75 84 1591 5,325 28 30 5892 150,819 1,243 1,684 2,92710 34,934 257 388 6451 11,500 7 1 82 7,610 41 42 8312 35,365 247 357 6046 16,700 89 106 1951 4,872 23 57 8028 63,815 425 599 1,024698 2,293,935 10,246 15,636 25,882422007-2008 Mississippi Deer Program Report
Mississippi DMAP DataTable 9. Harvest Summary of Bucks by Age ClassSeason19931994*1995*1996199719981999+2000 +2001200220032004200520062007Sample0.5 Bucks 1.5 Bucks 2.5 Bucks 3.5 Bucks 4.5+ Bucks Avg. Age Total Acres/# % # % # % # % # % All Bucks 3.5+ Bucks 3.5+ Bucks18,585 1,301 7 8,527 46 5,488 30 2,489 13 852 5 2.1 3,341 74019,128 1,530 8 7,063 37 6,529 34 3,020 16 1,045 5 2.2 4,065 68514,650 1,172 8 3,391 23 5,503 38 3,367 23 1,187 8 2.5 4,554 56016,350 1,308 8 3,246 20 6,489 40 3,601 22 1,697 10 2.3 5,298 50014,405 1,296 9 2,737 19 5,474 38 3,601 25 1,585 11 2.4 5,186 45613,278 1,062 8 2,257 17 4,913 37 3,452 26 1,859 14 2.5 5,311 41012,336 864 7 1,727 14 4,441 36 3,577 29 1,850 15 2.5 5,428 39311,329 680 6 1,586 14 3,965 35 3,285 29 1,813 16 2.6 5,098 37910,639 426 4 1,277 12 3,511 33 3,192 30 2,021 19 2.7 5,213 45711,258 450 4 1,351 12 3,377 30 3,490 31 2,477 22 2.8 5,967 43410,737 433 4 1,546 14 2,974 28 3,328 31 2,512 23 2.8 5,841 45510,100 440 4 1,121 11 2,828 28 3,363 33 2,424 24 2.9 5,787 4639,719 428 4 1,127 12 2,196 23 3,343 34 2,634 27 3.0 5,977 40210,246 366 4 1,445 14 2,059 20 3,156 31 3,135 31 3.0 6,291 38010,026 348 3 1,464 15 2,136 21 2,978 30 3,048 30 3.0 6,026 385DMAPMississippi DMAP DataTable 10. Harvest Summary of Antlerless Deer by Age ClassSeason19931994*1995*1996199719981999+2000 +2001200220032004200520062007Sample0.5 Bucks 0.5 Does 1.5 Does 2.5 Does 3.5+ Does Avg. Age# % # % # % # % # % All Does20,481 1,218 6 1,827 9 4,756 23 4,352 21 8,328 41 2.423,330 1,470 6 2,339 10 4,769 20 5,353 23 9,399 40 2.525,997 1,187 5 2,691 10 5,903 23 5,599 22 10,619 41 2.423,410 1,171 5 2,341 10 5,150 22 5,150 22 9,598 41 2.521,763 1,088 5 2,176 10 4,788 22 4,570 21 9,140 42 2.517,601 704 4 1,584 9 3,872 22 3,696 21 7,744 44 2.616,288 652 4 1,466 9 3,420 21 3,746 23 7,004 43 2.615,228 457 3 1,066 7 3,350 22 3,350 22 7,005 46 2.713,451 390 3 713 5 3,040 23 3,242 24 5,959 44 2.714,305 386 3 916 6 3,018 21 3,448 24 6,723 47 2.715,145 363 2 924 6 3,423 23 3,332 22 7,058 47 2.814,894 343 2 998 7 3,172 21 3,277 22 6,777 46 2.713,618 409 3 953 7 2,642 19 2,996 22 6,686 49 2.815,636 422 3 1,048 7 3,033 19 3,440 22 8,021 51 2.914,252 385 3 955 7 3,278 23 3,135 22 6,485 46 3.2*1995* Four points or better’ law initiated and bag limit changed from 5 bucks and 3 antlerless to 3 bucks and 5 antlerless with DMAPand FMAP participants exempt from the annual bag limit; 2 additional antlerless deer may be taken with achery equipment.+2000+ Bag limit changed to 3 bucks and 3 antlerless with DMAP and FMAP participants exempt from the annual bag limit; 2 additionalantlerless deer may be taken with archery equipment. Four points or better’ law remain in effect.2007-2008 Mississippi Deer Program Report43
Table 11. Statewide Compiled DMAP DataStatewide DMAPAcresTotal DeerBucksDoesAcres/DeerBucksDoesAvg Age ALL BucksAvg Points ALL BucksAvg Length ALL BucksAvg Spread ALL BucksAcres/3.5+Bucks% 0.5 Yr BucksWeight*% 1.5 YrWeight*PointsCircumf.LengthSpread% 2.5 YrWeight*PointsCircumf.LengthSpread% 3.5 YrWeight*PointsCircumf.LengthSpread% 4.5+ YrWeight*PointsCircumf.LengthSpread# 4.5 YrWeight*PointsCircumf.LengthSpreadSeasonAverage07 06 05 04 03 02 01 00+ 99 98 91-94 03-072,290,502 2,293,935 2,392,181 2,518,344 2,532,160 2,430,506 2,297,401 2,602,586 2,662,032 2,748,231 3,105,186 2,405,42424,278 25,882 23,337 24,994 25,882 25,451 24,090 26,557 28,624 30,879 39,138 24,87510,026 10,246 9,719 10,100 10,737 11,191 10,639 11,329 12,336 13,278 19,562 10,16614,252 15,636 13,618 14,894 15,145 14,260 13,451 15,228 16,288 17,601 19,576 14,70994 89 103 101 98 95 95 98 93 89 79.5 97228 224 246 249 236 217 216 230 216 207 159 237161 147 176 169 167 170 171 171 163 156 160 1643.0 3.0 3.0 2.9 2.8 2.8 2.7 3.0 2.9 2.9 2.2 2.77.1 7.1 7.2 7.2 7.1 7.3 7.2 6.7 6.6 6.3 4.8 7.016.4 16.5 16.6 16.4 16.0 16.0 15.7 14.6 14.2 13.5 10.4 15.613.5 13.5 13.5 13.4 13.0 13.0 12.8 11.9 11.6 11.0 8.7 12.7385 380 402 463 455 431 457 379 393 410 808 4164 4 4 4 3 3 4 5 6 6 8 467 66 74 66 71 75 66 64 63 64 63 6515 14 12 11 14 12 12 14 16 17 44 13113 115 115 112 111 118 115 116 118 115 115 1152.7 3.1 3.1 3.4 3.6 4.5 4.1 4.4 4.5 4.1 3.2 3.92.0 2.2 2.3 2.3 2.3 2.5 2.4 2.5 2.5 2.4 2.2 2.45.5 6.8 6.7 7.2 7.4 9.0 8.3 8.4 8.7 8.2 6.8 7.95.7 6.3 6.4 6.7 6.6 7.5 7.3 7.4 7.4 7.2 6.0 6.921 20 23 28 28 30 34 35 36 36 31 24148 148 149 149 148 150 145 147 149 146 148 1486.9 6.9 6.8 6.8 6.8 7.0 6.9 6.9 7.0 6.8 6.6 6.93.5 3.4 3.5 3.4 3.4 3.5 3.3 3.4 3.4 3.4 3.3 3.414.8 14.7 14.6 14.5 14.4 14.7 14.3 14.4 14.5 14.1 14.0 14.412.0 12.0 11.9 12.0 11.7 11.9 11.6 11.7 11.9 11.5 11.4 11.830 31 34 33 31 31 30 30 28 26 14 32169 169 170 169 172 169 166 168 170 165 163 1697.8 7.8 7.7 7.7 7.8 7.8 7.8 7.9 7.9 7.8 7.5 7.84.0 4.0 4.0 4.0 4.0 4.0 3.9 4.0 4.0 3.9 3.9 4.017.6 17.6 17.5 17.3 17.6 17.2 17.1 17.4 17.4 16.9 16.7 17.414.2 14.2 14.2 14.0 14.1 13.9 13.8 14.1 14.2 13.6 13.5 14.030 31 27 24 23 22 19 16 14 14 5 27184 185 185 185 186 184 182 182 183 178 173 1838.4 8.3 8.4 8.3 8.3 8.3 8.3 8.3 8.5 8.3 8.1 8.34.5 4.5 4.5 4.5 4.5 4.5 4.4 4.5 4.5 4.4 4.3 4.519.9 19.7 19.7 19.7 19.7 19.5 19.4 19.6 19.4 19.0 18.6 19.615.9 15.8 15.7 15.7 15.6 15.5 15.4 15.6 15.5 15.0 14.9 15.61795 1677 1611 1462 1511 1484 1250 1257 1183 1082 589 1611182 183 182 183 184 182 179 181 182 176 173 1818.3 8.2 8.3 8.2 8.2 8.3 8.2 8.3 8.4 8.2 8.1 8.34.4 4.4 4.4 4.4 4.4 4.4 4.3 4.4 4.4 4.3 4.2 4.419.6 19.3 19.2 19.4 19.4 19.2 18.9 19.4 19.1 18.7 18.6 19.215.6 15.5 15.4 15.6 15.4 15.3 15.1 15.5 15.4 14.8 14.8 15.3* ALL weights are live weights00+ Year bag limit changed (3-5 to 3-3, bucks-antlerless) continue minimum 4 points or more442007-2008 Mississippi Deer Program Report
Table 11. Continued# 5.5 YrWeight*PointsCircumf.LengthSpread# 6.5 YrWeight*PointsCircumf.LengthSpread# 7.5 YrWeight*PointsCircumf.LengthSpread# 8.5+ YrWeight*PointsCircumf.LengthSpreadDoe Age Classes%0.5 Yr% 1.5 Yr% 2.5 Yr% 3.5+ YrDoe Weights*Weight 0.5 YrWeight 1.5 YrWeight 2.5 YrWeight 3.5+ Yr% Doe Lactation1.5 Yr2.5 Yr2.5+ Yr3.5+ YrAll Antlerless H’vst% 0.5 Yr Bk Fawns% 0.5 Yr Doe Fawns%1.5 Yr Does% 2.5 Yr Does% 3.5+ Yr DoesSeasonAverage07 06 05 04 03 02 01 00+ 99 98 91-94 03-07722 840 651 531 576 579 467 395 372 339 151 664185 186 189 189 190 186 185 186 185 181 174 1868.5 8.4 8.4 8.6 8.4 8.5 8.5 8.4 8.6 8.5 7.9 8.54.6 4.6 4.6 4.6 4.6 4.6 4.5 4.6 4.6 4.5 4.4 4.620.1 19.9 20.4 20.2 20.2 20.0 20.1 19.9 20.1 19.6 18.9 20.116.0 15.9 16.1 16.0 16.0 15.9 15.9 15.9 15.8 15.4 15.1 15.9348 330 236 194 202 146 159 125 112 118 44 262188 191 192 192 191 191 187 186 187 182 176 1898.5 8.3 8.5 8.2 8.4 8.4 8.3 8.6 8.5 8.7 8.3 8.44.7 4.7 4.7 4.7 4.7 4.6 4.7 4.7 4.7 4.6 4.5 4.720.7 21.0 20.8 20.4 20.5 20.6 20.6 20.4 19.9 20.1 19.4 20.516.4 16.4 16.4 16.1 15.9 16.4 16.3 16.1 16.0 15.7 15.2 16.282 99 78 65 71 45 63 39 48 35 18 79190 192 192 189 190 192 183 187 189 185 168 1888.6 8.6 8.3 8.7 8.3 8.6 9.0 8.1 8.6 8.5 7.4 8.54.8 4.7 4.7 4.7 4.8 4.7 4.7 4.8 4.9 4.3 4.4 4.721.3 21.0 20.6 20.8 20.5 20.2 20.0 20.6 19.8 20.2 18.3 20.516.6 16.3 16.0 16.6 16.6 15.3 15.8 16.2 15.8 15.8 15.0 16.163 60 46 27 36 44 36 29 23 13 11 46189 185 195 183 186 180 190 183 179 191 171 1858.3 7.6 7.8 8.0 8.1 8.0 8.4 7.4 9.1 10.5 7.5 8.24.8 4.5 4.4 4.5 4.7 4.6 4.7 4.5 4.5 5.3 4.3 4.620.9 20.7 19.8 18.6 19.3 20.1 19.5 19.6 20.4 21.5 18.5 20.016.7 16.2 15.5 15.0 15.2 15.7 15.2 16.5 16.4 16.8 14.4 15.97 7 7 7 6 6 5 7 10 10 13 724 20 20 22 23 21 23 23 22 23 59 2223 20 22 25 23 23 25 23 24 22 66 2347 53 51 47 48 47 45 47 45 45 70 4967 65 66 64 67 66 64 63 62 63 11 6398 98 98 96 96 99 97 96 96 95 23 97111 109 111 109 108 110 108 107 108 107 24 109117 116 117 115 116 116 117 114 115 113 42 11511 11 13 11 10 12 10 12 13 12 60 1160 59 57 56 56 58 58 61 64 59 96 5868 68 66 63 64 65 66 68 71 68 108 6772 71 70 67 68 69 70 72 75 73 115 713 3 3 2 2 3 3 3 4 4 7 37 7 7 7 6 6 5 7 9 9 10 723 19 19 21 23 21 23 22 21 22 22 2122 22 22 22 22 20 24 22 23 21 22 2246 51 49 46 47 47 44 46 43 44 39 48Statewide DMAP* ALL weights are live weights00+ Year bag limit changed (3-5 to 3-3, bucks-antlerless) continue minimum 4 points or more2007-2008 Mississippi Deer Program Report45
Mississippi Soil Resource AreasFigure 19Soil ResourcesDescription462007-2008 Mississippi Deer Program Report
Table 12. Batture Soil Resource AreaSummary of DMAP DataAcresTotal DeerBucksDoesAcres/DeerBucks3.5+ BucksDoesAvg Age ALL Bucks% 0.5 Yr BucksWeight*% 1.5 YrWeight*PointsCircumf.LengthSpread% 2.5 YrWeight*PointsCircumf.LengthSpread% 3.5 YrWeight*PointsCircumf.LengthSpread% 4.5+ YrWeight*PointsCircumf.LengthSpread% Doe Lactation1.5 Yr2.5 Yr3.5+ YrDoe Age Classes% 0.5 Yr% 1.5 Yr% 2.5 Yr% 3.5+ YrDoe Weights*0.5 Yr1.5 Yr2.5 Yr3.5+ YrSeasonAverage07 06 05 04 03 02 01 00+ 99 98 91-94 03-07243,537 244,927 250,094 239,098 233,379 236,582 207,187 178,239 171,795 173,182 172,527 242,2074,629 4,490 4,409 4,186 4,624 4,711 4,073 3,191 2,950 2,933 2,906 4,4681,904 1,820 1,788 1,605 1,902 1,935 1,530 1,300 1,308 1,444 1,449 1,8042,725 2,670 2,621 2,581 2,722 2,776 2,543 1,891 1,642 1,489 1,457 2,66453 55 57 57 50 50 51 56 58 59 60 108128 135 140 149 123 122 135 137 131 120 119 135156 165 180 207 170 191 215 232 239 240 693 17689 92 95 93 86 85 81 94 105 116 120 913.6 3.6 3.5 3.4 3.3 3.2 3.1 3.3 3.2 3.1 2.4 3.53 4 3 3 4 3 4 7 5 5 6 3.368 69 67 72 84 77 65 70 70 74 73 71.97 6 6 5 5 5 9 7 6 9 28 6124 124 115 116 112 119 115 130 129 127 134 1182.6 2.5 2.2 2.4 2.6 3.1 2.9 4.4 4.4 4.0 3.9 2.52.1 2.3 2.2 2.4 2.0 2.4 2.4 2.9 2.8 2.5 2.4 2.26.3 6.7 5.1 5.7 5.8 6.0 6.8 9.2 9.5 8.6 8.2 5.96.6 6.1 5.4 6.0 6.0 6.3 7.1 8.7 8.6 7.9 7.1 6.013 12 15 16 15 21 24 27 34 36 49 14169 165 160 165 166 166 164 168 167 165 169 1657.3 7.4 7.3 7.4 7.8 7.7 7.7 7.7 7.8 7.6 7.5 7.43.7 3.7 3.6 3.7 3.7 3.7 3.7 3.7 3.7 3.6 3.5 3.717.0 16.9 16.3 16.9 16.8 16.5 16.4 16.7 16.8 16.2 15.5 16.814.0 13.8 13.3 13.7 13.8 13.6 13.4 13.7 13.7 13.4 13.0 13.731 33 35 35 40 38 36 35 36 32 14 35188 183 184 185 187 184 183 188 189 185 187 1868.1 8.0 8.1 8.2 8.3 8.3 8.3 8.5 8.5 8.4 8.2 8.14.2 4.3 4.3 4.3 4.3 4.2 4.2 4.3 4.3 4.3 4.2 4.319.4 19.3 19.6 19.5 19.5 19.0 19.0 19.9 19.9 19.3 18.7 19.515.7 15.5 15.7 15.8 15.6 15.3 15.4 16.2 16.1 15.5 15.4 15.646 44 41 42 36 32 27 24 19 18 4 42197 193 192 193 195 194 192 202 197 193 198 1948.5 8.2 8.4 8.4 8.5 8.5 8.4 8.5 8.6 8.7 8.5 8.44.7 4.6 4.6 4.6 4.6 4.6 4.6 4.7 4.7 4.6 4.6 4.621.3 20.8 21.1 20.9 20.8 20.5 20.7 21.4 20.9 21.0 20.8 21.017.0 16.6 16.6 16.7 16.6 16.4 16.4 17.1 17.0 16.8 16.8 16.710 10 6 6 11 9 8 10 11 10 14 971 64 51 58 55 60 57 63 70 51 58 6078 77 67 69 65 71 65 77 75 63 68 718 7 6 6 8 7 6 9 11 10 11 728 20 19 22 18 21 24 24 18 19 20 2124 24 27 25 27 25 30 25 28 27 30 2541 50 48 47 47 47 40 42 43 44 39 4772 68 68 66 68 68 64 67 68 67 68 68104 104 98 98 101 101 98 104 106 101 108 101116 114 114 112 112 114 114 115 114 115 121 114123 121 121 119 122 121 121 123 124 122 126 121* ALL weights are live weights00+ Year bag limit changed (3-5 to 3-3, bucks-antlerless) continue minimum 4 points or moreSoil Resources2007-2008 Mississippi Deer Program Report47
Table 13. Delta Soil Resource AreaSummary of DMAP DataSoil ResourcesAcresTotal DeerBucksDoesAcres/DeerBucks3.5+ BucksDoesAvg Age ALL Bucks% 0.5 Yr BucksWeight*% 1.5 YrWeight*PointsCircumf.LengthSpread% 2.5 YrWeight*PointsCircumf.LengthSpread% 3.5 YrWeight*PointsCircumf.LengthSpread% 4.5+ YrWeight*PointsCircumf.LengthSpread% Doe Lactation1.5 Yr2.5 Yr3.5+ YrDoe Age Classes% 0.5 Yr% 1.5 Yr% 2.5 Yr% 3.5+ YrDoe Weights*0.5 Yr1.5 Yr2.5 Yr3.5+ YrSeasonAverage07 06 05 04 03 02 01 00+ 99 98 91-94 02-06276,212 300,107 304,838 317,354 289,297 283,851 240,653 178,239 269,772 256,237 254,153 297,5622,647 2,968 2,808 2,900 3,016 2,938 2,652 3,476 3,503 3,393 3,909 2,8681,068 1,148 1,190 1,166 1,226 1,343 1,096 1,360 1,469 1,467 1,830 1,1601,579 1,820 1,618 1,734 1,790 1,595 1,556 2,116 2,034 1,926 1,457 1,708104 101 109 109 96 97 91 84 77 76 66 208259 261 256 272 236 211 220 215 184 175 140 257426 408 341 450 399 407 432 243 375 416 962 405175 165 188 183 162 178 155 138 133 133 124 1742.9 3.1 3.2 3.2 3.1 3.0 2.9 3.1 3.0 2.9 2.1 3.14 6 3 3 4 3 5 5 5 5 8 3.975 74 76 73 69 75 67 69 73 65 70 73.520 18 8 5 8 5 8 9 12 13 41 12126 125 124 127 124 133 120 134 135 131 134 1252.4 2.3 2.4 3.4 3.3 4.2 3.8 4.1 5.0 4.2 3.5 2.82.0 2.1 2.2 2.4 2.3 2.6 2.3 2.4 2.7 2.5 2.4 2.25.0 5.0 5.3 7.1 7.7 8.9 6.5 8.1 9.2 8.8 7.3 6.05.0 4.9 5.5 7.0 7.0 8.3 7.8 7.8 7.9 7.6 6.4 5.917 13 17 24 22 28 28 32 34 40 36 19170 171 170 174 175 170 164 167 168 167 169 1727.5 7.3 7.3 7.5 7.6 7.3 7.4 7.4 7.8 7.5 7.3 7.43.7 3.7 3.7 3.8 3.8 3.6 3.4 3.5 3.6 3.6 3.5 3.716.8 16.5 16.5 16.9 16.5 15.8 15.6 15.6 15.8 15.3 15.1 16.614.0 13.9 13.6 14.2 13.6 13.0 12.9 13.1 13.2 13.0 12.8 13.927 30 38 35 36 37 33 36 33 28 12 33192 189 189 190 191 187 183 191 191 187 187 1908.1 8.4 8.1 8.3 8.1 7.9 8.1 8.2 8.2 8.3 8.1 8.24.3 4.3 4.2 4.3 4.2 4.0 4.0 4.2 4.2 4.1 4.1 4.319.5 19.3 19.1 19.0 18.9 18.2 18.4 19.0 18.6 18.4 18.0 19.115.9 15.9 15.5 15.7 15.2 14.8 14.8 15.6 15.5 15.2 14.9 15.633 34 35 32 30 26 25 18 16 14 4 33204 199 199 197 200 196 198 204 202 200 197 2008.4 8.6 8.6 8.6 8.4 8.3 8.4 8.5 8.8 8.4 8.4 8.54.6 4.5 4.7 4.6 4.6 4.5 4.4 4.6 4.6 4.4 4.4 4.620.9 20.6 20.7 20.9 20.3 20.0 20.2 21.0 20.8 20.2 19.5 20.717.0 16.6 16.6 16.7 16.0 16.2 16.0 17.0 16.6 16.1 15.8 16.613 16 16 12 10 12 13 20 18 14 16 1364 61 60 58 58 59 57 68 70 59 58 6071 71 68 67 68 69 68 76 78 70 71 696 9 8 9 7 7 6 8 10 9 12 823 21 19 21 24 21 23 22 20 22 21 2226 20 24 27 24 26 25 23 23 25 27 2445 50 48 43 45 46 45 47 47 44 41 4671 69 69 67 72 73 70 70 69 67 66 70107 108 105 103 105 106 103 107 107 103 109 106119 119 118 117 119 119 116 117 117 116 121 119129 126 125 124 127 126 124 124 123 121 129 126* ALL weights are live weights00+ Year bag limit changed (3-5 to 3-3, bucks-antlerless) continue minimum 4 points or more482007-2008 Mississippi Deer Program Report
Table 14. Upper Thick Loess Soil Resource AreaSummary of DMAP DataAcresTotal DeerBucksDoesAcres/DeerBucks3.5+ BucksDoesAvg Age ALL Bucks% 0.5 Yr BucksWeight*% 1.5 YrWeight*PointsCircumf.LengthSpread% 2.5 YrWeight*PointsCircumf.LengthSpread% 3.5 YrWeight*PointsCircumf.LengthSpread% 4.5+ YrWeight*PointsCircumf.LengthSpread% Doe Lactation1.5 Yr2.5 Yr3.5+ YrDoe Age Classes% 0.5 Yr% 1.5 Yr% 2.5 Yr% 3.5+ YrDoe Weights*0.5 Yr1.5 Yr2.5 Yr3.5+ YrSeasonAverage07 06 05 04 03 02 01 00+ 99 98 91-94 03-07257,833 291,625 284,330 254,675 256,586 242,703 236,886 196,733 234,944 245,798 210,775 269,0104,335 5,318 4,594 4,129 4,036 3,595 3,680 2,909 3,722 3,596 2,732 4,4821,646 1,969 1,784 1,554 1,477 1,416 1,404 1,142 1,509 1,466 1,443 1,6862,689 3,349 2,810 2,575 2,559 2,179 2,276 1,767 2,213 2,130 1,457 2,79659 55 62 62 64 68 64 68 63 68 78 60157 148 159 164 174 171 169 172 155 168 146 160284 263 286 289 297 316 344 392 399 493 1179 28496 87 101 99 100 111 104 111 106 115 169 962.8 2.9 2.8 2.8 2.9 2.9 2.8 2.9 3.2 3.1 2.4 2.96 6 6 4 5 5 6 6 8 9 7 5.466 67 68 69 74 69 70 69 69 68 72 68.821 18 16 15 12 10 11 12 17 17 53 16115 119 118 114 112 124 120 121 128 129 132 1162.3 2.9 2.5 2.6 2.8 4.4 3.6 4.2 4.4 4.4 3.9 2.62.0 2.2 2.1 2.0 2.2 2.5 2.3 2.6 2.6 2.6 2.5 2.14.5 6.4 5.7 5.7 5.9 8.5 7.5 8.2 8.8 8.6 8.1 5.74.9 5.8 5.5 5.4 5.9 7.4 7.3 7.6 7.7 7.7 6.9 5.517 19 23 25 23 30 32 38 36 40 28 21152 155 156 154 154 160 154 156 161 160 163 1547.0 7.0 7.0 7.0 7.2 7.3 7.3 7.2 7.3 7.1 7.0 7.03.5 3.6 3.6 3.5 3.5 3.7 3.5 3.5 3.6 3.5 3.5 3.514.9 15.1 15.1 14.7 15.0 15.2 14.8 14.8 15.1 14.7 14.9 15.012.4 12.4 12.4 12.4 12.6 12.5 12.2 12.2 12.6 12.3 12.5 12.428 28 33 33 34 33 31 31 28 27 11 31175 176 178 175 178 176 173 179 186 185 190 1777.9 7.9 7.9 7.8 8.0 8.0 7.9 8.2 8.3 8.1 8.1 7.94.1 4.2 4.3 4.1 4.2 4.1 4.0 4.1 4.3 4.3 4.3 4.117.9 18.2 18.1 17.9 18.1 17.6 17.4 17.9 18.2 18.6 18.6 18.014.6 14.7 14.7 14.3 14.7 14.4 14.2 14.5 14.9 15.0 15.3 14.628 29 22 23 26 22 20 13 11 7 2 26189 189 191 189 192 193 189 193 201 200 211 1908.3 8.3 8.5 8.2 8.2 8.3 8.3 8.6 8.8 8.6 8.6 8.34.6 4.7 4.7 4.6 4.6 4.7 4.5 4.6 4.8 4.7 5.0 4.620.0 20.1 19.9 19.8 19.9 19.8 19.6 20.3 20.4 20.5 21.1 19.915.9 16.0 16.0 15.9 15.8 16.0 15.8 16.1 16.3 16.2 17.1 15.910 12 13 11 10 13 8 11 13 13 12 1156 58 59 56 54 66 61 64 64 61 60 5774 71 73 68 66 70 70 72 77 70 66 706 6 7 7 7 7 6 6 10 11 12 723 19 19 20 22 20 21 24 22 23 23 2122 21 22 23 20 22 22 22 25 23 25 2249 54 52 50 51 51 51 48 43 43 41 5169 65 65 65 67 65 66 64 66 69 66 66102 101 102 100 99 106 103 103 104 104 107 101115 113 115 113 113 115 114 115 117 116 120 114122 120 122 120 121 122 123 122 125 124 128 121* ALL weights are live weights00+ Year bag limit changed (3-5 to 3-3, bucks-antlerless) continue minimum 4 points or moreSoil Resources2007-2008 Mississippi Deer Program Report49
Table 15. Lower Thick Loess Soil Resource AreaSummary of DMAP DataSoil ResourcesAcresTotal DeerBucksDoesAcres/DeerBucks3.5+ BucksDoesAvg Age ALL Bucks% 0.5 Yr BucksWeight*% 1.5 YrWeight*PointsCircumf.LengthSpread% 2.5 YrWeight*PointsCircumf.LengthSpread% 3.5 YrWeight*PointsCircumf.LengthSpread% 4.5+ YrWeight*PointsCircumf.LengthSpread% Doe Lactation1.5 Yr2.5 Yr3.5+ YrDoe Age Classes% 0.5 Yr% 1.5 Yr% 2.5 Yr% 3.5+ YrDoe Weights*0.5 Yr1.5 Yr2.5 Yr3.5+ YrSeasonAverage07 06 05 04 03 02 01 00+ 99 98 91-94 03-07145,152 149,025 144,886 147,216 160,276 153,658 148,830 166,906 193,570 211,427 233,912 149,3112,619 2,779 2,406 2,651 2,914 2,864 2,721 3,022 3,515 4,299 6,077 2,6741,012 1,045 1,064 1,111 1,125 1,218 1,239 1,252 1,407 1,871 2,776 1,0711,607 1,734 1,342 1,540 1,789 1,646 1,482 1,730 2,108 2,458 1,457 1,60255 54 60 56 55 54 55 55 55 50 39 56143 143 136 133 142 126 120 129 138 116 84 139230 231 232 205 254 218 244 284 313 276 417 23090 86 108 96 90 93 100 96 92 87 73 933.1 3.3 3.2 3.1 3.0 3.0 2.8 3.0 3.2 3.1 2.4 3.14 4 6 3 2 3 3 5 7 5 7 3.562 61 109 63 64 67 70 66 61 67 63 71.711 9 9 9 10 9 12 14 14 15 34 10107 113 111 107 112 121 113 111 119 113 117 1102.6 2.7 3.1 3.1 3.5 4.4 3.6 3.6 3.8 3.3 3.1 3.02.0 2.2 2.1 2.2 2.4 2.6 2.4 2.2 2.4 2.3 2.2 2.24.2 7.1 5.9 6.5 7.3 9.1 7.7 6.0 7.0 6.4 6.5 6.25.4 6.7 6.1 6.2 6.8 7.8 7.1 6.3 6.7 6.5 6.0 6.221 19 19 23 31 27 30 34 35 39 38 23147 147 148 145 152 149 148 150 149 146 151 1487.1 7.0 7.2 6.8 7.2 7.1 7.1 7.1 7.0 6.8 6.9 7.03.6 3.5 3.5 3.3 3.5 3.5 3.4 3.4 3.5 3.4 3.4 3.514.8 14.4 14.8 14.0 14.5 14.6 14.1 14.3 14.2 13.8 14.3 14.512.2 11.6 12.0 11.8 11.9 11.9 11.2 11.6 11.6 11.2 11.8 11.931 29 35 35 27 30 29 27 26 23 16 31164 165 165 166 169 168 164 170 168 166 169 1667.8 7.7 7.7 7.8 7.9 8.0 7.7 8.0 7.9 7.7 7.9 7.84.3 4.1 4.0 3.9 4.0 4.1 4.0 4.0 4.0 3.9 4.0 4.117.5 17.3 17.3 17.2 17.3 17.1 16.8 17.3 17.2 16.8 17.1 17.313.9 14.0 14.0 13.6 13.8 13.7 13.6 14.0 13.7 13.5 13.8 13.933 39 32 30 31 28 23 20 18 18 5 33178 182 182 183 185 184 183 184 186 181 182 1828.5 8.5 8.8 8.5 8.5 8.7 8.4 8.6 8.5 8.6 8.4 8.54.5 4.5 4.6 4.4 4.6 4.7 4.5 4.6 4.5 4.5 4.5 4.519.6 19.5 19.3 19.3 20.0 19.6 19.2 19.9 19.5 19.4 19.5 19.515.4 15.4 15.2 15.3 15.4 15.5 15.4 15.6 15.5 15.1 15.4 15.49 8 10 7 6 12 10 8 11 7 9 859 54 61 50 59 65 58 62 62 53 60 5773 74 76 65 73 75 74 72 78 71 72 726 6 8 7 5 4 4 7 9 9 10 624 21 20 24 26 22 23 24 21 25 24 2322 19 21 22 20 19 21 23 19 21 25 2148 55 51 47 50 51 48 48 51 45 42 5063 64 67 61 64 67 66 63 61 64 60 6493 98 97 94 96 101 98 96 96 96 97 96109 110 110 110 111 110 111 112 110 109 111 110113 117 118 116 117 116 117 117 116 117 118 116* ALL weights are live weights00+ Year bag limit changed (3-5 to 3-3, bucks-antlerless) continue minimum 4 points or more502007-2008 Mississippi Deer Program Report
Table 16. Upper Thin Loess Soil Resource AreaSummary of DMAP DataAcresTotal DeerBucksDoesAcres/DeerBucks3.5+ BucksDoesAvg Age ALL Bucks% 0.5 Yr BucksWeight*% 1.5 YrWeight*PointsCircumf.LengthSpread% 2.5 YrWeight*PointsCircumf.LengthSpread% 3.5 YrWeight*PointsCircumf.LengthSpread% 4.5+ YrWeight*PointsCircumf.LengthSpread% Doe Lactation1.5 Yr2.5 Yr3.5+ YrDoe Age Classes% 0.5 Yr% 1.5 Yr% 2.5 Yr% 3.5+ YrDoe Weights*0.5 Yr1.5 Yr2.5 Yr3.5+ YrSeasonAverage07 06 05 04 03 02 01 00+ 99 98 91-94 03-07146,496 115,177 97,661 180,440 182,139 193,902 171,215 181,754 187,806 211,555 221,531 144,3831,752 1,685 1,319 2,030 1,964 1,974 1,818 2,020 2,459 2,757 3,045 1,750740 634 549 884 838 935 890 999 1,004 1,145 1,656 7291,012 1,051 770 1,146 1,126 1,039 928 1,021 1,455 1,612 1,457 1,02184 68 74 89 93 98 94 90 76 77 73 83198 182 178 204 217 207 192 182 187 185 134 196416 360 258 450 490 539 422 520 567 596 1365 395145 110 127 157 162 187 184 178 129 131 163 1412.7 2.8 2.5 2.6 2.5 2.4 2.6 3.2 3.2 3.1 2.4 2.67 5 6 4 4 7 3 4 6 9 7 5.366 61 67 62 66 97 66 58 62 63 63 64.321 16 19 16 22 23 15 15 16 23 52 19106 107 116 115 118 121 117 116 118 116 112 1122.6 3.0 3.5 3.8 4.1 4.6 4.1 4.2 4.3 4.2 3.2 3.41.9 2.2 2.2 2.3 2.4 2.5 2.3 2.5 2.3 2.3 2.2 2.24.9 6.0 7.3 7.3 8.3 9.2 7.9 8.5 8.3 8.4 6.7 6.85.0 6.1 7.0 6.8 7.2 7.7 7.1 7.2 7.1 7.1 5.8 6.423 25 27 32 28 30 34 47 45 37 31 27143 141 144 143 148 147 147 142 145 144 144 1446.6 7.0 6.5 6.5 6.4 6.6 6.7 6.6 6.8 6.7 6.5 6.63.4 3.5 3.4 3.3 3.4 3.4 3.4 3.3 3.4 3.4 3.3 3.414.0 14.3 13.9 13.7 13.9 14.0 14.0 13.8 14.4 13.9 13.6 13.911.1 11.5 11.2 11.1 11.5 11.4 11.7 11.3 11.7 11.2 11.0 11.328 29 32 35 29 25 28 27 26 23 9 31159 155 157 156 159 160 154 158 166 165 164 1577.5 7.4 7.2 7.2 7.2 7.4 7.2 7.8 7.9 8.1 7.9 7.33.9 3.9 3.8 3.7 3.8 3.9 3.7 4.0 4.1 4.1 4.1 3.816.1 16.1 15.9 15.8 15.8 16.3 15.5 16.7 17.3 17.3 17.3 15.912.9 12.7 13.1 12.7 12.9 13.4 12.5 13.3 14.0 13.7 14.0 12.922 25 16 14 17 14 17 8 7 8 2 19169 169 168 171 173 171 166 171 171 173 174 1708.1 8.0 7.8 8.0 7.9 8.0 7.8 8.1 8.4 8.8 8.4 8.04.3 4.3 4.3 4.4 4.2 4.3 4.1 4.6 4.5 4.5 4.5 4.318.3 18.1 18.0 18.4 18.0 18.2 17.8 18.7 19.0 19.0 19.3 18.214.6 14.5 14.4 14.5 14.4 14.7 14.2 15.0 15.2 14.9 15.4 14.511 11 22 20 10 17 11 10 13 14 9 1556 54 59 54 55 61 51 59 59 60 54 5669 65 61 70 70 71 66 67 70 71 65 679 9 9 6 11 11 7 5 11 10 12 923 22 21 24 26 24 24 26 23 24 24 2320 17 23 23 19 19 23 26 28 24 25 2049 53 47 47 44 45 43 43 38 42 39 4863 60 62 61 73 74 66 63 63 62 60 6492 91 95 93 97 98 96 89 92 94 93 94105 103 109 107 105 106 107 102 102 105 104 106111 110 109 112 112 112 112 109 110 110 111 111* ALL weights are live weights00+ Year bag limit changed (3-5 to 3-3, bucks-antlerless) continue minimum 4 points or moreSoil Resources2007-2008 Mississippi Deer Program Report51
Table 17. Lower Thin Loess Soil Resource AreaSummary of DMAP DataSoil ResourcesAcresTotal DeerBucksDoesAcres/DeerBucks3.5+ BucksDoesAvg Age ALL Bucks% 0.5 Yr BucksWeight*% 1.5 YrWeight*PointsCircumf.LengthSpread% 2.5 YrWeight*PointsCircumf.LengthSpread% 3.5 YrWeight*PointsCircumf.LengthSpread% 4.5+ YrWeight*PointsCircumf.LengthSpread% Doe Lactation1.5 Yr2.5 Yr3.5+ YrDoe Age Classes% 0.5 Yr% 1.5 Yr% 2.5 Yr% 3.5+ YrDoe Weights*0.5 Yr1.5 Yr2.5 Yr3.5+ YrSeasonAverage07 06 05 04 03 02 01 00+ 99 98 91-94 03-07138,214 105,389 135,699 182,122 175,641 178,461 171,661 223,985 230,662 236,033 214,591 147,4131,639 1,627 1,413 2,251 2,526 2,284 2,173 2,776 3,426 3,915 3,892 1,891619 536 531 841 921 897 836 1,043 1,157 1,379 1,705 6901,020 1,091 882 1,410 1,605 1,387 1,337 1,733 2,269 2,536 1,457 1,20284 65 96 81 70 78 79 81 67 60 55 79223 197 256 217 191 199 205 216 199 171 126 214456 340 306 360 395 377 419 430 391 364 578 371136 97 154 129 109 129 128 130 102 93 99 1232.9 3.0 3.0 2.9 2.8 2.9 2.8 3.2 3.2 3.1 2.4 2.95 5 4 2 2 2 2 4 8 7 9 3.766 66 69 69 74 131 71 61 60 66 62 68.614 16 11 10 15 12 11 11 13 14 39 13106 109 116 109 115 122 121 115 115 111 110 1112.6 2.9 3.7 3.0 3.8 4.4 3.9 3.8 4.2 3.6 2.8 3.21.8 2.1 2.3 1.8 2.4 2.6 2.5 2.2 2.2 2.3 2.1 2.14.7 5.3 7.6 6.5 7.7 8.9 7.7 7.4 8.0 7.3 5.8 6.45.2 5.8 7.0 7.7 7.1 7.7 6.9 6.8 6.8 6.6 5.6 6.526 18 21 24 28 27 31 35 28 32 30 23146 150 148 144 149 150 143 144 145 143 142 1486.7 7.1 6.6 6.6 6.6 6.7 6.7 6.9 6.8 6.7 6.3 6.73.3 3.4 3.3 3.2 3.4 3.4 3.3 3.3 3.3 3.4 3.3 3.314.2 14.7 14.1 13.5 13.8 14.1 13.9 14.1 13.7 13.9 13.6 14.011.5 11.6 11.5 11.0 10.9 11.4 10.9 11.3 11.1 11.0 10.7 11.328 28 38 38 33 31 29 28 27 28 16 33167 166 164 162 168 167 164 163 163 159 163 1667.6 7.3 7.3 7.5 7.6 7.7 7.7 7.5 7.6 7.6 7.5 7.54.0 4.0 3.9 3.7 3.9 3.9 3.9 3.9 3.8 3.8 3.8 3.917.2 16.8 16.2 16.3 16.8 17.1 16.5 17.0 16.6 16.2 16.7 16.713.6 13.2 12.9 13.3 13.4 13.7 13.3 13.5 13.4 12.8 13.3 13.328 33 26 26 23 25 23 22 24 19 7 27178 180 177 179 181 181 179 176 177 174 176 1798.2 8.1 8.2 8.1 8.3 8.3 8.2 8.2 8.3 8.3 8.3 8.24.5 4.3 4.5 4.3 4.5 4.5 4.4 4.3 4.5 4.3 4.4 4.419.7 18.8 18.7 18.7 19.1 19.3 19.3 18.9 18.9 18.9 19.2 19.015.3 15.1 14.7 14.8 14.9 15.0 15.1 15.0 14.9 14.9 15.0 15.013 9 9 11 10 12 14 9 10 9 11 1162 66 61 64 61 61 64 60 62 57 61 6375 74 74 72 74 77 74 74 77 77 75 747 7 7 6 4 5 3 7 9 10 10 623 19 21 25 25 23 24 24 22 24 23 2323 16 17 19 20 19 22 23 22 20 24 1947 58 55 50 51 47 47 46 47 46 43 5268 65 67 64 64 74 70 61 59 62 59 6696 96 99 96 98 101 99 95 95 94 94 97110 107 110 107 109 110 108 107 104 106 107 109116 115 115 115 115 116 116 114 113 114 115 115* ALL weights are live weights00+ Year bag limit changed (3-5 to 3-3, bucks-antlerless) continue minimum 4 points or more522007-2008 Mississippi Deer Program Report
Table 18. Black Prairie Soil Resource AreaSummary of DMAP DataAcresTotal DeerBucksDoesAcres/DeerBucks3.5+ BucksDoesAvg Age ALL Bucks% 0.5 Yr BucksWeight*% 1.5 YrWeight*PointsCircumf.LengthSpread% 2.5 YrWeight*PointsCircumf.LengthSpread% 3.5 YrWeight*PointsCircumf.LengthSpread% 4.5+ YrWeight*PointsCircumf.LengthSpread% Doe Lactation1.5 Yr2.5 Yr3.5+ YrDoe Age Classes% 0.5 Yr% 1.5 Yr% 2.5 Yr% 3.5+ YrDoe Weights*0.5 Yr1.5 Yr2.5 Yr3.5+ YrSeasonAverage07 06 05 04 03 02 01 00+ 99 98 91-94 03-0797,497 146,206 147,416 226,540 212,342 217,575 186,663 142,720 155,976 173,388 156,927 166,000940 995 1,010 1,486 1,715 1,663 1,475 1,246 1,328 1,455 1,994 1,229384 396 417 632 898 785 722 540 629 675 857 545556 599 593 854 817 878 753 706 699 780 1,457 684104 147 146 152 124 131 127 115 117 119 79 135254 369 354 358 236 277 259 265 248 257 186 304301 617 737 852 826 659 547 539 551 642 913 667175 244 249 265 260 248 248 203 223 222 139 2423.0 3.0 2.9 2.6 2.1 2.4 2.5 3.2 3.2 3.1 2.4 2.71 2 3 6 4 5 5 7 4 6 8 3.376 65 74 64 61 63 63 62 60 63 64 67.710 10 9 9 38 20 17 15 17 22 49 15112 118 124 115 106 114 110 114 116 116 113 1153.3 3.6 3.9 4.5 3.2 5.0 4.6 5.1 4.9 4.5 3.3 3.72.5 2.6 2.7 2.4 2.1 2.6 2.5 2.7 2.6 2.6 2.2 2.56.7 8.5 8.6 8.8 6.3 9.5 8.5 9.7 9.0 8.8 6.9 7.86.6 6.9 7.9 7.3 5.7 7.4 6.8 8.1 7.6 7.0 6.3 6.922 23 25 39 28 30 33 29 34 32 23 27146 144 147 147 136 141 130 132 142 139 143 1447.0 6.8 6.9 6.6 6.3 6.8 6.6 6.5 6.6 6.5 6.1 6.73.5 3.5 3.5 3.3 3.3 3.3 3.2 3.2 3.4 3.4 3.3 3.414.7 14.6 14.8 14.5 13.5 13.8 13.3 13.5 14.0 13.8 13.7 14.411.9 12.0 12.1 11.7 10.9 11.1 10.8 10.9 11.3 11.2 10.9 11.737 39 39 32 20 30 28 28 30 27 15 33156 160 164 166 158 155 154 154 158 152 160 1617.8 7.6 7.5 7.7 7.4 7.4 7.7 7.8 8.0 7.8 7.3 7.63.8 3.9 4.0 3.8 3.9 3.8 3.8 3.9 3.9 3.8 3.7 3.916.5 16.5 16.9 16.8 16.4 16.1 16.1 16.6 16.9 16.0 16.4 16.613.5 13.3 13.5 13.7 13.0 12.9 13.0 13.1 13.4 12.6 13.2 13.429 26 24 14 11 14 15 21 15 13 6 21167 182 182 179 178 170 170 174 177 168 173 1788.7 8.4 8.2 8.0 8.1 8.1 8.6 8.3 8.6 8.3 8.0 8.34.3 4.5 4.5 4.3 4.6 4.2 4.3 4.5 4.4 4.5 4.2 4.418.7 19.3 19.1 18.2 18.6 18.3 18.6 18.7 18.5 18.7 18.4 18.814.8 14.9 15.0 14.1 14.8 14.8 15.0 14.6 14.8 14.3 14.5 14.713 19 24 16 10 11 9 12 16 9 14 1652 57 64 61 55 61 57 52 58 50 57 5866 73 70 70 63 71 66 66 66 62 66 687 8 8 8 5 9 7 8 10 11 12 723 18 24 20 30 19 25 24 23 21 24 2321 20 21 31 21 20 20 18 20 20 19 2350 55 47 42 45 47 45 50 47 48 47 4876 67 71 63 55 54 56 55 62 61 59 6797 97 96 95 92 94 90 90 95 93 95 96106 107 108 106 104 103 100 101 105 104 105 106115 115 117 114 111 110 110 109 111 110 113 114* ALL weights are live weights00+ Year bag limit changed (3-5 to 3-3, bucks-antlerless) continue minimum 4 points or moreSoil Resources2007-2008 Mississippi Deer Program Report53
Table 19. Upper Coastal Plain Soil Resource AreaSummary of DMAP DataSoil ResourcesAcresTotal DeerBucksDoesAcres/DeerBucks3.5+ BucksDoesAvg Age ALL Bucks% 0.5 Yr BucksWeight*% 1.5 YrWeight*PointsCircumf.LengthSpread% 2.5 YrWeight*PointsCircumf.LengthSpread% 3.5 YrWeight*PointsCircumf.LengthSpread% 4.5+ YrWeight*PointsCircumf.LengthSpread% Doe Lactation1.5 Yr2.5 Yr3.5+ YrDoe Age Classes% 0.5 Yr% 1.5 Yr% 2.5 Yr% 3.5+ YrDoe Weights*0.5 Yr1.5 Yr2.5 Yr3.5+ YrSeasonAverage07 06 05 04 03 02 01 00+ 99 98 91-94 03-07485,608 496,277 521,073 490,352 553,556 511,330 496,206 557,521 705,830 727,380 879,440 509,3733,537 3,992 3,906 3,772 3,662 3,724 3,595 4,786 5,409 5,719 8,488 3,7741,577 1,689 1,688 1,626 1,632 1,749 1,804 2,155 2,648 2,536 4,677 1,6421,960 2,303 2,218 2,146 2,030 1,975 1,791 2,631 2,761 3,183 1,457 2,131137 124 133 130 151 137 138 116 130 127 105 135308 294 309 302 339 292 275 259 267 287 188 310664 654 721 908 766 689 703 631 762 797 997 743248 215 235 228 273 259 277 212 256 229 237 2392.7 2.6 2.7 2.4 2.5 2.5 2.5 2.8 3.2 3.1 2.4 2.64 3 4 5 2 3 3 4 6 7 7 3.564 60 65 65 63 61 60 59 58 62 58 63.318 17 14 16 19 20 16 20 21 24 51 17107 108 107 109 107 113 112 112 113 112 108 1083.6 3.9 3.8 4.1 4.3 4.7 4.6 4.7 4.7 4.6 3.2 3.92.1 2.3 2.2 2.5 2.4 2.5 2.6 2.5 2.5 2.5 2.1 2.36.9 8.0 7.6 8.3 8.7 9.2 9.1 9.2 9.3 8.9 6.7 7.96.5 6.9 6.8 7.5 7.4 7.5 7.6 7.7 7.5 7.4 5.8 7.028 30 32 41 33 32 38 35 38 33 24 33136 137 137 140 136 139 138 137 138 137 134 1376.6 6.5 6.5 6.5 6.3 6.9 6.6 6.6 6.7 6.6 6.0 6.53.3 3.3 3.3 3.3 3.2 3.3 3.3 3.3 3.3 3.3 3.2 3.313.8 13.8 13.2 13.8 13.4 14.1 13.7 13.7 14.0 13.7 13.2 13.611.0 11.1 10.8 11.1 10.7 11.3 11.1 11.1 11.3 10.9 10.5 10.929 31 31 27 30 28 28 27 25 24 14 30150 153 151 152 153 152 152 150 156 152 152 1527.4 7.3 7.0 7.3 7.1 7.4 7.4 7.5 7.5 7.3 7.1 7.23.8 3.8 3.7 3.8 3.7 3.8 3.7 3.8 3.9 3.8 3.6 3.816.2 15.8 15.6 15.8 15.7 15.7 15.9 16.1 16.4 15.8 15.6 15.813.0 12.8 12.5 12.6 12.6 12.7 12.7 12.9 13.2 12.6 12.7 12.721 19 19 12 16 16 14 14 10 12 5 18161 168 164 167 164 166 167 164 171 170 164 1658.3 7.9 7.7 7.9 7.9 8.0 8.0 8.1 8.3 8.0 7.6 7.94.2 4.3 4.1 4.2 4.2 4.3 4.3 4.2 4.3 4.2 4.1 4.218.2 17.8 17.4 17.8 17.9 18.2 18.4 18.2 18.3 17.9 17.7 17.814.4 14.4 14.1 14.4 14.4 14.3 14.4 14.8 14.8 14.5 14.1 14.310 11 12 12 14 14 10 12 16 15 13 1250 53 57 57 51 56 59 57 65 57 56 5469 69 68 67 69 68 71 67 72 70 65 687 7 7 8 4 7 6 8 10 10 11 723 20 22 21 24 22 24 23 24 24 24 2221 19 20 25 22 18 23 24 23 22 20 2150 55 52 46 50 48 43 45 43 44 45 5059 59 62 63 60 59 60 58 57 59 58 6188 89 89 88 87 90 89 87 89 88 89 8898 97 99 100 97 100 100 97 99 97 99 98106 107 107 106 105 105 107 103 104 105 105 106* ALL weights are live weights00+ Year bag limit changed (3-5 to 3-3, bucks-antlerless) continue minimum 4 points or more542007-2008 Mississippi Deer Program Report
Table 20. Lower Coastal Plain Soil Resource AreaSummary of DMAP DataAcresTotal DeerBucksDoesAcres/DeerBucks3.5+ BucksDoesAvg Age ALL Bucks% 0.5 Yr BucksWeight*% 1.5 YrWeight*PointsCircumf.LengthSpread% 2.5 YrWeight*PointsCircumf.LengthSpread% 3.5 YrWeight*PointsCircumf.LengthSpread% 4.5+ YrWeight*PointsCircumf.LengthSpread% Doe Lactation1.5 Yr2.5 Yr3.5+ YrDoe Age Classes% 0.5 Yr% 1.5 Yr% 2.5 Yr% 3.5+ YrDoe Weights*0.5 Yr1.5 Yr2.5 Yr3.5+ YrSeasonAverage07 06 05 04 03 02 01 00+ 99 98 91-94 03-07386,070 334,957 397,543 397,659 402,461 343,592 334,038 202,709 264,521 328,344 308,965 383,7381,373 1,376 1,142 1,468 1,500 1,590 1,512 1,506 1,721 2,163 2,944 1,372665 654 541 596 698 838 832 686 812 977 1,467 631708 722 601 872 802 752 680 820 909 1,186 1,457 741281 243 348 271 268 216 221 135 154 152 104 282581 512 735 667 577 410 401 295 326 336 210 6081173 1091 1636 1446 2064 1108 1152 672 740 820 1098 1482545 464 661 456 502 457 491 247 291 277 209 5172.9 2.6 2.7 2.6 2.3 2.5 2.4 2.9 3.2 3.1 2.4 2.62 2 3 4 3 2 3 3 3 7 10 2.860 57 68 71 60 62 61 55 58 61 56 63.310 18 11 16 13 11 12 15 18 18 47 14104 109 109 104 110 113 111 109 108 107 102 1073.1 3.9 4.0 3.7 4.2 4.5 4.6 4.7 4.5 4.0 2.7 3.82.1 2.4 2.7 2.3 2.4 2.4 2.4 2.3 2.4 2.2 1.9 2.46.5 8.5 8.9 7.3 8.5 8.9 8.6 8.4 8.5 7.5 5.4 7.95.9 7.2 7.5 6.4 7.0 7.2 7.8 7.2 6.9 6.8 5.3 6.833 28 36 33 56 46 53 38 35 34 25 37135 133 135 138 136 134 134 132 131 130 126 1356.6 6.6 6.8 6.6 6.5 6.7 6.7 6.9 6.4 6.4 5.2 6.63.1 3.2 3.3 3.3 3.2 3.3 3.2 3.3 3.1 3.1 2.8 3.213.6 13.7 13.5 13.6 13.6 13.7 13.6 13.6 12.9 12.7 11.5 13.611.1 11.1 10.9 11.2 10.9 10.9 10.9 11.2 10.7 10.2 9.3 11.031 34 31 33 20 26 22 30 28 26 14 30149 143 148 149 147 142 151 152 145 145 146 1477.6 7.6 7.3 7.4 7.2 7.5 7.7 7.5 7.3 7.5 7.1 7.43.8 3.7 3.7 3.7 3.6 3.6 3.7 3.7 3.5 3.6 3.5 3.715.6 15.5 15.0 15.5 15.5 15.2 16.2 15.5 15.3 15.3 15.0 15.412.7 12.5 12.6 13.0 12.5 12.4 13.0 12.8 12.5 12.3 12.1 12.624 18 18 14 9 12 10 14 16 15 6 17158 160 153 154 156 155 162 158 158 153 155 1568.1 8.2 7.9 8.0 8.0 8.2 8.1 8.0 8.2 7.9 7.5 8.14.2 4.2 4.1 4.1 4.1 4.2 4.2 4.1 4.2 4.1 4.0 4.118.0 18.2 17.2 17.6 17.7 17.8 18.2 17.7 17.8 17.3 17.0 17.714.4 14.6 13.9 14.6 13.9 14.5 14.8 14.5 14.3 14.1 13.8 14.313 11 15 12 6 19 8 21 17 19 14 1150 60 48 52 60 58 61 63 68 69 58 5461 62 68 66 64 66 71 73 70 73 68 645 5 4 5 4 3 5 7 6 8 11 518 18 17 19 20 19 20 18 22 20 23 1822 23 23 30 38 30 40 25 24 22 21 2756 54 56 46 38 47 35 51 48 50 45 5060 57 62 63 57 55 57 55 57 56 54 6088 88 88 88 83 88 86 90 87 85 86 8799 100 96 96 96 95 93 95 97 94 95 97102 103 101 102 101 100 99 101 101 100 100 102* ALL weights are live weights00+ Year bag limit changed (3-5 to 3-3, bucks-antlerless) continue minimum 4 points or moreSoil Resources2007-2008 Mississippi Deer Program Report55
Table 21. Coastal Flatwoods Soil Resource AreaSummary of DMAP DataSoil ResourcesAcresTotal DeerBucksDoesAcres/DeerBucks3.5+ BucksDoesAvg Age ALL Bucks% 0.5 Yr BucksWeight*% 1.5 YrWeight*PointsCircumf.LengthSpread% 2.5 YrWeight*PointsCircumf.LengthSpread% 3.5 YrWeight*PointsCircumf.LengthSpread% 4.5+ YrWeight*PointsCircumf.LengthSpread% Doe Lactation1.5 Yr2.5 Yr3.5+ YrDoe Age Classes% 0.5 Yr% 1.5 Yr% 2.5 Yr% 3.5+ YrDoe Weights*0.5 Yr1.5 Yr2.5 Yr3.5+ YrSeasonAverage07 06 05 04 03 02 01 00+ 99 98 91-94 03-0751,404 49,790 47,790 63,810 55,927 55,650 55,650 51,850 52,850 51,850 46,517 53,744150 110 47 67 148 156 178 202 161 202 177 104118 63 23 29 82 89 116 101 93 101 105 6332 47 24 38 66 67 62 101 68 101 1,457 41343 453 1017 952 378 357 313 257 328 257 526 629436 790 2078 2200 682 625 480 513 568 513 1332 842643 2165 2987 4908 3728 2319 2140 960 1229 1127 3445 28861606 1059 1991 1679 847 831 898 513 777 513 3219 12743.1 2.6 3.3 2.5 2.1 2.3 2.2 2.5 2.7 2.7 2.0 2.70 2 0 0 3 0 1 1 1 2 17 0.90 58 0 0 70 0 48 35 45 60 36 25.517 11 9 10 11 8 6 17 8 7 31 12101 120 106 94 96 83 106 103 106 106 96 1032.6 4.2 2.0 4.5 4.6 4.0 4.1 3.7 3.3 3.8 2.5 3.62.1 2.4 0.0 2.9 2.3 2.3 2.1 2.3 1.9 2.3 1.4 1.94.5 7.9 0.0 7.6 9.2 6.9 7.9 7.7 7.4 8.1 4.3 5.86.6 7.2 0.0 5.5 7.1 5.6 6.6 7.9 7.6 7.0 5.7 5.314 46 18 48 68 64 72 31 39 42 29 39135 143 114 128 130 125 122 126 120 123 120 1306.7 7.1 4.8 5.8 5.9 6.2 5.9 5.8 5.8 5.7 4.9 6.02.9 3.5 2.9 3.3 2.9 2.9 2.9 2.8 2.6 2.8 2.4 3.114.1 14.3 13.3 12.8 12.1 12.6 12.3 12.1 11.4 11.9 10.0 13.310.9 12.6 10.3 11.2 9.7 9.9 9.8 10.0 9.5 9.7 7.8 10.930 27 32 29 16 19 16 41 35 32 16 27140 152 146 130 134 132 139 132 136 131 115 1417.0 8.0 7.6 7.0 6.5 7.3 7.2 6.4 6.6 5.8 5.1 7.23.2 4.0 3.9 3.6 3.4 3.5 3.8 2.9 3.2 2.9 2.5 3.615.1 16.4 16.7 15.5 14.5 15.2 15.6 13.3 13.6 12.0 10.7 15.612.0 13.3 13.5 12.3 12.2 13.2 12.3 11.1 10.9 9.7 8.9 12.639 15 41 13 3 9 5 11 17 17 6 22161 145 160 132 141 155 165 163 155 136 116 1487.6 7.8 7.9 8.3 6.0 7.9 8.5 7.5 7.5 7.3 5.1 7.54.1 3.8 4.3 3.9 3.3 4.2 4.1 3.9 3.8 3.6 2.8 3.916.9 16.3 17.9 16.4 11.9 16.5 18.9 16.6 16.9 15.4 11.5 15.914.1 13.2 13.9 12.7 9.1 13.2 14.8 13.6 13.0 11.9 9.6 12.69 0 0 43 22 7 18 18 0 25 6 1550 33 60 33 77 50 50 54 80 63 65 5171 55 56 45 43 65 47 65 56 68 67 543 3 14 18 3 8 8 8 5 7 0 838 20 19 21 30 22 22 19 13 13 10 2513 10 24 18 38 35 41 29 25 27 23 2047 67 43 44 30 35 30 45 57 53 67 4667 37 44 48 70 68 61 52 57 58 0 5387 81 89 81 83 77 84 81 76 86 41 8481 78 79 92 92 85 86 90 84 81 69 8491 98 98 92 96 89 90 94 93 92 90 95* ALL weights are live weights00+ Year bag limit changed (3-5 to 3-3, bucks-antlerless) continue minimum 4 points or more562007-2008 Mississippi Deer Program Report
Table 22. Interior Flatwoods Soil Resource AreaSummary of DMAP DataAcresTotal DeerBucksDoesAcres/DeerBucks3.5+ BucksDoesAvg Age ALL Bucks% 0.5 Yr BucksWeight*% 1.5 YrWeight*PointsCircumf.LengthSpread% 2.5 YrWeight*PointsCircumf.LengthSpread% 3.5 YrWeight*PointsCircumf.LengthSpread% 4.5+ YrWeight*PointsCircumf.LengthSpread% Doe Lactation1.5 Yr2.5 Yr3.5+ YrDoe Age Classes% 0.5 Yr% 1.5 Yr% 2.5 Yr% 3.5+ YrDoe Weights*0.5 Yr1.5 Yr2.5 Yr3.5+ YrSeasonAverage07 06 05 04 03 02 01 00+ 99 98 91-94 03-0796,756 97,333 95,029 78,756 63,604 63,200 66,210 40,870 38,770 36,270 69,015 86,296999 951 713 574 328 409 514 397 429 373 1,107 713431 435 296 243 147 212 265 179 199 135 517 310568 516 417 331 181 197 249 218 230 238 1,457 40397 102 133 137 194 155 129 103 90 97 63 133224 224 321 324 433 298 250 228 195 269 135 277515 459 609 796 1097 658 534 486 487 548 642 695170 189 228 238 351 321 266 188 169 152 120 2142.7 2.7 2.7 2.6 2.4 2.7 2.7 3.2 3.2 3.1 2.4 2.66 5 3 6 4 3 2 4 9 12 9 4.967 64 64 63 61 59 61 59 64 67 63 63.810 14 17 13 21 8 10 15 18 16 45 15109 105 124 105 110 116 122 117 119 114 111 1112.4 3.0 2.5 3.0 4.1 4.9 5.6 5.4 4.4 3.8 3.0 3.01.6 2.0 1.9 1.9 2.4 2.7 2.7 2.9 2.4 2.1 2.2 2.04.1 6.6 6.2 6.4 9.3 9.7 11.2 11.9 9.0 7.3 6.5 6.54.6 7.3 7.0 7.2 7.6 7.1 8.3 9.0 7.9 7.3 6.0 6.736 28 21 36 33 34 33 34 33 23 25 31144 143 143 151 134 142 143 145 144 138 137 1436.9 6.6 6.4 7.0 6.0 7.0 6.7 6.6 6.7 6.4 5.7 6.63.5 3.3 3.3 3.3 3.2 3.5 3.3 3.3 3.4 3.1 3.1 3.315.0 13.7 14.1 14.5 12.8 14.9 14.2 14.4 14.0 13.8 13.0 14.011.9 11.1 11.2 12.3 10.0 11.3 11.7 11.4 12.0 11.5 10.1 11.331 33 38 25 25 32 35 30 25 35 16 30158 160 157 161 167 162 159 160 164 152 153 1617.8 7.4 7.9 7.3 7.4 7.7 7.8 8.2 7.3 7.3 7.1 7.63.9 3.8 3.6 3.6 3.8 4.0 3.9 3.8 3.9 3.7 3.6 3.816.8 16.6 15.9 15.8 15.4 16.7 16.5 16.6 15.0 15.5 15.6 16.113.1 13.2 12.6 13.0 12.6 13.0 13.4 13.5 12.5 12.3 12.5 12.917 21 21 21 17 17 18 17 15 14 5 19174 172 184 184 158 185 176 179 179 171 176 1758.4 8.2 7.9 8.3 7.5 8.6 9.0 8.0 8.6 7.9 8.5 8.14.4 4.3 4.2 4.1 4.0 4.7 4.3 4.4 4.5 4.0 4.3 4.218.6 18.4 17.9 18.8 17.0 19.8 18.8 19.4 18.8 18.0 18.5 18.114.4 14.6 14.2 14.7 13.8 15.5 15.1 14.7 16.0 14.3 15.0 14.311 6 19 19 10 16 11 12 8 18 15 1356 55 55 48 57 51 55 69 51 67 53 5475 68 69 66 71 73 67 66 67 75 65 705 4 6 10 5 3 1 6 5 17 11 623 25 20 23 28 17 19 27 27 21 28 2426 28 20 27 21 19 27 26 26 19 20 2447 43 55 41 46 53 49 41 42 43 42 4661 58 58 60 60 56 68 56 58 65 60 6093 91 92 94 93 94 93 94 94 96 93 93102 106 106 108 105 103 103 105 105 101 103 106110 110 113 115 116 112 117 114 114 111 111 113* ALL weights are live weights00+ Year bag limit changed (3-5 to 3-3, bucks-antlerless) continue minimum 4 points or moreSoil Resources2007-2008 Mississippi Deer Program Report57
CitationsEnforcement of Deer Hunter-Related Citations2007-2008The Law Enforcement Bureau began monitoring all statewide citationsat the district and county levels during the 1996-1997 deerseason. The eight most common deer hunting citations from October1-January 31 were extracted from the database and summarized.Citation totals by county are shown in Table 24 on page 59. Yearlytrends in various citations show some variability.A total of 2,376 citations were written during the 2007-2008 deerhunting season. This is a decrease of 191 citations from the previousseason. The total number of citations was at an all time high in2003-2004. Over the past 4 hunting seasons, citations have beensignificantly lower (Table 23 and Figure 18). The decline in citationsmay be attributed to a combination of factors: violations actually decreased,fewer hunters in the woods, and new or no officers in anarea.It is logical to assume that if fewer citations were written for a specificviolation, then a decreased incidence of that violation occurred.Hunting from a motor vehicle and headlighting were violations thatnotably decreased for the 2007-2008 deerseason. Some violations are still occurring atdangerously high levels. Failure to wear hunterorange, which increased slightly this year,is a good example. Many hunters still refuseto wear hunter orange. This law is in place toprotect hunters. Trespassing also still occursat a high rate, indicating that anyone couldbe on the land without a hunter’s knowledge.The most common citation in the past deerseason was hunting from public roads, whichalso poses a significant safety threat.The number of licensed hunters continuesto decline. This could be another reason forthe general decrease in citations. With fewerhunters taking to the field, number of violationsshould decrease. However, many huntersare ignoring license requirements andtaking their chances. This is evident by theincrease in citations for no hunting license byresidents.The number of baiting citations for the 2007-2008 season decreasedslightly from last year. However, hunter acceptance of baitingcontinues to increase. Bait is readily available and a big seller. When acitation is written and a conviction obtained, the minimal fine for thisoffense is hardly a deterrent to prevent future baiting.With more hunters managing their land for bigger deer, manypoachers are trying to take advantage of the results that managershave created. More large-antlered bucks on roadsides equal moretemptations. Many would-be hunters are giving in and turning topoaching. This is evidenced by the number of trespassing and headlightingcitations written each year.Our officers are doing a good job across the state, but they needthe help of sportsmen. Hunters can assist our officers by reportingwildlife violations by calling 1-800-BE-SMART. Most counties haveonly 2 officers, but with concerned sportsmen, they have eyes andears all over the county.Figure 18: Total CitationsTable 23. Statewide Citations Summary by Most FrequentViolations During Deer SeasonSeason Totals1997-981998-991999-002000-012001-022002-032003-042004-052005-062006-072007-08Hunt FromNo LicenseNo HunterTres- Head- TotalMotor PublicBaitingOrangeNon-Residentpassing lighting CitationsVehicle RoadResident476 1063 403 335 112 313 278 282 3262433 1037 409 378 152 356 290 260 3315238 938 415 422 87 449 318 299 3166236 1137 612 505 118 519 297 332 3756120 840 702 491 179 781 275 227 361599 867 658 491 184 569 240 282 3390136 914 700 482 159 724 330 363 3808104 725 652 391 125 689 283 261 323057 528 271 445 68 365 343 179 225659 609 363 341 115 554 223 303 256733 575 401 356 102 544 207 158 2376582007-2008 Mississippi Deer Program Report
Table 24. Citations Summary of Most FrequentViolations During 2007-2008 Deer SeasonCountyHunt FromMotor VehicleHunt FromPublic RoadNo Hunter OrangeNo LicenseResidentNo LicenseNon-ResBaitingTresspassingHeadlightingTotal CitationsCountyHunt FromMotor VehicleHunt FromPublic RoadNo Hunter OrangeNo LicenseResidentNo LicenseNon-ResBaitingTresspassingHeadlightingTotal CitationsAdamsAlcornAmiteAttalaBentonBolivarCalhounCarrollChickasawChoctawClaiborneClarkeClayCoahomaCopiahCovingtonDesotoForrestFranklinGeorgeGreeneGrenadaHancockHarrisonHindsHolmesHumphreysIssaquenaItawambaJacksonJasperJeff DavisJeffersonJonesKemperLafayetteLamarLauderdaleLawrenceLeakeLee0 0 7 1 9 13 0 0 301 14 6 3 4 0 6 7 411 12 15 2 4 17 2 3 566 17 9 4 1 28 3 4 721 14 5 1 1 4 1 0 270 4 2 1 0 1 4 0 122 17 5 7 1 1 5 0 381 0 9 7 1 22 3 2 450 16 3 2 0 6 4 4 352 6 5 6 0 5 0 2 260 3 6 4 3 8 2 0 260 2 24 3 3 32 1 0 650 7 9 9 2 2 7 0 360 0 4 3 0 1 0 0 80 2 8 2 7 5 2 0 260 3 4 2 0 6 0 2 170 4 1 5 2 4 3 1 200 5 3 7 0 2 4 5 260 1 2 1 1 8 0 0 130 8 2 11 3 4 0 6 341 21 9 11 1 7 2 3 550 0 1 1 0 0 0 0 20 5 2 2 1 0 0 0 100 8 2 2 0 1 1 4 180 0 2 1 1 3 3 0 101 1 7 1 2 3 2 0 171 3 3 5 1 0 2 1 160 2 4 3 0 7 4 1 210 35 12 17 0 14 11 16 1050 9 6 11 2 0 9 4 410 4 17 6 2 37 2 0 680 0 0 2 1 4 1 0 80 1 8 5 1 14 0 1 300 7 9 8 0 8 0 0 320 6 16 11 7 45 7 0 920 16 5 3 4 5 3 2 380 3 15 3 2 13 0 3 390 1 5 8 1 16 5 0 360 5 0 0 0 0 1 0 60 7 0 1 0 0 0 2 100 7 1 9 0 4 0 12 33LefloreLincolnLowndesMadisonMarionMarshallMonroeMontgomeryNeshobaNewtonNoxubeeOktibbehaPanolaPearl RiverPerryPikePontotocPrentissQuitmanRankinScottSharkeySimpsonSmithStoneSunflowerTallahatchieTateTippahTishomingoTunicaUnionWalthallWarrenWashingtonWayneWebsterWilkinsonWinstonYalobushaYazoo2 3 1 0 0 0 1 4 110 7 5 2 2 9 2 1 280 2 6 1 0 5 4 7 250 12 2 2 0 1 3 8 283 10 14 8 0 10 4 4 530 7 6 4 1 6 2 2 280 24 6 17 0 7 17 5 760 3 2 1 2 6 0 0 142 2 7 6 0 9 3 0 290 16 4 8 1 9 2 2 420 3 4 1 1 1 7 1 180 0 1 3 0 2 2 0 80 12 9 7 2 26 6 0 620 2 3 2 1 0 1 1 100 33 4 11 1 7 1 1 580 0 1 0 0 2 0 0 30 8 5 4 0 5 6 6 340 23 1 5 0 3 2 2 360 1 0 0 0 1 0 0 21 1 3 7 0 0 3 0 150 1 3 1 1 3 3 0 124 14 7 10 2 0 1 2 400 6 2 9 0 12 0 0 290 21 3 5 0 3 0 7 390 6 2 2 0 0 0 0 100 2 0 0 0 0 4 0 60 3 1 3 0 1 4 0 120 0 5 5 1 14 1 0 260 1 1 4 0 1 1 3 110 4 0 3 3 0 1 0 111 4 4 1 0 4 4 0 180 11 1 2 1 5 3 11 342 3 10 2 2 14 4 2 390 2 4 3 1 5 5 2 220 1 1 6 0 1 0 0 90 23 4 3 4 6 0 0 400 2 4 4 1 7 0 0 180 2 7 1 5 5 0 0 200 11 2 2 1 0 0 0 160 11 0 7 1 2 4 1 261 2 3 3 0 2 6 1 18Citations2007-2008 Mississippi Deer Program Report59
2007-2008 Hunting Incident/AccidentSummaryVicki Gardner, Alpen Optics, harvested her first white-tailed deerwhile on a hunt in Copiah County with Mississippi Outdoorscameraman Scooter Whatley.Hunter Accidentshunting accident/incident is one in which a person is injuredA by the discharge of a hunting firearm, bow and arrow, or a fallfrom a hunting tree stand arising from the activity of hunting.There were 26 total hunting related incident/accidents investigatedin Mississippi during the 2007-2008 hunting season, aslight decrease from last season. Of these, 10 were firearm/bowrelated with 3 fatalities and 16 were tree stand related with 2fatalities.The majority of hunting incidents occurred while deer hunting,but there were also incidents reported while dove, duck, rabbit,and turkey hunting. (Figure 19).Firearm related accidents decreased from last year andtreestand accidents increased. Hunting accidents declined from2001until 2006, but total number of accidents has remainedrelatively constant for the last two seasons. (Figure 20).Sportsmen, Hunter Education Instructors, and ConservationOfficers in Mississippi should be commended for keepinghunting among the safest of sports. Volunteer instructors andConservation Officers certified 9,848 sportsmen in Hunter Educationduring the 2007-2008 season (Figure 21). Hunting accidentsin Mississippi average about one injury for every 13,000licensed hunters, which is an average of around seven injuriesper 100,000 participants. When compared to other sports suchas football, which averages around 3,500 injuries per 100,000participants, hunting is a very safe sport.Youths 12-15 years of age must complete a Hunter Educationcourse in order to hunt unsupervised. Youths 12-15 yearsof age may hunt without a Hunter Education certificate if underthe direct supervision of a licensed adult 21 years of age andolder. Youths under 12 years of age must still be under adultsupervision while hunting. An apprentice license was createdfor residents over the age of 15 which do not have the requiredcertificate of hunter education. This apprentice license may bepurchased one time only by a resident, and the apprentice huntinglicensee must be accompanied by a licensed or exempt residenthunter at least 21 years of age when hunting. With thesenew hunter education requirements, we are confident accidentnumbers will continue to decline.602007-2008 Mississippi Deer Program Report
2007-2008 Hunting Incident/Accident DataFigure 19: Hunting Incident by Animal HuntedFigure 20: Hunting IncidentsFigure 21: Students Trained by YearHunter Accidents2007-2008 Mississippi Deer Program Report61
2007-2008 Research Project SummariesRegional Body and Antler Size Differencesin White-tailed Deer: The BeginningAmy C. Blaylock, Steve Demarais, Bronson Strickland, and Chad M. Dacusrevious research has documented that deer body weight and antler size vary across soil regions, with greater body mass and antler size inP areas of greater soil fertility. However, this information is known only for deer 6 months of age and older. Our objective was to compare fawnsize at birth across three soil regions differing in size of harvested deer: the Delta (larger size), Thin Loess (intermediate size), and Lower CoastalPlain (smaller size).During 2005 and 2006, MDWFP biologists captured bred, adult does from each region and transported them to Mississippi State Universityfor fawning. The soil region of capture affected weight and size of fawns at birth. Fawns born to does from the Lower Coastal Plain weighedless and were smaller than fawns born to does from the Thin Loess and Delta soil regions, similar to patterns observed in adult deer. Growthpatterns of these fawns are being further studied as part of the larger project investigating causes of regional variation in body and antler size.This project was supported by the MDWFP using Federal Aid in Wildlife Restoration funds, Purina Mills, and private individuals.Research Projects622007-2008 Mississippi Deer Program Report
2007-2008 Research Project SummariesBuck Movements in Response to Hunter DensityAndy Little, Steve Demarais, Ken Gee, and Stephen WebbHow many times have you wondered what would happen to the young buck you passed because it didn’t meet your management criteria?Would he end up being seen and harvested by another hunter? And, how does hunter density affect buck movements? Do more hunters onyour property cause bucks to become less available for harvest by pushing them into heavy cover and nocturnal movement patterns? These aresome of the questions to be addressed by Mississippi State University and The Samuel Roberts Noble Foundation in Oklahoma during the gunseasons of 2008 and 2009. Deer movements will be studied at three hunter densities; 1 hunter per 75 acres, 1 hunter per 250 acres, and no hunterson a sanctuary area. We will study buck movements using Global Positioning System (GPS) tracking collars placed on 54 male white-taileddeer 2.5 years old and older. During the hunting season, tracking collars will automatically take locations of the bucks every 8 minutes. Hunterswill also carry a GPS unit. We will determine how vulnerable bucks are to harvest and how bucks move and select habitat at different hunterdensities. Support for this project is provided by the Samuel Roberts Noble Foundation.Andy LittleResearch Projects2007-2008 Mississippi Deer Program Report63
2007-2008 Research Project SummariesRegional Body and Antler SizeDifferences in White-tailed Deer:Habitat Quality or Genetics?Emily B. Clemons, Steve Demarais, Chad M. Dacus,and Bronson StricklandBody mass and antler development of Mississippi’s deer population varies by soilregion. Although most biologists believe regional differences are due to soil andhabitat quality, research is needed to address concerns that there are genetic limitationsto antler size. Wild does were captured by the MDWFP in the Delta, Thin Loess,and Lower Coastal Plain soil regions. Their offspring are being raised on optimumnutrition to eliminate potential nutritional effects related to their original habitats.These first generation deer are breeding with deer from the same region at MississippiState University to produce offspring for a second generation, to eliminate anylingering ancestral effects from the source regions. If there are no body and antlersize differences after being raised on optimum nutrition, then genetic limitations canbe eliminated as a possible explanation. If differences remain after two generations,then genetics may play a role in body and antler size variation across Mississippi.This research will provide information on regional variation for land owners, so theycan have knowledgeable insight for management with respect to their soil fertility.Emily B. ClemonsThis is a long-term study that requires data collection from two generations of bucksand final results are not expected until 2013. Support for this project is from the MDWFP using Federal Aid in Wildlife Restoration funds, PurinaMills, and private individuals.Estimating Antler Size from PicturesUsing Computer SoftwareJeremy Flinn, Steve Demarais, Ken Gee, Bronson Strickland, and Stephen WebbJudging antler size is a skill desired by many deer enthusiasts. Estimating inside spread or beam length is requiredfor some antler restrictions, but judging total antler size using Boone and Crockett score is much moredifficult. The widespread use of infrared-triggered cameras (trail cameras) has led to frequent pictures of buckswith unknown antler size. We are attempting to create computer software that will allow estimation of specificantler measurements and gross Boone and Crockett score from photographs. This software will be developedusing bucks with known antler scores that have been photographed in Mississippi and Oklahoma. We hope tomake the software available on the Mississippi State University and MDWFP web sites. Support for this projectis provided by the MDWFP using Federal Aid in Wildlife Restoration funds and by the Samuel Roberts NobleFoundation.Research ProjectsJeremy Flinn642007-2008 Mississippi Deer Program Report
2007-2008 Research Project SummariesDeer Forage is Affected by Pine Plantation Establishment MethodsPhil Jones, Scott Edwards, and Steve Demaraisine plantation establishment using large amounts of herbicides raised concerns that it would negativelyP impact deer forage. We measured spring and summer forage production and quality over a range of5 management intensities in 1 – 5-year-old plantations established on commercial forestland in southernMississippi (around Hattiesburg) from 2002 – 2006. Establishment intensities ranged from mechanical sitepreparation followed by a single year of banded herbaceous weed control (low intensity) to both chemical andmechanical site preparation followed by 2 years of broadcast herbaceous weed control (high intensity).Mechanical site preparation produced high amounts of deer forage, but nutritional quality was low.Chemical site preparation cleared away lower quality woody vegetation remaining from the previous standand allowed establishment of more nutritious forbs. Herbaceous weed control applied in spring to controlvegetation competing with the newly planted pines reduced forb coverage. Because broadcast weed controlaffected the entire stand, it reduced forage production more than banded.When nutritional needs were calculated for body maintenance only, nutritional carrying capacity wasPhil Jonesgreater in the least intensive treatment. However, because body growth, pregnancy, lactation, and antlergrowth create greater nutritional demands in spring and summer, the best overall combination of forage quality and quantity was found intreatments with chemical site preparation and banded (not broadcast!) herbaceous weed control. Plant nutritional quality is greater on morefertile soils, so the results of this study may be applicable only to the Lower Coastal Plain of Mississippi (lower quality soils). This project wassupported by the MDWFP using Federal Aid in Wildlife Restoration funds, National Council for Air and Stream Improvement, and Weyerhaeuser,Plum Creek, and Molpus Timberlands.What Does the Moon Have to SayAbout Deer Breeding Season?Mike Dye, Steve Demarais, Bronson Strickland, Chad M. Dacus, Dale Prochaska, and Harry JacobsonHunting magazines regularly address variation in deer conception dates, which makes exciting reading for hunterswanting an edge on a buck mindlessly chasing does during the rut. The “rutting moon theory” proposed by CharlesAlsheimer claims that breeding in the South begins 7 to 21 days after the third full moon following the autumnal equinox(the beginning of Autumn in September when day length and night length are equal). We tested the rutting moon theoryusing a large sample of individual adult does in research pens from Mississippi State University and Kerr Wildlife ManagementArea in Texas. We also tested it using a large group of wild populations that have been studied extensively by theMDWFP. The statistical analyses are too complicated to explain in this short note, but it suffices to say we used an exhaustiveset of analyses to fairly test this theory that gets so much coverage in hunting magazines. Our results were clear andirrefutable – there was absolutely no relationship between breeding dates of individual and populations and the timing Mike Dyeof the “rutting moon.” So, don’t worry how many days it might be since a certain moon to set your hunting plans. You should still plan yourbuck hunting with knowledge of the rut, because a doe in season has a remarkable influence on buck behavior. But, when you want to know thebest estimate of breeding dates in your hunting area just take a look at the breeding date map located on the MDWFP web site at www.mdwfp.com/deer. Support for this project was provided by Mississippi State University, the MDWFP, and Texas Parks and Wildlife using Federal Aid inWildlife Restoration funds.Research Projects2007-2008 Mississippi Deer Program Report65
Magnolia Records ProgramRecordsBy: Rick DillardThe year 2008 marks the 8th year of the Magnolia Records Program.Since the beginning, almost 4,700deer have been scored, with over 3,000 deermeeting the minimum requirements (125inches for typical and 155 inches for nontypical).An analysis of those bucks meetingthe minimum requirements indicates thatcounties in the western region of the state aswell as those in the east-central region havethe highest average antler scores (Figure22). The total number of bucks qualifying forMagnolia Records in each county is depictedin Figure 23.The 2007-2008 hunting season will certainlybe recognized in Mississippi deerhunting history as one of the best for numbersof trophy bucks harvested. In fact, atotal of 9 bucks were large enough to qualifyfor the Boone & Crockett record book (Table27 and Table 28). The largest typical buckscored 176 6/8 and was taken by Paul Warringtonin Bolivar County. The largest nontypicalbuck scored 207 6/8 and was takenby youth hunter Shelby Tate in Amite County.Joe Watt’s buck from Madison County wasthe largest taken by muzzleloader and scored161 4/8 typical. David Jones harvested the largest muzzleloader nontypicalfrom Holmes County with a score of 171 3/8. Rob Stockett’sRob Stockett – Archery State Recordbuck (167 2/8) from Tallahatchie County was the largest typical takenby archery and now stands as the new state record in that category.Lastly, the largest non-typical archery buck was harvested by RogerTankesly in Madison County and scored 1703/8.For many hunters, the true measure ofa bonafide trophy is a buck with an insidespread surpassing 20 inches. To date, over535 deer with inside spreads greater than orequal to 20 inches have been entered. Thewidest deer on record was harvested duringthe 2007-2008 hunting season by TerryCruse in Chickasaw County with an insidespread of 26 5/8 inches. The deer also qualifiedfor the Boone & Crockett Record Bookwith net score of 205 5/8 non-typical. Thesecond widest buck on record was also harvestedduring this season by Brad Scrimpshirein Clarke County with an inside spreadof 26 4/8 inches and a net score of 155 4/8typical.Numerous bucks with gross scores exceeding170 inches were harvested acrossthe entire state this season including nontraditionaltrophy areas such as the pineywoods area of the southeastern region andthe hill country in the northern region. Toview recent and past entries in Magnolia Records and their photosvisit: www.mdwfp.com/level2/wildlife/magnoliarecords/default.asp.Figure 22:MRP Antler ScoreRangeFigure 23:MRP QualifiedDeer by County662007-2008 Mississippi Deer Program Report
Pope and Young Deer Taken in MississippiTable 25. Non-Typical Trophies (Minimum Score 155)RANK SCORE STATUS TAKEN BY SEASON COUNTYRecords1**2345678910236 1/8 1 Tracy Laird 2003-04 Adams204 1 Denver Eshee 1996-97 Webster195 5/8 1 Damon C. Saik 2000-01 Madison187 3/8 2 Angus Catchot 2006-07 Washington178 3/8 2 Wyn Diggs 2006-07 Holmes177 3/8 2 Adam McCurdy 2005-06 Holmes173 3/4 1 Jimmy Riley 2000-01 Adams170 3/8 2 Roger Tankesly 2007-08 Madison165 5/8 1 James Goss, Jr. 1987-88 Washington163 1/4 2 Rich Nichols 2007-08 LeakeTable 26. Typical Trophies (Minimum Score 125)RANK SCORE STATUS TAKEN BY SEASON COUNTY1**2345678910167 2/8 2 Rob Stockett, III 2007-08 Tallahatchie165 6/8 2 Carl Taylor 2004-05 Issaquena164 7/8 1 James House 1999-00 Issaquena160 1/8 1 Odis Hill, Jr. 1989-90 Washington159 6/8 1 Steve Nichols 1986-87 Washington158 4/8 1 John Harvey 1989-90 Adams157 1/8 3 Ryan H. McCarty 2006-07 Clay157 1 James Morris 1998-99 Tunica156 7/8 2 Allen Henry 1993-94 Simpson156 2/8 1 Chris Cordell 1996-97 DeSoto** OFFICIAL STATE RECORD + TIES1 - IN BOWHUNTING RECORDS OF NORTH AMERICAN WHITETAIL <strong>DEER</strong> 3 - OFFICIALLY SCORED AND PENDING2 - OFFICIALLY SCORED AND ACCEPTED 4 - OFFICIALLY SCORED BUT NOT ENTERED2007-2008 Mississippi Deer Program Report67
Boone and Crockett Deer Taken in MississippiRecordsTable 27. Non-Typical Trophies (Minimum Score 195)RANK SCORE STATUS TAKEN BY SEASON COUNTY1 ** 295 6/8 1 Tony Fulton 1994-95 Winston2 225 1 Richard Herring 1988-89 Lowndes3 221 2/8 1 Milton Parrish 1972-73 Holmes4 220 3/8 1 Dean Jones 1976-77 Oktibbeha5 219 6/8 2 Brian Smith 2006-07 Marshall6 219 2/8 1 Matt Woods 1997-98 Hinds7 217 5/8 1 Mark Hathcock 1977-78 Carroll8 216 5/8 4 (Pick up) Matthew Freeny 1989-99 Winston9 212 5/8 2 Stephen McBrayer 2005-06 Pontotoc10 212 1 Wayne Parker 1999-00 Madison11 210 4 (Pick up) Chip Haynes 2000-01 Madison12 209 6/8 1 Ronnie Strickland 1981-82 Franklin13 207 6/8 2 Shelby Tate 2007-08 Amite14 207 3/8 1 Larry Reece 2001-02 Madison15 205 6/8 1 Joe Shurden 1976-77 Lowndes16 205 5/8 2 Terry Cruse 2007-08 Chickasaw17 205 2/8 3 Jimmy Baker 2007-08 Webster18 205 1 (Pick up) Tommy Yateman 1959 Lowndes19 204 1 Denver Eshee 1996-97 Webster20 202 5/8 1 George Galey 1960’S Carroll21 202 4/8 1 William Westmoreland 2001-02 Pontotoc22 + 202 1/8 1 Oliver Lindig 1983-84 Oktibbeha22 + 202 1/8 2 Bobby Smith 1992-93 Tate24 201 6/8 1 Jimmy Ashley 1985-86 Wilkinson25 201 3/8 1 Ray Barrett 2002-03 Washington** OFFICIAL STATE RECORD + TIES1 - IN RECORDS OF NORTH AMERICAN BIG GAME 3 - OFFICIALLY SCORED AND PENDING2 - OFFICIALLY SCORED AND ACCEPTED 4 - OFFICIALLY SCORED BUT NOT ENTERED682007-2008 Mississippi Deer Program Report
Boone and Crockett Deer Taken in MississippiTable 28. Typical Trophies (Minimum Score 170)RANK SCORE STATUS TAKEN BY SEASON COUNTYRecords1 ** 182 7/8 1 Glen Jourdan 1986-87 Noxubee2 182 2/8 1 R. L. Bobo 1955-56 Claiborne3 181 5/8 1 Ronnie Whitaker 1980-81 Wilkinson4 180 4/8 1 W. F. Smith 1968-69 Leflore5 180 2/8 1 Steve Greer 1995-96 Madison6 179 2/8 1 Marlon Stokes 1988-89 Hinds7 178 5/8 1 Grady Robertson 1951-52 Bolivar8 176 6/8 2 Paul Warrington 2007-08 Bolivar9 176 5/8 1 Sidney Sessions 1952-53 Bolivar10 176 1/8 1 J.D. Hood 1972-73 Monroe11 + 175 2/8 1 Johnnie Leake, Jr. 1977-78 Wilkinson11 + 175 2/8 1 Charlie G. Wilson, II 2001-02 Neshoba13 175 2 Kyle Gordon 2005-06 Madison14 + 174 6/8 1 O. P. Gilbert 1960-61 Coahoma14 + 174 6/8 1 Jeremy Boelte 1997-98 Adams16 + 174 1/8 1 William Ladd 1999-00 Noxubee16 + 174 1/8 4 Mike Shell-owner 1940 Warren16 + 174 1/8 1 Bill Walters 1995-96 Coahoma19 173 5/8 1 Geraline Holliman 1982-83 Lowndes20 173 3/8 1 Richard Powell 1994-95 Coahoma21 173 2/8 4 Allen Hunley 2007-08 Hinds22 173 2 Steve Simmons 2007-08 Tallahatchie23 172 5/8 1 Adrian Stallone 1983-84 Adams24 + 172 1 Barry Barnes 2003-04 Yazoo24 + 172 1 Nan Foster New 1977-78 Adams** OFFICIAL STATE RECORD + TIES1 - IN RECORDS OF NORTH AMERICAN BIG GAME 3 - OFFICIALLY SCORED AND PENDING2 - OFFICIALLY SCORED AND ACCEPTED 4 - OFFICIALLY SCORED BUT NOT ENTERED2007-2008 Mississippi Deer Program Report69
In ConclusionConclusionStatusPhoto by Christopher SheaAs in previous reports, data collected from a wide array of sources during the 2007-2008 season continued to indicate a diverse statewidedeer herd. Unique populations continued to exist in all regions of the state. The 2007-2008 season will go down as one of the best everrecorded, from a bumper acorn crop to a new state archery record.Condition data and field habitat evaluations conducted by biologists continued to document the effects of current and long-term overpopulationin some areas of the state. Degradation of deer habitat and noticeable substandard condition indicators such as low reproductionwere prevalent. Many locations in the state have experienced on-going damage of native browse by overpopulation of the deer herd since theearly 1970’s. Deer habitat on poorer soils has been damaged at a greater level than habitat on more fertile soils. In addition, habitat damageon lower fertility soils requires a longer recovery time than on the more fertile soils in regions like the Mississippi Delta. Reduction of deerpopulations to levels where habitat can recover is unacceptable to many hunters. The result has been continued over-use of quality browsespecies by deer.The positive effects of Hurricane Katrina are beginning to be realized. Positive effects of a devastating hurricane are hard to fathom, howeverthere were many beneficial outcomes from the storm. In 2005, access was limited in many areas and hunter man-days and harvestdeclined in southeast Mississippi. Access to these lands was improved prior to the 2006-2007 season, but man-days and harvest did notreturned to pre-Katrina levels. During the 2007-2008 season, access returned to normal, harvest increased, habitat began to recover, andolder deer were harvested.Declines in deer condition and habitat quality have occurred in regions of the state where extensive acreage were converted from agricultureto pine monocultures in the late 1980s. Assorted federal and state incentive programs perpetuated this condition by providing cost-shareopportunities to landowners. The result was an increasing acreage of densely planted plantations of pine on sites with a history of agriculture.Herbicide applications to other pine plantations to prevent competition and thereby eliminating browse plants caused decreased body weightsand reproduction. Minimal amounts of deer forage were found in these sites, which allow only a moderate deer population to cause over-utilizationof the browse that does occur. The result was a poor herd health due to a lack of quality and quantity of native browse plants. However,most of these pine monocultures are at mid-rotation age (14-20 years old). Timber thinning has begun on some of these sites, resulting inadditional browse production because sunlight is reaching the forest floor where it has been lacking in the past. These thinning along withmid-rotation stand improvements (i.e., herbicide application and/or prescribed fire) will drastically improve browse production.702007-2008 Mississippi Deer Program Report
For the fifth year, a tool was offered to landowners and hunting clubs which suffer from extreme overpopulation or whose objective is toreduce total deer numbers. This tool is also effective for the removal of management bucks on above average habitat. Legislation was passedin 2003 allowing the harvest of sub - 4 point bucks by special permit; and was altered to include management bucks in 2005. Landownersor clubs must meet certain requirements, such as cooperating with an approved wildlife biologist and be enrolled in DMAP for a minimumof at least one year to be eligible for these tags. A written justification from the biologist must be approved by the MDWFP Deer Committeebefore management tags will be issued to a property. The biologist recommendations are used to determine the management buck criteriaon individual properties.ConclusionRecommendationsStatewide variance in parameters such as breeding dates, condition indicators, and changes in habitat quality continue to warrant intelligentsite-specific deer management recommendations. Because of the extreme diversity in management needs across the state, landownerscan implement these recommendations only if they are provided with a season framework that offers maximum opportunity or withspecial permits that allow additional opportunity.A liberal antlerless season framework is mandatory if landowners are to meet management goals. Antlerless opportunity should be providedto allow landowners in all regions of the state the opportunity to manage deer populations. Decision makers will receive an increasingnumber of negative reports associated with antlerless hunting opportunity, as behavioral changes in the deer population create changes thatmake deer less visible to hunters. Continued complaints will arise as hunters incorrectly associate decreasing deer populations to antlerlessseason opportunity. These complaints will be more frequent in areas of the state with poor soil quality, previously high deer populations,and/or declining habitat quality.An effective method to monitor statewide harvest on a county basis is needed to take deer management to the next level in Mississippi.Harvest data, which would include sex, harvest method, and county of harvest would provide information from which detailed analyses of thedeer herd could occur. A telephone-based reporting system, which provides this type of information, is currently in use in many states acrossthe Southeast. Harvest data at a county level are instantaneously available to wildlife officials in these states. Voluntary implementation of asimilar, efficient and cost-effective system, known as Tel-Chek, began in 2002, but has been underutilized. A mandatory tagging and reportingsystem like Tel-Chek would provide biologists with much needed data, and law enforcement officers with a new tool to catch violators.Evaluation of the 4-Point Law has led to a recommendation by the MDWFP Deer Committee to eliminate this law. The new proposal is todivide the state into 3 Deer Management Zones and use a minimum spread or main beam length criteria based on local parameters in place ofone statewide point based criteria. The proposal includes recommendations to change the antlerless bag limit from 3 antlerless deer with anyweapon and 2 additional antlerless deer with archery equipment to 5 antlerless deer with any weapon. Additionally, the proposal is to alter the3 buck bag limit to 2 bucks that meet antler criteria and one buck of choice (AKA “Charlie” Buck). This would give the hunter more flexibilityto manage the deer herd on their property.Research funding should continue. Continued advancement of the state deer program hinges on the professional association and interactionwith current deer research projects. The MDWFP Wildlife Technical Staff has benefited professionally from this relationship with MississippiState University for over 20 years. Many of the advances in the management of Mississippi’s deer herd would not have occurred withoutthis relationship. The opportunity to find answers, which address practical management questions, should continue to receive priority.Existing data collection procedures on public and private lands must continue if responsible harvest recommendations for these lands areexpected. Extensive baseline data exists from which objective evaluations can be conducted to examine the effects of changes in habitat, huntingopportunity, and harvest schemes. The annual mail survey will continue to be a valuable tool to monitor trends in a variety of importantcategories.Information and education should remain the top priority of the deer program in Mississippi. Deer management needs are well documentedin most regions of the state. Landowner and hunter understanding, acceptance, and support of sound deer management will continue todetermine the success of deer management in Mississippi. Deer management objectives should be better communicated to the users ofthis resource. Without landowner and hunter support, success is not expected. When provided the freedom, sportsmen in Mississippi haveproven they can make informed decisions that benefit the deer resource if they are provided with the correct management and biologicalinformation.2007-2008 Mississippi Deer Program Report71
Notes722007-2008 Mississippi Deer Program Report
Notes2007-2008 Mississippi Deer Program Report 73
Notes742007-2008 Mississippi Deer Program Report
The MDWFP is an equal opportunity employer and provider of programs and services. If anyone believes they have been subjected to discrimination on the basis of politicalaffiliation, race, color, national origin, marital status, sex, religion, creed, age, or disability, they may file a complaint alleging discrimination with either the MississippiDepartment of Wildlife, Fisheries and Parks, Office of Administrative Services, P.O. Box 451, Jackson, MS 39205-0451, or the U.S. Equal Employment Opportunity Commission,1801 L. Street, N.W. Washington, D.C. 20507.TO:Mississippi Department of Wildlife, Fisheries and ParksP.O. Box 451 | Jackson, Mississippi 39205RETURN POSTAGE GUARANTEEDSTANDARD MAILU.S. PostagePAIDJackson, MSPermit 449POSTMASTER: This package may be opened for inspection if necessary.