Univerzita Komenského v Bratislave - Fakulta matematiky, fyziky a ...
Univerzita Komenského v Bratislave - Fakulta matematiky, fyziky a ...
Univerzita Komenského v Bratislave - Fakulta matematiky, fyziky a ...
- No tags were found...

You also want an ePaper? Increase the reach of your titles
YUMPU automatically turns print PDFs into web optimized ePapers that Google loves.
polyamorphism. I also remark the energy landscape picture of various thermodynamics phasesand review the formation of conventional glasses.2.1 First-principles calculations in condensed matterInmostcondensedmatter calculations, wefocusonthesolution oftime-independentSchrödingerequationforN electrons(coordinates⃗r i )andions(coordinates ⃗ R I andmassesM I ). Intheatomicunits (m e = e = = 1), the equation for the total ionic-electronic wavefunction Ψ tot ({⃗r},{ ⃗ R})is(T I +T e +V II +V eI +V ee)Ψ tot ({⃗r},{ ⃗ R}) = E tot Ψ tot ({⃗r},{ ⃗ R}), (1)where kinetic and potential energy operators have standard form of Coulomb interactions.These electrostatic interactions mix all particle coordinates making the problem extremely difficult.In order to find a solution, the most standard is to use the Born-Oppenheimer approximation[2], which separates the coupled problem into electronic and ionic part. The totalwavefunction is written as product of electronic wavefunction Ψ e ({ ⃗ R},{⃗r}) and ionic wavefunctionΨ I ({ ⃗ R}), which does not depend on ⃗r, leading into two separate equations referred as theelectronic and ionic problem.The electronic equation reads(T e +V eI +V ee)Ψ e,k ({ ⃗ R},{⃗r}) = E e,k ({ ⃗ R})Ψ e,k ({ ⃗ R},{⃗r}), (2)where E e,k ( ⃗ R) is energy of electrons and electron-ion interactions in a quantum state k. Theionic positions ⃗ R play role of external parameters here. The remaining equation for moving ionsis(T I +V eff ({ R}) ⃗ )Ψ I ({ R}) ⃗ = E tot Ψ I ({ R}), ⃗ (3)V eff ({ ⃗ R}) = V II +E e,k ({ ⃗ R}), (4)and can besolved once we know the electronic solution. V eff ({ R}) ⃗ denotes the total effectivepotential felt by ions.Electron repulsion leading to correlation effects makes eq. 2 still extremely difficult to solveand many methods of different accuracy were developed to treat it. Ab initio methods refer tothose approximative solutions that are based on laws of quantum mechanics. Most standardchemical physics methods include Hartree-Fock (HF) and set of post-Hartree-Fock approximations,with the most accurate one being the configuration interaction. The HF method approximateselectron wavefunction with a single Slater determinant thus considering exact exchangeterm, but no correlation effects, while post-HF methods generally take more determinants intoaccount to treat correlation. A rather different approach is employed in the density functionaltheory (DFT), which uses as basic variable only electron density [3]. In DFT, exchange and correlationenergyarebothapproximated byexchange-correlation (XC) potential beingafunctionalof density.3
2.1.1 Density functional theory and the electronic problemDFT is method for determination of ground-state electron density n 0 (⃗r) and energy E 0 for givenionic positions and number of electrons N. Hohenberg and Kohn [4] proved that all propertiesof the ground state are uniquely determined by the ground-state density, which can be foundfrom variational principle by minimizing the appropriate energy functional.The most common practical approach to the solution of the DFT minimization problem isbased on auxiliary system of non-interacting electrons generating same ground-state density asthe true interacting system [5]. The corresponding self-consistent Kohn-Sham (KS) equationsfor one-particle KS orbitals φ i,σ (⃗r) and their energies ǫ i,σ(− 1 )2 ∆+vσ KS[n ↑ (⃗r),n ↓ (⃗r)](⃗r) φ i,σ (⃗r) = ǫ i,σ φ i,σ (⃗r) (5)generate correct ground-state density of interacting system given by ground state of KSorbitalsn(⃗r) = n ↑ (⃗r)+n ↓ (⃗r) =N∑|φ i,σ | 2 . (6)The KS method describes many-electron system by effective one-particle KS potential thatconsists of external potential v ext (⃗r), averaged potential of other electrons (Hartree potential)u Hartree [n(⃗r)](⃗r) and exchange-correlation potential v σ xc[n ↑ (⃗r),n ↓ (⃗r)](⃗r) that readi,σvKS σ [n ↑(⃗r),n ↓ (⃗r)](⃗r) = v ext (⃗r)+u Hartree [n(⃗r)](⃗r)+v xc σ [n ↑(⃗r),n ↓ (⃗r)](⃗r), (7)v ext (⃗r) = − ∑ Z II| R ⃗ I −⃗r| , (8)∫n( ru Hartree [n(⃗r)](⃗r) =⃗′ )|⃗r −r ⃗′ | d3 r ⃗ ′ , (9)v σ xc [n ↑(⃗r),n ↓ (⃗r)](⃗r) := δE xc[n ↑ (⃗r),n ↓ (⃗r)]δn σ (⃗r)with all of them being functionals of electron density that reversely depends on the orbitals.Theexternal and Hartree potentials are in HF and DFT essentially the sameand main differenceis that in DFT both exchange and correlation effects are taken approximately.The XC potential function is defined formally as functional derivative of the XC energyfunctional E xc [n ↑ (⃗r),n ↓ (⃗r)] by spin density n σ (⃗r). XC energy is defined as sum of exchange andcorrelation energy E xc = E x +E c and though it represents only a few percent of total energy,E x together with E c are responsible for chemical bonding. E x is defined as energy differencebetween Hartree product and single Slater determinant constructed from one-particle orbitalsand so is based on antisymmetrization of fermion wavefunction of spin 1/2 electrons. In the KStheory, E x := 〈Φ S |V ee |Φ S 〉−U[n(⃗r)].Correlation energy is defined as the entire remaining energy difference between exact energyof a proper wavefunction |Ψ〉 and total Hartree-Fock energy of a single Slater determinant (withexchange effects included) and in KS DFT is given by E c := 〈Ψ|T e +V ee |Ψ〉−〈Φ S |T e +V ee |Φ S 〉.(10)4
Correlation energy holds E c ≤ 0 and so it plays role of solid-state physics ”gluon” that bindsatoms and molecules together.Estimation of XC energy is of crucial importance in DFT, where its two parts are usuallytreated together by E xc [n(⃗r)] functional that is estimated numerically from theknown propertiesof homgenous electron gas (HEG) tabulated from accurate quantum Monte Carlo calculations.For slowly-varying density systems, local density approximations have been found very useful,but for general systems with more rapid density fluctuations and spin polarization, generalizedgradient approximations (GGA) are used∫Exc GGA [n ↑ (⃗r),n ↓ (⃗r)] =(n ↑ (⃗r)+n ↓ (⃗r))f xc [n ↑ (⃗r),n ↓ (⃗r), ⃗ ∇n ↑ (⃗r), ⃗ ∇n ↓ (⃗r)]d 3 ⃗r, (11)where f xc [n ↑ (⃗r),n ↓ (⃗r), ∇n ⃗ ↑ (⃗r), ∇n ⃗ ↓ (⃗r)] is an arbitrary function of spin-polarized densitiesand their gradients that approximate E xc based on known HEG values of ǫ ↑↓HEGxc [n ↑ ,n ↓ ] and∂ nσ ǫ ↑↓HEGxc [n ↑ ,n ↓ ]. Perhaps the most popular parametrization of GGA comes from the Perdew-Burke-Erzenhof (PBE) construction [6] widely used in physics and chemistry.Almost all practical calculations of the KS equations are performed in periodic environment(including amorphous states and even isolated clusters). The KS orbitals are then writtenaccording to Bloch theorem as plane waves modified by periodic functions u ⃗k (⃗r), which can beexpressed by a special plane-wave subset e (⃗ k+ ⃗ K).⃗r consisting of reciprocal ⃗ K vectors. The KSorbitals are according to Born-von Karman conditions indexed by ( ⃗ k,n), where ⃗ k is a discretemomentum point from the first Brillouin zone and n is the band index.KS orbitals must be found iteratively by expansion in some basis set with plane-wave basisbeing the most widely used. Transforming the KS equations to reciprocal space gives equationsfor the coefficients of linear combinations c ⃗k+ of plane waves forming each KS orbital⃗K,n∑v KS⃗K, K ⃗′(⃗ k)c ⃗k+ K,n ⃗ = ǫ ⃗k,n c ⃗k+ K,n ⃗ (12)⃗K ′thatarefoundbydiagonalizingthev KS⃗K, ⃗ K ′(⃗ k)matrixinthereciprocalspace[7]. Thenumberofplanewaves usedby computer is constrained by cutoff energy E cut that together with thevolumeV of the simulation box (supercell) determines number of the plane waves used - N pw ∼ VE 3/2cut ,which is typically from tens to hundreds of plane waves for one KS orbital.The KS potential (eq. 7) depends on electron density and so the KS equations must besolved iteratively until self-consistency. This requires some initial guess for density for whichusually sum of single atom densities solved within the KS method with spherically symmetricpotential are taken.The plane-wave treatment of the KS equations cannot be in most practical cases applied forall electrons in the system as far as computational time to converge one electronic loop growsroughly with N 2 . Fortunately, it is a common property of chemistry that electrons can be wellseparated to inert core electrons that behave as frozen around the nuclei and the only chemicallyactive valence electrons. This enables to avoid full-electron calculations in ab initio study, butthe interactions between ions and valence electrons cannot be straightforwardly addressed to theCoulomb −Z I /r potential. Theproblem arises from stronginteraction between valence electronsand ionic centers diverging for small r leading to rapid oscillations of valence wavefunctions that5
need to be described by a fairly large number of plane waves. To avoid oscillations and also toinclude core-valence repulsion, a description of ions by pseudopotentials (PP) is usually applied.The concept of PP is based on separation of external ion-electron potential into Coulombicpart beyond some cutoff radius and a different better-describing part below it. The most simpleway how to construct an individual ionic PP is some empirical model, but more realistic is abinitio construction that compares true all-electron wavefunctions and wavefunctions calculatedfromthedesiredPP.OneofthemostimportantpropertiesofPPistransferabilitythatrepresentsthe ability of a pseudopotential to provide results with similar accuracy in various chemicalenvironments. Widely used smooth PPs that exhibit very good transferability properties areknown as Vanderbilt ultrasoft pseudopotentials [8].There is one important technique that highly improves the plane-wave PP method by use ofhybridalbasis set of localized atomic orbitals andplanewaves in agreater ”all-electron” concept.This method is known as the projector-augmented wave (PAW) method [9] and it was developedto better describe valence electrons in the regions close to cores. Plane-wave pseudopotentialmethod and PAW generalization are nowadays the most widely used computer implementationof the KS approach to DFT for study of solids and liquids including the most popular softwareslike VASP [10] and CPMD [11], which we have used in our work on sulfur and carbon dioxide.2.1.2 Molecular dynamics and the ionic problemOnce the electronic problem is solved in some approximation, we have immediate access tosystem energy characteristics, electron density, types of intra and intermolecular bonds, bandstructure, etc. In order to obtain other properties of system associated with behavior of ions,like structure at various conditions (phase diagrams), mechanisms of transformations, heat andelectricity conduction properties, electromagnetic and superconducting properties as well aselastic constants and dynamics of lattice, further static and dynamic calculations are to becarried out.The most natural way to investigate physical system in time is known as molecular dynamics(MD). MD is based on straightforward integration of Newton’s equation of motion in a discretemanner. Practical implementation in most MD computer codes is the velocity Verlet algorithm[12] with central difference approximation for acceleration term. Initial velocities for particlesare usually taken from the Maxwell-Boltzmann distribution at desired temperature.MD can be used in classical or quantum way and even by combination of both. Classicaltreatment essentially means use of some classical potential model for atoms and molecules asfunction of positions and rotational and torsion angles (for molecules). The idea of ab initio MDrelies on separation of ionic and electronic time scales, where ions move slowly enough to enableelectrons to immediately react and adapt to current ionic positions and the adiabatic theoremis assumed to maintain that electrons remain in their actual ground state.Forces ⃗F I acting on ions are calculated as derivatives of the ionic effective potential V effapplying the Hellman-Feynman theorem to obtain the force theorem⃗F I = − ∂V eff({ R}) ⃗ ∫∂R ⃗ =In(⃗r) Z I(⃗r − ⃗ R I )|⃗r − ⃗ R I | 3 d3 ⃗r + ∑ I,JZ I Z J ( ⃗ R I − ⃗ R J )| ⃗ R I − ⃗ R J | 3 . (13)6
Ions are then moved according to the forces like in the classical MD and so are also in abinitio MD treated ”classically”, in a sense that they always occupy sharp positions ⃗ R I (t) andnot a QM state.MS simulations of infinite (bulk) systems require use of periodic boundary conditions (PBC)applied on the simulation supercell. PBC assume a periodic array of ions moving as the calculatedsupercell ions and every time some ion is moved outside from the simulation box, one ofits periodic images is inserted to the corresponding location. In case of small systems, where noperiodicity is physically present, PBC can be applied as well by placing particles into supercellthat is large enough to maintain negligible interactions between the images.Great advantage of MD is that it essentially includes all phenomena associated with ”chaotically”moving particles, like finite-temperature entropy effects, diffusion, anharmonic oscillations,etc. MD performed in a proper ensemble in principle includes all types of fluctuations andtherefore chemical reactions and phase transitions are not suppressed as in static ionic calculations.Another strong feature of MD is that by generating particle trajectories, all microscopicmechanisms occurring in system can be studied in full detail.Some of the system characteristics like ideal structure, phonon modes, equations of states(EOS) for thermodynamical quantities, elastic properties and various response functions can bestudied also by static ionic calculations. To find ideal crystal structure and cell parameters atzero temperature, structural (geometric) optimization procedure is employed that leads actualsystem state into a nearest energy minimum. Optimizing enthalpy H = E + PV instead ofenergy, we can find equilibrium structure also at given pressure and obtain EOS for H(P) forvarious structures that compete in enthalpy minimization. This provides information on idealzero-temperature phase diagram that usually quite well copies true phase boundaries at lowtemperatures.Phonon modes can be found in the harmonic approximation by calculating of dynamicalmatrix elements coming from hessian of V eff . Determination of phonon frequencies can serveseveral purposes, like it allows to check for mechanical stability of a given structure, uncoversmolecular vibrations and rotations and types of bonds, provides general picture about typicaloscillations in the system and the IR and Raman spectra can be calculated and comparedto experiments. Tracking evolution of the phonon modes may also identify onset of a phasetransition. Phonon spectrum also gives estimation of free energy and entropy because phononfrequencies automatically provide information on system energy levels and hence determine thepartition function Z = ∑ i exp(−E ikT), which further brings expressions for mean vibrational freeenergy 〈F〉 viband vibrational entropy S vib at given temperature.Some of other static ionic methods have also power of predicting stable crystal structuresincludingMonte Carlosimulations, simulated annealing, minimahopping[13] andmost ofall thegenetic algorithm [14] that is perhaps the most sucesfull method for predicting crystal structureat zero temperature available today.Most of the world we experience every day can be in language of statistical physics welldescribed by constant pressure-temperature (NPT) ensemble. For that reason, prediction ofstable crystalline phases of material under NPT conditions is known as the crystal structureprediction (CSP) and at finite temperature [15], MD simulations present the most suitablemethod for solving the CSP problem. It is therefore of high interest to perform MD in NPT7
environment.As far as the Newton’s equations are energy-conserving, straightforward use of MD andforce theorem samples microcanonical ensemble, and so additional techniques that simulatethermostat and barostat are needed. The most used barostat that provides correct averages(but not fluctuations) is the Berendsen barostat [16]. In the anisotropic version appropriate forcrystals, it works by rescaling the cell vectors h = (⃗a, ⃗ b,⃗c), atomic positions ⃗ R i and velocities ⃗v iby the scaling matrix µ according to difference of predescribed external stress tensor P ext andinstantaneous internal stress P int followingh → µh, Ri ⃗ → µ R ⃗ i , ⃗v i → µ⃗v i , (14)µ = 1− β∆t (P ext −P int ),3τ P(15)where β is bulk modulus of system, ∆t is MD timestep and τ P is relaxation time scale.We used this idea of Berendsen barostat in our simulations and implemented it to simulationsperformed with VASP package, which is originally written only for constant-volume simulations.Thequantum-mechanical stress tensor P qintthat needs to be evaluated for barostat and otherreasons can be obtained from the expression [17](P qint )αβ = NkT/〈V〉δ αβ − 12V∑〈Ψ|(⃗r ij ) α ( ∇ ⃗ ij (U(r ij ))) β |Ψ〉, (16)ijwhere ⃗r i and U are operators whose expectation values must be evaluated at the instantaneousquantum state |Ψ〉.The most common problem confronted in almost all computer simulations involving largernumber of particles that is especially constraining in ab initio simulations is the time scaleproblem. In first-principles calculations follows from fact that times needed to find electrondensity scale roughly as N 2 that enables to simulate only maximum of hundreds of picoseconds.This prevents some of the possible transitions to occur, especially when corresponding energybarriers are too high in respect to thermal fluctuations kT ≪ ∆E (kinetic hindrance). The mostpowerful method developed to overcome this problem is the metadynamics algorithm [18].2.2 Amorphous materials and high pressure2.2.1 Energy landscape picture and configuration enthropyVery instructive description of distinct system phases and transitions between them is providedbyenergy landscapepicture[19, 20, 21, 22], whichrepresents thepotential energy surface(ES)ofa system plotted on configuration space of interacting particles. ES is an extremely complicatedfunctionofhighdimensionthat contains vast numberof distinctmaxima, saddlepointsandmostimportantofall -local minimacorrespondingtolocal stableorganizations ofsystemcomponents.These can be either perfect crystalline structures, but more often some polycrystallites anddefective versions of crystals and also amorphous packings. Typical ES is depicted on Fig. 2.2.1with graphical representation of different solid and liquid phases.The global minimum (a) on ES corresponds to the most stable crystal structure C1 realized8
Figure 1: ES of system and its condensed phases: (a) global minimum - the most stable crystalstructure C1, (b) local minimum - higher-energy crystal structure C2, (c) local minima- defective crystalline and polycrystalline packings of C1, (d) and (e) amorphous minima A1and A2 corresponding to crystals C1 and C2, (f) liquid-like minima - liquid phase L1 and itscorresponding glasses G1 and analogically (g) - L2 and G2.at zero temperature. Another deep local minimum (b) corresponds to less stable crystal C2.Minima surrounding C1 in its basin of attraction (c) correspond to structures with presenceof defects and to polycrystalline forms of the corresponding crystal. As one moves away fromperfect crystalline minima, the defectiveness grows and polycrystalline scale shrinks and theminimabecometocorrespondtoamorphouspackings asA1forC1-(d)or A2forC2-(e). Theseminima have disordered character but share some properties with their crystalline counterpartskeeping same short-range order - and hence representing their amorphous versions. This can bepresent in shapes of radial distribution function (RDF) or values of coordination numbers, whileangulardistributionfunction(ADF) is typically much broaderforamorphousforms. Amorphousphases that are connected to liquids are known as glasses - (f) and (g).For practical reasons concerning definition of entropy of certain system state, it is suitableto split the motion of a system in two parts [20]. One is the discrete motion between adjacentlocal minima and second is the vibrational motion inside these minima. This idea also dividesentropy of certain state into configuration and vibrational partS = S vib +kln(Ω(E min )), (17)9
where S vib is mean vibrational entropy of local minima and second term is the configurationentropy S conf directly proportional to Ω(E min ) - that is the number of local minima with samevalue of their minimal value - E min . Concept of configuration entropy is very important fordisordered states stability considerations.2.2.2 Glasses and glass transitionGlasses are known since ancient times to form by fast cooling of melts in the phenomenonknown as glass transition, which is principally based on system non-ergodicity. Starting froma liquid phase - (f) and (g) on Fig. 2.2.1 and lowering the temperature, system is directed tominimize its internal energy (or enthalpy), but as temperature falls, fluctuations also becomesmaller, viscosity increases [23] and if the cooling is rapid enough, system fails to find a passageleading to lower energy regions of crystalline attraction basins. As cooling continues, at sometemperature - glass transition temperature T g , supercooled liquid freezes in some high-energyminimum of a disordered state and remains trapped oscillating around some local amorphousarrangement. For that reason, not only the glass transition, but also the existence of glass phaseitself is a dynamical phenomenon.Glass transition is not a thermodynamical phase transition, because T g as well as the exactfinal glassy state both depend on the cooling rate [22] as there are number of local high-energyminimaof a certain megabasin that represent glass/liquid. After the glass transition is complete,the microscopic glass structure is very similar to that of the liquid phase following directlyfrom the ES description of the glass transition. The entire process includes many effects andmechanisms still not completely understood, like dynamical heterogenity, strong and fragileglass formers, non-Arrhenius behavior, breakdown of the Stokes-Einstein equation, existenceof Kauzmann temperature [24] and Kauzmann paradox (the entropy crisis), thermodynamicalconcept of ideal glass, rheology and aging and many more [19, 21, 22, 25, 23].2.2.3 Pressure-induced amorphizationThe most dramatic effect induced by pressure are structural transformations. Besides crystalcrystaltransformation between two different polymorphs, also pressure-induced amorphization(PIA) or even amorphous-amorphous transition (AAT) are known to occur and leading to creationof phases with potentially technological interest, like amorphous semiconductors, metallicalloys or extremely hard materials.The phenomenon of PIA (reviews [26, 27]) of a solid state as a new way to make amorphousmaterials was first observed in compressed ice [28] and since then was observed in a numberof most common and important materials including SiO 2 [29], CO 2 [30], Si [31], S [32] or N[33]. The resulting amorphous form is known as a pressure glass - p-glass to distinguish it fromquenched q-glass. Amorphization from both molecular and extended crystals were observed forall kinds of intermolecular bonding and by now, nearly a hundred compounds were reported toexhibit PIA [27]. The nature as well as mechanism of PIA have been disputed and extensivelydiscussed since its first observation. The discussion concerns questions about thermodynamicalbackground of PIA, connection of p-glass to crystal or liquid, exact PIA mechanism, order ofthe transitions, reversibility, etc.10
It was recognized that PIA amorphs generally differ from quenched glasses by exhibitingsome short-range crystal properties [27] and higher densities than the same P-T positionedglasses [34]. Creation of memory glasses, where PIA amorphs preserve memory of their initialcrystallographic orientation were also observed - for the first time in AlPO 4 [35].PIAwas firstassociated with crossingof thelow-temperatureextrapolation of themetastablemelting line in H 2 O and then also in SiO 2 [29] and Si [31]. On the other side, in many differentcases PIA occurred in the vicinity of thermodynamical crystal-crystal boundary and it wasconcluded that there is no systematic behavior concerning this problem [36]. The first optionbrought the idea of thermodynamical (cold or metastable) melting, in which system melts belowits T g transiting between two metastable phases in a first-order transition, while differentmodel called mechanical melting is based on a catastrophic collapse of structure, which cannotwithstand further change of conditions and loses stability in a spinodal decomposition.For the mechanism of PIA, various scenarios were proposed as well. In XRD experiments,it is commonly observed that x-ray diffraction peaks become increasingly worse that indicatesgradual increase of the number of defects in structures. PIA is hence often progressing aroundstructural imperfections that play role of nucleation centers for disordering, which is usuallyassociated with irreversible thermodynamical melting.One of the most common model for mechanical melting is based on famous Born criteria[37] (rules for crystal stability in form of inequalities between elastic constants c ij ) that wereoriginally developed to model melting, but their breakdown was observed also in the vicinity ofPIA, as first predicted for SiO 2 [38] and first time directly observed in ice [36]. Another model ofPIA mechanism is dynamical lattice instability associated with structural collapse due to somephonon mode softening, as first time observed in the vicinity of PIA (and of AAT as well) incompressed hexagonal ice [36]. This was often attributed to structure approaching its spinodalboundary, hence to mechanical melting scenario as well.Mechanism of PIA is also related to some specific material type. The most typical exampleis case of molecular crystals, like water, carbonia, sulfuror nitrogen. In molecular crystals at lowpressures, distances between molecules are much larger than bond lengths and PIA is commonlyobserved when large overpressurization brings them closer and the intermolecular forces becomecomparable to the intramolecular ones. We observed this effect in our work on PIA of sulfuras well [1]. Tetrahedral materials are another important specific category, because the buildingblocks of tetrahedraareunableto fill thespace, buttheir noncrystallographicpacking can reducethe volume and stabilize the amorphous form. It was also referred that compounds exhibitingnegative thermal expansion often exhibit PIA [27].The order of the PIA transition also does not exhibit a strict character, though in majorityof the referred cases PIA shows many properties of first-order transitions, like large volumereduction and abrupt changes in mechanical and electrical properties. PIA was found to bereversible as well as irreversible and also strongly temperature-dependent, as far as mechanismstypical for thermodynamic melting and for mechanical melting were both observed in the samematerials at different temperature - e.g. in water [39].11
2.2.4 Amorphous-amorphous transitionPolyamorphism is a direct analogue to polymorphism and means that one solid substance mayexist in more amorphous forms that are well-distinguishable (reviews [40, 41, 42]). Such amorphousforms differ most typically in density and great majority of polyamorphism examples referto low density amorphous (LDA) and high density amorphous (HDA) forms. Polyamorphismwas first observed also in compressed ice [43] and since then has been studied in a number ofother common elements and compounds including Si [31], Ge [44], C [45], SiO 2 [46], CO 2 [30],GeO 2 [47], and many others.The phenomenon of AAT is in much similar to PIA, including all disputation and problemsconcerning the thermodynamics and mechanism of the transition. The AAT was attributedto be thermodynamically connected to higher temperature low density liquid (LDL) to highdensity liquid (HDL) transformation and also to stable crystal-crystal transition. Accordingly,the distinct amorphous forms were considered to be connected to their corresponding liquidstates or to crystalline phases.Various amorphous forms differ in structural properties, like RDF, ADF and N C , sometimesgreatly (with different bond network - molecular and non-molecular forms), and sometimescontinuously when a large number of intermediate states exists between two forms. Transitionsof the former case are usually associated with a first-order phase transition, while the latterexhibitgradualchanges thatoften cannot beassociated even withasecond-ordertransition. Themost typical example of the second case is gradually changing structure with some progressivelyvarying atomic coordination, like in case of intermediate states between fourfold tetrahedral andsixfold octahedral glass polyamorphs of GeO 2 [48] and also between three and four-coordinatedsolid amorphous CO 2 that we observed in our simulations.Polyamorphism was originally associated with underlying liquid-liquid transition (LLT) inwater[43]andacontinuity betweenthestableLDL-HDLthermodynamiclineandtheLDA-HDAkinetic line was suggested. First simulation evidence of a stable first-order LLT was proposed tooccur in liquid carbon [49] between predominantly sp-bonded LDL form and mostly sp 3 -bondedHDL form. First empirical evidence of such transition was obtained in liquid phosphorus [50].Sulfur has been also found to undergo a first-order LLT [51] from insulating liquid formed byS 8 molecules into a metallic liquid state of polymeric fragments proceeding via ring-openingpolymerization [52]. Hypothesis of the LDL-HDL background process behind the AAT wasmost extensively studied in water (review [53]) and also in silicon [31, 54]. On the other side,LDA and HDA forms were reported to possess properties similar to low and high pressurestable crystal phases and the AAT was supposed to be a metastable analogue of crystal-crystaltransformation, e.g. in sulfur [55].AATs have been reported to proceed abruptly as well as continuously or gradually aboutequally often. Relatively clear evidence of first-order nature of AAT transition based on observationof sharpchanges of density, structureor dynamical character werereferred inH 2 O[43], SiO 2[56], Si [54], Ge [44], S [55] and CO 2 [30] and on the other side, gradual changes were observedin materials including SiO 2 [46], GeO 2 [48], C [45], etc. This second class of cases can be definitelyextended also with CO 2 , where our simulation results showed a continuous change in theamount of three and four-coordinated carbon atoms between fully three and four-coordinated12
amorphous forms (not with the molecular to non-molecular AAT in CO 2 ). SiO 2 was reportedboth as a first-order and as a gradual-type transition and hence the role of temperature on AATtransition has been extensively discussed for SiO 2 [56] and GeO 2 [57], where a so-called pressurewindow was identified in which gradual and reversible changes took place and after heating asharp transition was obtained instead.3 Applications and resultsIn the following section, I summarize our simulation results on PIA and AAT observed in sulfurandcarbon dioxide - simulation methodsand pathways and results that are both completely newand comparative to experimental data. This includes observation of a new phase of monoclinicmolecular sulfur and detailed molecular description of the amorphization mechanism publishedin Physical review B [1] and preliminary results on PIA and AAT investigation in CO 2 .3.1 SulfurSulfur is one of the most common and important elements in the Universe, on Earth and inalmost all life we know being one the six major biogenic elements. Sulfur is 16th element in theperiodic table placed in group VIb with chemically active s 2 p 4 valence shells. Sulfur at ambientconditions forms covalent molecular crystals that polymerize at rising pressure. Allotropy ofsulfur at high pressures and temperatures belongs to the most complicated and interesting onesfoundamongthepureelements andat least ten different stable crystal structureswere identified.3.1.1 Crystalline and amorphous sulfur at high pressuresThemost stablecrystal structureof sulfurat ambient conditions is phaseS-I whichis remarkeblycomplicated consisting out of 16 S 8 molecules (128 atoms) in theunit cell [58]. Thehigh-pressureregion of phasediagram exhibits continual densification and metallization. Onpressureincrease,S-I transforms to S-II and further to S-III. S-II and S-III are made of polymeric molecules oftriangular and squared-shaped chains [59, 60]. At higher pressures, sulfur transforms into phaseS-IV, which possesses aperiodic (incommensurate) modulation [61] and then to phase S-V witheven higher pressure phases being only predicted by computer simulations [62]. Starting fromthe phase IV, sulfur starts to exhibit metallic and superconducting behavior [63, 64].Moltensulfuruponrisingtemperatureundergoesafirst-orderLLTλ-transition[65]leadingtopolymeric phase that can be quenched to glass of helical sulfuric chains. Synthesis of amorphoussulfur by PIA was reported in Ref. [32] and recently also the phenomenon of polyamorphismwas observed [55]. Experiments indicated that before PIA the structure undergoes substantialchanges representing progressive creation of defects or some other structural changes. Thereported LDA-HDA polyamorphic transition in sulfur [55] suggested that LDA and HDA formscorrespond to their crystalline counterparts, namely to polymeric S-III and extended metallicS-IV.13
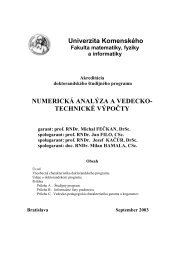
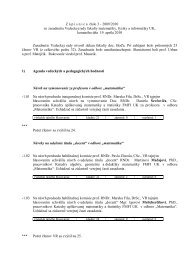
Figure 2: Comparison of type A - a)-c) and type B - d)-f) molecules generated by Jmol. [66]3.1.2 Simulation methods, results and discussionTo perform most of our ab initio MD simulations we used the VASP package [10]. Since VASPdoes not have implemented any barostat for MD, to simulate system under constant pressurewe adopted the idea based on the Berendsen barostat [16] and implemented it to VASP byperforming vectors rescaling according to eqs. 14 and 15. The published results were performedon a sample of 512 atoms in a 2 × 2 × 1 supercell of initial S-I structure in a PAW schemeof plane-wave treatment (cutoff 360 eV) of KS orbitals with the PBE GGA functional for XCenergy used [6].We started the simulations from optimized S-I structure at 0 GPa by heating it to roomtemperature and then started to increase pressure in 10 GPa steps at 300 K. At 20 GPa, weobserved a transition into a new molecular phase (denoted m-S) with monoclinic lattice formedby S 8 molecules with two different conformations in the same amount. First molecular type wasthe most common eight-atomic puckered D 4d isomer with shape of crown [58] (type A) and thesecond originated by deformation of type A to lower C 2 symmetry (type B). Shape of type Aand type B molecules is shown in Fig. 2. In order to investigate relative stability of m-S inrespect to other crystalline phases, we calculated their EOS of enthalpy over pressure - shownon Fig. 4.On further pressure increase we observed amorphization at 40 GPa in very good agreementwith experiments [32, 55], but we did not observe any significant jump in density that couldbe associated with the LDA to HDA transition. However, authors of the experiments [55] alsoadmitted possibility that LDA and HDA forms they observed were in facts nanocrystallites. Thecrystal-to-amorphous form transition at 40 GPa was accompanied by relatively sharp increase ofdensity perhapsindicatingafirst-ordernatureof thetransition as suggested [55]. Amorphizationwas also accompanied by metallization.In order to investigate the PIA mechanism, we focused on tracking the evolution of intraand intermolecular distances before and during PIA. Compression of m-S leads to considerable14
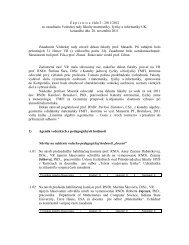
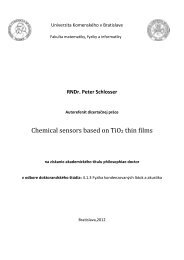
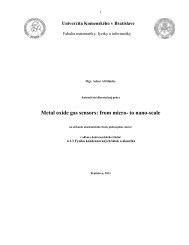
Number of counts [arbitrary units]201816141210864Inter-distances - 10 GPa20 GPa30 GPa40 GPa - m-SIntra-distances - 10 GPa20 GPa30 GPa40 GPa - m-S21.8 2 2.2 2.4 2.6 2.8 3 3.2 3.4 3.6 3.8 4intra/inter-molecular distance [Å]Figure 3: Comparison of bond length and nearest intermolecular distance distributions in S-Iat 10 GPa and in m-S at 20-40 GPa. The structure of m-S becomes unstable at 40 GPa, wherethe two distributions start to overlap. The structure of m-S at 40 GPa contains some bondsbetween different molecules (defects) that are represented by the small peak around the sulfurcovalent diameter of 2.04 Å.decrease in intermolecular space, while the intramolecular bond lengths remain practically unchanged.In Fig. 3 we show the distributions of the nearest neighbor (n.n.) intramolecular bondlengths and the nearest intermolecular distances in S-I and m-S at pressures from 10 to 40 GPa.At pressures up to 30 GPa the two distributions are clearly separated and the molecularphase persists. At 40 GPa, the intermolecular distribution develops a small peak located aroundthe sulfur bond length representing the existence of structural defects in m-S, but even withoutthe existence of these defects, the figure reveals that at 40 GPa molecules interact strongly andtheir intra and interdistance distributions start to overlap. This suggests that PIA is likely to beprimarily driven by the overlap of these two distributions, similarly to other cases of molecularto non-molecular transformations in crystals.In order to further clarify the amorphization transformation, we studed interactions betweentype A and type B molecules separately from the evolution of the number of intramolecular distanceslonger than 2.15 Åfor A and B molecules separately and of the number of intermoleculardistances shorter than 2.2 Å(close intermolecular approachings) for A-A, B-B and A-B pairsseparately. We found that type B molecules are more involved in the early stages of amorphizationas expected, as far as their intramolecular bond lengths are always somewhat greater thanare in A molecules pointing to fact that they are more likely to develop bond breaking. This15
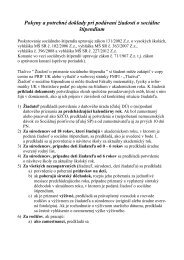
0.60.40.2S-IS-IIS-IIImodulated bcm S (approx. by commensurate z-modulation)m-Striclinic S (cubic at 90 GPa)ladder S (triclinic at 100 GPa)∆ H [eV]0-0.2-0.40 10 20 30 40 50 60 70 80 90 100Pressure [GPa]Figure 4: Enthalpies of sulfur phases S-II (red up triangles), S-III (green squares), modulatedbcm phase S-IV (approximated by commensurate modulation - violet down triangles), m-S(light blue circles), triclinic S (dark blue squares) and ladder S (yellow diamonds) relative toS-I (straight black line) according to calculated EOS. The discontinuities at the endings of thetriclinic and ladder curves are caused by structural transformations that took place directlyduring the optimization algorithm.is confirmed by recogninition that B-B molecular mixing starts to grow first when amorphizationstarts. It can be hence concluded that molecular disintegration process is not distributeduniformly between all system components, but the role played by the A and B molecules isdifferent.Next we analyzed the properties of a-S and its correspondenceto the experimental LDA formand to its possible crystalline counterpart. We observed that a-S corresponds quite well to theLDAform[55]accordingtotheresemblancebetweentheirRDFsandbasedonagreement oftheirdensities and also the coordination number N C . Structural relation of a-S to crystal phase S-IIIwas proposed in the experiment [55] based on the comparison of their density and coordinationnumber and also from the positions of these forms on the phase diagram. Regarding to thisproblem, we investigated the same properties and concluded that (based on these parameters)our observed a-S could be structurally as well related to it parent phase m-S, and so we cannotstate any clear a-S to crystalline phase correspondence.Minor parts of our simulations were performed by the same methods on smaller sample of128 atoms (one S-I unit cell) and on the same small sample by CPMD [11]. In both simulations,besides amorphization and m-S structure, we also observed recrystallization of a-S into a simpletriclinic structure (one sulfuric atom per cell) which in VASP further transformed to different16
”ladder-type” structure. These results have been not published since they need to be confirmedby larger scale simulations.We performed enthalpy calculations shown in Fig. 4 in order to determine relative stabilityof the obtained simple triclinic and ladder structures and particularly of the crystalline m-S,in respect to four stable sulfur phases I-IV. We found that m-S is more stable than S-I above29 GPa and that the triclinic and ladder structures also become more stable than molecularstructures at higher pressures. This proves their relative stability and opens a possibility thatunder certain conditions these two newly predicted phases could be stable.3.2 Carbon dioxideCarbon dioxide is very common substance and one of the most important materials found in theEarth’s atmosphere and interior, in the Solar system and beyond. It is a dominant componentof atmospheres of Mars and Venus and can be found in form of dry ice on surfaces of many otherterrestrial objects. High pressure solid CO 2 is very important in geophysics, particularly for itplays an important role in rheological weakening of rocks with consequences for seismic activitiesand plate tectonics - as new experiments [67] suggested that polymeric CO 2 -V can be stablenear the top of the lower mantle and then dissociate into diamond and fluid oxygen. Presenceof CO 2 in planetary interiors is thereafter important in planetary sciences as it can explaindifferences in dynamics of the Earth and other planets [68]. Significant amount of polymeric, oreven amorphous CO 2 is expected to be present also in deep interiors of giant gaseous planets.Compoundscontaing amorphousCO 2 areconsideredforvery perspectivetechnological materialsfor their possible extreme hardness.3.2.1 Solid phases of CO 2Thermodynamic phase diagram of CO 2 was a matter of much debate concerning the exactstructure and stability of possibly ten distinct crystal phases and the overall consistent pictureof CO 2 phases became to emerge only recently based on newest data. Low pressure-temperaturesolid CO 2 phase I, commonly known as dry ice, is a typical soft molecular solid with linearmolecules. This phase transforms into CO 2 -III, which is layered with all molecules set in planes.Molecular phase III then upon rising pressure undergoes a chemical reaction associated withsp to sp 3 hybridization, when it transforms to phase V [69, 70], which is fully tetrahedral andmetallic.ThoughSiO 2 andGeO 2 areprototypesofstrongglass-formingmaterials (either onquenchingand compressing), amorphous CO 2 (a-carbonia) is known relatively shortly. First predictionof CO 4 tetrahedra-based amorphous CO 2 came from DFT MD simulations [71] and the firstreported observation of a-carbonia suggested existence of mixed three and fourfold-coordinatedcarbons [72]. More extensive experimental studies [30] reported that amorphization of CO 2 -IIIis preceded by a progressive formation of C-O single bonds and that the amorphous structureseems to be a glassy counterpart of non-molecular phase V. Amorphization of CO 2 at roomtemperature [73] was proposed to be triggered by close intermolecular approaches reachingminimal sustainable values. The kinetic boundary of amorphization was found to be negativelyslopedpointingtokineticalhindranceatlowtemperatures. Itwasalsonotedthatthiskineticline17
seems to connect to the kinetic boundary of the phase V formation confirming that a-carboniais most probably amorphous counterpart of phase V. These results were confirmed by ab initioMD simulations [74] and also by ab initio metadynamics [75]. In addition to PIA, decompressingnon-molecular amorphous CO 2 led to transformation into a new molecular amorphous form at16 GPa [30].Two important differences between CO 2 and other group IV dioxides include the rigidityof C-O-C intertetrahedral angle (great energy increase on bending out of its well-defined idealvalue[76])andfavoringthesp 2 hybridization. Theformerhasimportantimplicationsforpossiblestructures of CO 2 , whereas soft Si-O-Si angle allows silica to form a rich variety of polymorphs,while CO 2 favours only one or two tetrahedral structures. Favoring the sp 2 carbon hybridizationresults into three-coordinated amorphous form with silica and germanica polymorphs formingalways only four or sixfold coordinations.3.2.2 Preliminary results and discussionTo investigate properties of amorphous CO 2 and mechanism of PIA and to confirm existenceof AAT, we adopted basically the same methods and techniques as in the study of sulfur.We performed ab initio MD simulations with VASP and Berendsen scheme on relatively smallsystem of 32 CO 2 molecules in a 2×2×2 extension of CO 2 -III unit cell making up simulationsupercell. PBE functional of KS DFT and PAW schemes were used with the energy cutoff 450eV. Currently, we run simulations on much larger and more realistic system of 108 molecules,but the results were not completed in the time of the submission of the PhD thesis.We started simulations from molecular CO 2 -III optimized to 60 GPa and heated to 1000 Kwhen amorphization occurred by progressive creation of three and fourfold-coordinated carbonsby nucleation aroundprecedingdefects. Decompressing to 10 GPa, the amorphousformchangedabruptly from extended amorphous form into a purely molecular amorphous form, in accordancewith the experiments [30].Before the amorphization took place at 60 GPa and 1000 K, we observed creation of structuraldefects. First defect was created between two parallel planes in the CO 2 -III structureand involved three molecules that formed one isolated C≡O carbon monoxide unit and dicarbonpentoxide C 2 O 5 object touching the planes. This defective structure then transformedwhen interpentagonal O-O bond broke and a larger cyclic defect was made out of four adjacentmolecules. This C 4 O 8 object was also cyclic with a regular sequence of four connected-C-O- units. Shortly after this event, a connection of four different molecules emerged to createchain-C 4 O 8 . When this highly defective structure started to amorphize, the process wascompleted practically immediately - within 1.2 ps, during which carbon atoms developed threeand four coordinations in a cascade progressing rapidly particularly around the chain defect.The resulting form was amorphous and fully extended in all three dimensions forming three andfourfold-coordinated network. This form is shown on Fig. 6 (left) along the second distinctmolecular amorphous form (right). This brief description of the amorphization process is illustratedby evolution of the percentual distribution of carbon coordinations. Each carbon atomcan be one-coordinated (monoxide C≡O), two-coordinated (single CO 2 molecule), three (onedouble and two single bonds) and four-coordinated (four single oxygen bonds) and on Fig. 5,we show the time evolution of this C coordination distribution.18
Amount of coordination [%]100908070605040302010Average coordination3.43.232.82.62.42.220 4 8 12 16 20 24 28 32 36 40time [ps]1-coordinations2-coordinations3-coordinations4-coordinations00 2 4 6 8 10 12 14 16 18 20 22 24 26 28 30 32 34 36 38 40time [ps]Figure 5: The 40 ps run at 60 GPa and 1000 K. The black (vanishing at 18 ps), red (constantlydecreasing from 100%), green (increasing to 70%) and blue (increasing to 30%) curves representpercentual amount of one, two, three and four-coordinated carbons, respectively. The creationof the C 2 O 5 pentagon in the 3rd ps, cyclic and chain C 4 O 8 objects in the 18th ps and rapidamorphization starting at 21th ps are well visible by sudden changes in the coordination distribution.(Inset) Average carbon coordination at the same time interval throughout the run. Thelimit for the coordination cutoff was set to 1.5 Å.From the figure, it can be well seen the creation of all defects and rapid amorphizationprocess represented by extremely quick growth of the three-coordinations (green) and decreasein molecular character (red). In the inset of Fig. 5, the same time evolution is presented for theaverage carbon coordination starting at the value of 2.0 and ending at value of around 3.2.At 60 GPa, the mean intermolecular distances in phase III were around 2.3 Åcompared tothe C=O bond length being around 1.2 Å, and hence we point out that the mechanism of PIAis clearly based on development of structural defects and nucleation of higher pressure phase.This mechanism was definitely favored by relatively high temperatures of our simulations thatenabled transition starting before close intermolecular approaches as it was the case of sulfur.Amorphization was found to bevery sharp in all properties (with over 12% of inelastic transitionvolume decrease and energy increase of ∆E = 0.18 eV on one molecule) clearly pointing to afirst-order nature of the (non-equilibrium) transition.The amorphous form at 60 GPa visually appeared similar to tetrahedral structure of nonmolecularphase V. We therefore investigated the short-range structure of our simulated a-CO 2by RDF and ADF distributions and coordination numbers and compared them to phase V α-cristobalite properties. We indeed obtained clear similarities with short-ranged parts of RDFs19
Figure 6: A dramatic example of polyamorphism in CO 2 - two completely different amorphousphases. (Left) Strictly non-molecular (perhaps cristobalite-like) amorphous form of mixed threeand fourfold carbon atoms at 60 GPa. (Right) Purely molecular amorphous form formed bylinear CO 2 molecules at 10 GPa, pictures by Jmol [66].and in the values of the coordination numbers N C with the greatest difference present in N Cof O-O possibly indicating that amorphous carbonia is primary represented by disorder in theoxygen sublattice. The angular distribution of the intertetrahedral C-O-C angle revealed arelatively sharp distribution around the mean value of about 115 ◦ and a minor peak around120 ◦ . This is in a good agreement with calculations of ”ideal” C-O-C angle in CO 2 crystallinetetrahedral phases estimated to lie between 120-125 ◦ [76].Compression of amorphous CO 2 to 70 and to 80 GPa did not bring any sudden changes inamorphous form and hence we continued with decompression. At 80 GPa, the amorphous formcontained roughly the same amount of three and four coordinations, which is in good accordancewith other simulations [74, 75] taking into account their P-T history. Decompression from 80to 20 GPa changed the ratio of three to four-coordinations to the value of 2.44 and the averagecoordination at 20 GPa was 3.1. At this point, it could be noted that the amorphous formswith great majority of three and fourfold coordinations might be considered as two distinctamorphous forms, but there is most probably no phase transition between them as there is veryslow continual change in the 3-4 coordination ratio on de/compression.On decompression from 20 to 10 GPa, we observed a clear polyamorphic transition in agreementwithexperiments [30], wheresuchtransition was observed at 16 GPa. Thisnewamorphousphase is shown on Fig. 6 (right) along the original extended amorphous form (left). During thequick AAT process, three sudden and very rapid accelerations of the ”molecularization” tookplace and made the entire transition to be finished in a very short time. From clearly largeand sudden changes in the structure and physical properties (density and energy), it can be assumedthat this polyamorphic transition is also of first-order nature, in strict contrast to gradualchanges in non-molecular amorphous CO 2 between intermediate states of different three-to-fourcoordination ratio value. The new amorphous phase was purely molecular, with linear CO 2molecules placed randomly in a relatively large space of 35 Å 3 on molecule.20
4 SummaryIn the thesis, we studied nature and mechanism of pressure-induced transformations in solidsby means of ab initio molecular dynamics simulations at constant high pressure conditions.We aimed at resolving the open questions concerning two interesting and not yet completelyunderstood phenomena of pressure-induced amorphization and amorphous-amorphous transition.We studied two distinct materials with reported amorphization and polyamorphism uponde/compression - elemental sulfur and carbon dioxide. S and CO 2 form very stable molecularcrystals at ambient conditions with intramolecular bonds very hard to be broken in order totrigger a transformation. Both compounds thus exhibit large metastability regimes and thereforealso the completion of polymorphic transition is kinetically hindered at low temperaturesand so once transition starts, crystallization is hindered by a reduced molecular mobility andsystem remains trapped in some part of amorphous minima megabasin. As far as some of theexperimental results were incomplete or controversial, we complemented the experiments bycomputer modeling, which provides access to information not available from experiments.Simulations on sulfur were performed mainly on 512 atomic sample and have been published[1], whilecomputations of CO 2 arecurrently runningon 324 atomic sampleandwerenot finishedin the time of the thesis submission, hence preliminary results on smaller 96 atomic system werepresented. All simulations were performed by VASP[10] and CPMD [11] ab initio simulationpackages, in case of VASP supplemented by the use of Berendsen barostat [16]. We observedPIA in S and CO 2 in agreement with experiments [55, 30], including amorphization pressuresand local structures of the amorphous forms. We did not reproduce AAT in sulfur which canbe attributed either to time scale problem of our quantum simulations or to nanocrystallinenature of experimental LDA and HDA forms of sulfur. In case of CO 2 , transition from nonmolecularamorphous to molecular amorphous form was reproduced very well and agreed withthe experimental conditions [30].We identified the amorphous form of sulfur from our simulations to correspond to the experimentallyobserved LDA form [55] and amorphous CO 2 from phase III compression containedmixed three and fourfold-coordinated carbons in agreement with the experiments [30, 77, 73]and simulations [74, 75]. Regarding possible relations of amorphous S and CO 2 to underlyingcrystal phases, we showed that in case of our simulated amorphous sulfur, its short-range structureresembles molecular sulfur, from which it was created as well as the phase S-III, henceleaving this question open. The amorphized phase III of CO 2 shows clear resemblance to phaseV cristobalite structure.Besides the amorphous forms, we also obtained new crystal-crystal polymorphic transitionsinsulfurbeforetheonset of amorphization. We denoted thephaseas monoclinicsulfuraccordingto change of the lattice symmetry preserving the molecular character. Half of the eight-atomicsulfur molecules changed from original D 4d isomers to distorted lower C 2 -symmetry isomers.Other crystalline phases of S were observed in smaller system consisting of 128 atoms, namelysimple triclinic structure with one atom per unit cell and second structure with regular laddersof sulfur atoms. Calculating enthalpies, we predict these phases might be metastable at certainconditions.Studying the mechanism of the transitions was one of the major questions we aimed to21
esolve. The density-driven amorphization process in sulfur starts at 40 GPa, when the distributionsof nearest intra and intermolecular distances begin to overlap. This leads to bondinterchanges and eventually to molecular disintegration and formation of structurally disorderedphase with different role of original and distorted S 8 molecules played during amorphization.In CO 2 , amorphization starts at 60 GPa, when intermolecular distances are slightly lower thantwice of the bonds lengths, but before the amorphization, the structure of CO 2 -III contains agreat portion of defects around which the amorphization clearly progresses. The mechanism ofPIA in S and CO 2 thus has similar and also different features. In the case of sulfur, PIA isclearly based on strong molecular overpressurization and considerable shrink of the intermolecularspace, while in CO 2 therole of defects seems to becrucial. This can beexplained by resistiblesulfuric cyclic molecules in respect to linear and open CO 2 ones and also by the fact that CO 2simulations were performed at higher temperature enabling defects to be created and trigger thetransition.In the case of CO 2 , both PIA and AAT transitions occurred relatively sharply and wereaccompanied by a volume decrease by more than a few %. This probably points to the firstordernature of these transitions, though processing in a non-equilibrium. In the case of sulfur,the associated effects are less clear and do not allow to determine the order of the transitionundoubtably.References[1] D. Plašienka and R. Martoňák, Phys. Rev. B 85, 094112 (2012).[2] M. Born and R. J. Oppenheimer, Ann. Phys. 389, 457 (1927).[3] M. C. Payne et al., Rev. Mod. Phys. 64, 1045 (1992).[4] P. H. W. Kohn, Phys. Rev. 136, B864 (1964).[5] W. Kohn and L. J. Sham, Phys. Rev. 140, A1133 (1965).[6] J. P. Perdew, K. Burke, and M. Ernzerhof, Phys. Rev. Lett. 77, 3865 (1996).[7] J. Ihm, A. Zunger, and M. L. Cohen, Jour. Phys. C: Solid State Phys. 12, 4409 (1979).[8] D. Vanderbilt, Phys. Rev. B 41, 7892 (1990).[9] P. E. Blöchl, Phys. Rev. B 50, 17953 (1994).[10] G. Kresse and J. Furthmüller, Phys. Rev. B 54, 11169 (1996).[11] R. Car and M. Parrinello, Phys. Rev. Lett. 55, 2471 (1985).[12] W. C. Swope, H. C. Andersen, P. H. Berens, and K. R. Wilson, Jour. Chem. Phys. 76, 637(1982).[13] S. Gödecker, Jour. Chem. Phys. 120, 9911 (2004).[14] A. R. Oganov and C. W. Glass, J. Chem. Phys. 124, 244704 (2006).[15] R. Martoňák, Eur. Phys. Jour. B 79, 241 (2011).[16] H. J. C. Berendsen et al., J. Chem. Phys. 81, 3684 (1984).22
[17] O. H. Nielsen and R. M. Martin, Phys. Rev. B 32, 3780 (1985).[18] A. Laio and M. Parrinello, PNAS 99, 12562 (2002).[19] C. A. Angell, Science 267, 1924 (1984).[20] F. H. Stillinger and T. A. Weber, Science 225, 983 (1984).[21] F. H. Stillinger, Science 267, 1935 (1995).[22] P. G. Debenedetti and F. H. Stillinger, Nature 410, 259 (2001).[23] M. Goldstein, J. Chem. Phys. 51, 3728 (1969).[24] W. Kauzmann, Chem. Rev. 43, 219 (1948).[25] L. Berthier and G. Biroli, Rev. Mod. Phys. 83, 587 (2011).[26] A. K. Arora, in High Pressure Phenomena, edited by R. J. Hemley and G. L. Chiarotti(IOS PRESS, Amsterdam, The Netherlands, 2002), pp. 545–560.[27] S. M. Sharma and S. K. Sikka, Prog. Mat. Sci. 40, 1 (1996).[28] O. Mishima, L. D. Calvert, and E. Whalley, Nature 310, 939 (1984).[29] R. J. Hemley et al., Nature 334, 52 (1988).[30] M. Santoro et al., Nature 441, 857 (2006).[31] S. K. Deb, M. Wilding, M. Somayazulu, and P. F. McMillan, Nature 414, 528 (2001).[32] H. Luo and A. L. Ruoff, Phys. Rev. B 48, 569 (1993).[33] A. F. Goncharov et al., Phys. Rev. Lett. 85, 1262 (2000).[34] T. Yamanaka, T. Nagai, and T. Tsuchiya, Zeit. Krist. 212, 401 (1997).[35] M. B. Kruger and R. Jeanloz, Science 249, 647 (1990).[36] V. V. Brazhkin et al., Jour. Non-cryst. Solids 212, 49 (1997).[37] M. Born, Jour. Chem. Phys. 7, 591 (1939).[38] J. S. Tse and D. D. Klug, Phys. Rev. Lett. 67, 3559 (1991).[39] J. S. Tse et al., Nature 400, 647 (1999).[40] P. F. McMillan, Jour. Mat. Chem. 14, 1506 (2004).[41] P. F. McMillan, in High Pressure Phenomena, edited by R. J. Hemley and G. L. Chiarotti(IOS PRESS, Amsterdam, The Netherlands, 2002), pp. 511–541.[42] J. L. Yarger and G. H. Wolf, Science 306, 820 (2004).[43] O. Mishima, L. D. Calvert, and E. Whalley, Nature 314, 76 (1985).[44] E. Principi et al., Phys. Rev. B 69, 201201 (2004).[45] Y. Lin et al., Phys. Rev. Lett. 107, 175504 (2011).[46] M. Grimsditch, Phys. Rev. Lett. 52, 2379 (1984).23
[47] J. P. Itie et al., Phys. Rev. Lett. 63, 398 (1989).[48] M. Guthrie et al., Phys. Rev. Lett. 93, 115502 (2004).[49] J. N. Glosli and F. H. Ree, Phys. Rev. Lett. 82, 4659 (1999).[50] Y. Katayama et al., Nature 403, 170 (2000).[51] M. Springborg and R. O. Jones, Phys. Rev. Lett. 57, 1145 (1986).[52] J. S. Tse and D. D. Klug, Phys. Rev. B 59, 34 (1999).[53] T. Loerting and N. Giovambattista, J. Phys.: Condens. Matter 18, R919 (2006).[54] D. Daisenberger et al., Phys. Rev. B 75, 224118 (2007).[55] C. Sanloup, E. Gregoryanz, O. Degtyareva, and M. Hanfland, Phys. Rev. Lett. 100, 075701(2008).[56] D. Lacks, Phys. Rev. Lett. 84, 4629 (2000).[57] K. Trachenko, M. T. Dove, V. Brazhkin, and F. El’kin, Phys. Rev. Lett. 93, 135502 (2004).[58] B. Meyer, Chemical Reviews 76, 367 (1976).[59] H. Fujihisa et al., Phys. Rev. B 70, 134106 (2004).[60] O. Degtyareva et al., Nature materials 4, 152 (2005).[61] C. Hejny et al., Phys. Rev. B 71, 020101 (2005).[62] S. P. Rudin and A. Y. Liu, Phys. Rev. Lett. 83, 3049 (1999).[63] A. Nishikawa, K. Niizeki, and K. Shindo, Phys. stat. sol. (b) 211, 373 (1999).[64] E. Gregoryanz et al., Phys. Rev. B 65, 064504 (2002).[65] T. Scopigno et al., Phys. Rev. Lett. 99, 025701 (2007).[66] Jmol: an open-source Java viewer for chemical structures in 3D. http://www.jmol.org/.[67] K. D. Litasov, A. F. Goncharov, and R. J. Hemley, Earth Planet. Sci. Lett. 309, 318 (2011).[68] A. R. Oganov et al., Earth Planet. Sci. Lett. 273, 38 (2008).[69] C.-S. Yoo et al., Phys. Rev. Lett. 83, 5527 (1999).[70] V. Iota, C.-S. Yoo, and H. Cynn, Science 283, 1510 (1999).[71] S. Serra et al., Science 284, 788 (1999).[72] C.-S. Yoo, V. Iota, and H. Cynn, Phys. Rev. Lett. 86, 444 (2001).[73] T. Kume et al., Jour. Appl. Phys. 102, 53501 (2007).[74] J. A. Montoya et al., Phys. Rev. Lett. 100, 163002 (2008).[75] J. Sun et al., PNAS 106, 6077 (2009).[76] J. Dong, J. K. Tomfohr, and O. F. Sankey, Phys. Rev. B 61, 5967 (2000).[77] M. Santoro, J.-F. Lin, H.-K. Mao, and R. J. Hemley, Jour. Chem. Phys. 121, 2780 (2004).24