Business & Contract Estimating Tools - McCormick PCS Info
Business & Contract Estimating Tools - McCormick PCS Info
Business & Contract Estimating Tools - McCormick PCS Info

You also want an ePaper? Increase the reach of your titles
YUMPU automatically turns print PDFs into web optimized ePapers that Google loves.
Order of Magnitude (OOM) Cost CalculatorNote: Shaded areas are calculated automatically after unshaded areas are filled in.Estimated Direct Labor Hours = 0Composite Burdened Labor Rate = $0hoursper hourTarget Profit = 0%With ProfitWithout ProfitEstimated Direct Cost $0 $0Target Profit $0Estimated Total Price $0 $0OOM Minimum Price $0 $0OOM Maximum Price $0 $0
Note: Shaded areas are calculated automatically after unshaded areas are filled in.1Q06 2Q06 3Q06 4Q06 1Q06 2Q06 3Q06 4Q06 TOTALWBS Level 2 Labor Equivalent Direct Equivalent Direct Equivalent Direct Equivalent Direct Equivalent Direct Equivalent Direct Equivalent Direct Equivalent Direct DIRECTActivity Labor Category ID Code People Rq'd Cost People Rq'd Cost People Rq'd Cost People Rq'd Cost People Rq'd Cost People Rq'd Cost People Rq'd Cost People Rq'd Cost COSTActivity Project Manager 100 0.33 $9,438 0.33 $9,438 0.33 $9,438 0.33 $9,438 0.33 $9,816 0.33 $9,816 0.00 $0 0.00 $0 $57,383"A" Sr. Systems Engineer 110 0.33 $7,722 0.33 $7,722 0.33 $7,722 0.33 $7,722 0.33 $8,031 0.33 $8,031 0.00 $0 0.00 $0 $46,950Systems Engineer 112 0.50 $11,180 0.70 $15,652 0.80 $17,888 0.80 $17,888 0.50 $11,627 0.30 $6,976 0.00 $0 0.00 $0 $81,212Sr. Design Engineer 120 0.50 $11,700 2.00 $46,800 2.00 $46,800 2.00 $46,800 0.50 $12,168 0.40 $9,734 0.00 $0 0.00 $0 $174,002Software Engineer 122 0.25 $5,720 0.75 $17,160 1.00 $22,880 1.00 $22,880 0.25 $5,949 0.50 $11,898 0.00 $0 0.00 $0 $86,486Quality Control 124 0.33 $5,834 0.33 $5,834 0.50 $8,840 0.50 $8,840 0.33 $6,068 1.00 $18,387 0.00 $0 0.00 $0 $53,804Design Engineer 125 2.00 $44,200 2.00 $44,200 3.00 $66,300 2.00 $44,200 1.00 $22,984 1.00 $22,984 0.00 $0 0.00 $0 $244,868Associate Design Engineer 127 2.00 $36,400 3.00 $54,600 3.00 $54,600 3.00 $54,600 2.00 $37,856 1.00 $18,928 0.00 $0 0.00 $0 $256,984Sr. Test Engineer 130 0.00 $0 0.00 $0 1.00 $23,920 1.00 $23,920 1.00 $24,877 3.00 $74,630 0.00 $0 0.00 $0 $147,347Test Engineer 135 0.00 $0 0.00 $0 2.00 $45,760 2.00 $45,760 4.00 $95,181 5.00 $118,976 0.00 $0 0.00 $0 $305,677Project Coordinator 140 0.33 $6,349 1.20 $23,088 1.50 $28,860 1.50 $28,860 1.00 $20,010 0.70 $14,007 0.00 $0 0.00 $0 $121,174Configuration Management 142 0.33 $6,349 0.70 $13,468 1.00 $19,240 1.00 $19,240 0.50 $10,005 0.70 $14,007 0.00 $0 0.00 $0 $82,309<strong>Business</strong> Manager 150 0.33 $6,521 0.50 $9,880 1.00 $19,760 1.00 $19,760 0.50 $10,275 0.50 $10,275 0.00 $0 0.00 $0 $76,471Activity "A" Subtotal7.23 $151,414 11.84 $247,842 17.46 $372,008 16.46 $349,908 12.24 $274,845 14.76 $338,649 0.00 $0 0.00 $0 $1,734,6661Q06 2Q06 3Q06 4Q06 1Q06 2Q06 3Q06 4Q06 TOTALWBS Level 2 Labor Equivalent Direct Equivalent Direct Equivalent Direct Equivalent Direct Equivalent Direct Equivalent Direct Equivalent Direct Equivalent Direct DIRECTActivity Labor Category ID Code People Rq'd Cost People Rq'd Cost People Rq'd Cost People Rq'd Cost People Rq'd Cost People Rq'd Cost People Rq'd Cost People Rq'd Cost COSTActivity Project Manager 100 0.33 $9,438 0.33 $9,438 0.33 $9,438 0.33 $9,438 0.33 $9,816 0.33 $9,816 0.00 $0 0.00 $0 $57,383"B" Sr. Systems Engineer 110 0.33 $7,722 0.33 $7,722 0.33 $7,722 0.33 $7,722 0.33 $8,031 0.33 $8,031 0.00 $0 0.00 $0 $46,950Systems Engineer 112 0.50 $11,180 0.70 $15,652 0.80 $17,888 0.80 $17,888 0.50 $11,627 0.30 $6,976 0.00 $0 0.00 $0 $81,212Sr. Design Engineer 120 0.50 $11,700 2.00 $46,800 2.00 $46,800 2.00 $46,800 0.50 $12,168 0.40 $9,734 0.00 $0 0.00 $0 $174,002Software Engineer 122 0.25 $5,720 0.75 $17,160 1.00 $22,880 1.00 $22,880 0.25 $5,949 0.50 $11,898 0.00 $0 0.00 $0 $86,486Quality Control 124 0.33 $5,834 0.33 $5,834 0.50 $8,840 0.50 $8,840 0.33 $6,068 1.00 $18,387 0.00 $0 0.00 $0 $53,804Design Engineer 125 2.00 $44,200 1.00 $22,100 3.00 $66,300 3.00 $66,300 2.00 $45,968 1.00 $22,984 0.00 $0 0.00 $0 $267,852Associate Design Engineer 127 2.00 $36,400 2.00 $36,400 3.00 $54,600 3.00 $54,600 2.00 $37,856 1.00 $18,928 0.00 $0 0.00 $0 $238,784Sr. Test Engineer 130 0.00 $0 0.00 $0 1.00 $23,920 1.00 $23,920 1.00 $24,877 3.00 $74,630 0.00 $0 0.00 $0 $147,347Test Engineer 135 0.00 $0 0.00 $0 2.00 $45,760 2.00 $45,760 4.00 $95,181 5.00 $118,976 0.00 $0 0.00 $0 $305,677Project Coordinator 140 0.33 $6,349 0.33 $6,349 0.33 $6,349 0.33 $6,349 0.33 $6,603 0.33 $6,603 0.00 $0 0.00 $0 $38,603Configuration Management 142 0.33 $6,349 0.33 $6,349 0.33 $6,349 0.33 $6,349 0.33 $6,603 0.33 $6,603 0.00 $0 0.00 $0 $38,603<strong>Business</strong> Manager 150 0.33 $6,521 0.33 $6,521 0.33 $6,521 0.33 $6,521 0.33 $6,782 0.33 $6,782 0.00 $0 0.00 $0 $39,646Activity "B" Subtotal 7.23 $151,414 8.43 $180,326 14.95 $323,367 14.95 $323,367 12.23 $277,528 13.85 $320,348 0.00 $0 0.00 $0 $1,576,3501Q06 2Q06 3Q06 4Q06 1Q06 2Q06 3Q06 4Q06 TOTALWBS Level 2 Labor Equivalent Direct Equivalent Direct Equivalent Direct Equivalent Direct Equivalent Direct Equivalent Direct Equivalent Direct Equivalent Direct DIRECTActivity Labor Category ID Code People Rq'd Cost People Rq'd Cost People Rq'd Cost People Rq'd Cost People Rq'd Cost People Rq'd Cost People Rq'd Cost People Rq'd Cost COSTActivity Project Manager 100 1.00 $28,600 1.00 $28,600 1.00 $28,600 1.00 $28,600 1.00 $29,744 1.00 $29,744 0.00 $0 0.00 $0 $173,888"C" Sr. Systems Engineer 110 1.00 $23,400 1.00 $23,400 1.00 $23,400 1.00 $23,400 1.00 $24,336 1.00 $24,336 0.00 $0 0.00 $0 $142,272Systems Engineer 112 0.50 $11,180 0.70 $15,652 0.80 $17,888 0.80 $17,888 0.50 $11,627 0.30 $6,976 0.00 $0 0.00 $0 $81,212Sr. Design Engineer 120 0.50 $11,700 2.00 $46,800 2.00 $46,800 2.00 $46,800 0.50 $12,168 0.40 $9,734 0.00 $0 0.00 $0 $174,002Software Engineer 122 0.25 $5,720 0.75 $17,160 1.00 $22,880 1.00 $22,880 0.25 $5,949 0.50 $11,898 0.00 $0 0.00 $0 $86,486Quality Control 124 0.20 $3,536 0.33 $5,834 0.50 $8,840 0.50 $8,840 0.33 $6,068 1.00 $18,387 0.00 $0 0.00 $0 $51,505Design Engineer 125 1.00 $22,100 2.00 $44,200 3.00 $66,300 3.00 $66,300 1.00 $22,984 0.50 $11,492 0.00 $0 0.00 $0 $233,376Associate Design Engineer 127 2.00 $36,400 2.00 $36,400 3.00 $54,600 3.00 $54,600 2.00 $37,856 1.00 $18,928 0.00 $0 0.00 $0 $238,784Sr. Test Engineer 130 1.00 $23,920 0.00 $0 1.00 $23,920 1.00 $23,920 1.00 $24,877 3.00 $74,630 0.00 $0 0.00 $0 $171,267Test Engineer 135 0.00 $0 0.00 $0 2.00 $45,760 2.00 $45,760 2.00 $47,590 5.00 $118,976 0.00 $0 0.00 $0 $258,086Project Coordinator 140 0.33 $6,349 0.33 $6,349 0.33 $6,349 0.33 $6,349 0.33 $6,603 0.33 $6,603 0.00 $0 0.00 $0 $38,603Configuration Management 142 0.33 $6,349 0.33 $6,349 0.33 $6,349 0.33 $6,349 0.33 $6,603 0.33 $6,603 0.00 $0 0.00 $0 $38,603<strong>Business</strong> Manager 150 0.33 $6,521 0.33 $6,521 0.33 $6,521 0.33 $6,521 0.33 $6,782 0.33 $6,782 0.00 $0 0.00 $0 $39,646Activity "C" Subtotal 8.44 $185,775 10.77 $237,266 16.29 $358,207 16.29 $358,207 10.57 $243,187 14.69 $345,090 0.00 $0 0.00 $0 $1,727,732PROJECT TOTAL 22.90 $488,602 31.04 $665,434 48.70 $1,053,582 47.70 $1,031,482 35.04 $795,560 43.30 $1,004,087 0.00 $0 0.00 $0 $5,038,748Budgetary Minimum $4,282,936Budgetary Maximum (NTE) $6,550,372
Profit ModelFill in white cells only. All others willbe calculated automatically.YEARAssumptions 1 2 3 4 5 6 7 8 TOTALMARKETING FORECASTAverage sales price per unit 10% per year $4,400 $3,960 $3,564 $3,208 $2,887 $2,598Market size (units) 10,000 20,000 40,000 70,000 40,000 30,000Market share 65% 50% 40% 25% 15% 10%Unit sales 6,500 10,000 16,000 17,500 6,000 3,000TOTAL PROJECTED SALES $28,600,000 $39,600,000 $57,024,000 $56,133,000 $17,321,040 $7,794,468 $206,472,508PRODUCT COSTS 1 2 3 4 5 6 7 8 TOTALProject CostsProduct Conception $300,000 $300,000Project Planning & Staffing $757,000 $757,000Product Design $720,000 $720,000Product Modeling $135,000 $135,000Manufacture First Unit $350,000 $350,000Test & Verification $250,000 $250,000Total Product Development Costs $1,912,000 $600,000 $2,512,000Product Support Costs 1 2 3 4 5 6 7 8 TOTALCost per unit (production) 5.0% per year $2,000 $1,900 $1,805 $1,715 $1,629 $1,548 $10,596Total production cost $13,000,000 $19,000,000 $28,880,000 $30,008,125 $9,774,075 $4,642,686 $105,304,886Maintenance Costs $100,000 $100,000 $100,000 $100,000 $100,000 $100,000 $600,000General & Administrative Expense 1.0% of sales $286,000 $396,000 $570,240 $561,330 $173,210 $77,945 $2,064,725Overhead Expense 5.0% of sales $1,430,000 $1,980,000 $2,851,200 $2,806,650 $866,052 $389,723 $10,323,625Marketing expenses 2.0% of total sales $572,000 $792,000 $1,140,480 $1,122,660 $346,421 $155,889 $4,129,450Total Product Support Costs $15,388,000 $22,268,000 $33,541,920 $34,598,765 $11,259,758 $5,366,243 $122,422,686TOTAL PRODUCT COSTS $1,912,000 $600,000 $15,388,000 $22,268,000 $33,541,920 $34,598,765 $11,259,758 $5,366,243 $124,934,686PROFITABILITY FORECAST 1 2 3 4 5 6 7 8 TOTALProfit before tax (PBT) -$1,912,000 -$600,000 $13,212,000 $17,332,000 $23,482,080 $21,534,235 $6,061,282 $2,428,225 $81,537,822Return on investment (%) 85.9% 77.8% 70.0% 62.2% 53.8% 45.2%Cumulative PBT (Cash Flow) -$1,912,000 -$2,512,000 $10,700,000 $28,032,000 $51,514,080 $73,048,315 $79,109,597 $81,537,822Total Product Costs $124,934,686Total Product Sales $206,472,508Benefit/Cost Ratio 1.65Total PBT $81,537,822Return on Investment 65.3%Return on Sales 39.5%
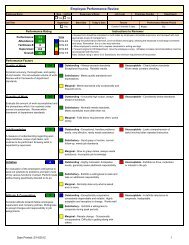
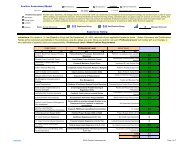
KEPNER-TREGOE ANALYSISFill in unshaded cells only. Replacenumbers & text with your own.MUSTS Product A Go/No Go Product B Go/No Go Product C Go/No GoAchieve an ROI of at least 30% 30% Go 40% Go 35% GoWANTS Weight <strong>Info</strong> Score WeightedScoreMeets customer needs 25 5 125 4 100 4 100Favorable time-to-market (schedule) 10 5 50 4 40 3 30Minimal project cost 5 5 25 3 15 4 20Product can be easily modeled 5 4 20 5 25 3 15Minimal technology risks 15 0 0 3 45 5 75Predicted return-on-investment(ROI)25 1 25 5 125 3 75Forecasted product reliability 10 3 30 5 50 3 30Producibility (can me made easily) 5 5 25 3 15 4 20<strong>Info</strong>ScoreWeightedScore<strong>Info</strong>ScoreWeightedScore0 0 00 0 00 0 00 0 00 0 00 0 00 0 00 0 0TOTAL 100 Weighted Score 300 Weighted Score 415 Weighted Score 365Risk Factor -35 -45 -8Adjusted Score 265 Adjusted Score 370 Adjusted Score 357
KEPNER-TREGOE ANALYSISRisk Factor CalculationsProduct A P S P x S Product B P S P x S Product C P S P x SMay only get three of needed skilled people 5 7 -35 Needed skills may not be available 4 5 -20 New technology may create high risks 2 4 -8May have difficulty producing product 5 5 -2500-35 -45 -8
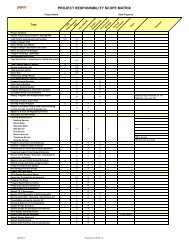
1 = Primary responsibility 2 = Must be consulted 3 = May be consulted 4 = Has approval authorityResponsibility Allocation MatrixProject Systems Proj. Controls Project Team Manuf. Marketing Subcontract Design ConfigurationPROJECT RESPONSIBILITIES Manager Engineer Leader Coordinator Leaders Manager Specialists Manager Engineers ManagerDefine overall project goals 1,4 2 2 3 3 2 2 3 3Oversee the development of a project plan 1,4 2 2 3 3 2 2 3 3Develop a Work Breakdown Structure (WBS) 2,4 2 1 3 3 2 2 3 3Establish top-level project requirements 1,4 2 2 3 3 2 2 3 3Establish hardware specifications 2,4 2,4 2,4 2,4 3 1,4Establish software specifications 2,4 2,4 2,4 2,4 3 1,4Develop the project organization breakdown structure (OBS) 1,4 2 2 3 3 3 3Define overall project workscope 1,4 2 2 3 3 3 3 3 3Develop the project responsibility allocation matrix (RAM) 1,4 2 2 3 3 3 3 3 3Identify major project technical risks & develop mitigationplansIdentify major project business risks & develop mitigationplans2,4 1,4 3 3 2 2 2 2 32,4 3 1,4 3 3 2 2 2 3Conduct make-or-buy decision process 1,4 2 2 3 3 3 2 3Develop a project tracking system 1,4 2 2 3 3 3 3 3Identify major project milestones 1,4 2 2 3 3 3 3 3Develop a project reporting requirements 1,4 2 2 3 3 3 3 3Conduct regular project status reviews 2,4 2 2 1 2 2 2 2 2Prepare project budgets 2,4 2 1,4 2 2 2 2 2 2Develop the detailed project schedule 2,4 2 2 1 2 2 2 2 2Conduct designated product design reviews 2,4 1,4 3 3 2 2 2 2 2Customer point-of-contact 1 2 2Develop a project change-control system 2,4 2 1,4 2 2 2 2 2 2Chair the change-control board 1,4 2 2Identify and track all project baseline changes 2 2 3 2 1Coordinate change-control board activities 2 1Manage subcontractors 2,4 2 2 1 3Develop a subcontract management plan 4 3 4 3 1 3Prepare a manufacturing plan 2,4 2,4 3 3 1,4 3Develop a team plan 4 3 3 3 1 2Develop a team RAM 1Provide regular team status 2 2 1 2Identify and monitor customer needs 2,4 2,4 2,4 3 3 3 1,4 3 3
Stochastic Duration <strong>Estimating</strong> ModelFill in the white cells--all other cells are automatically calculated. Insert a start date below.Activity Optimistic Most Likely Pessimistic Expected Time Variance Start Date = 1-Jan-2010No. (o) (m) (p) Te Probability DurationEnd Date(7 d/wk)End Date(5 d/wk)1 0 0 0 0.00 0.00 10% 0 01-Jan-10 01-Jan-102 0 0 0 0.00 0.00 15% 0 01-Jan-10 01-Jan-103 0 0 0 0.00 0.00 20% 0 01-Jan-10 01-Jan-104 0 0 0 0.00 0.00 25% 0 01-Jan-10 01-Jan-105 0 0 0 0.00 0.00 30% 0 01-Jan-10 01-Jan-106 0 0 0 0.00 0.00 35% 0 01-Jan-10 01-Jan-107 0 0 0 0.00 0.00 40% 0 01-Jan-10 01-Jan-108 0 0 0 0.00 0.00 45% 0 01-Jan-10 01-Jan-109 0 0 0 0.00 0.00 50% 0 01-Jan-10 01-Jan-1010 0 0 0 0.00 0.00 55% 0 01-Jan-10 01-Jan-1011 0 0 0 0.00 0.00 60% 0 01-Jan-10 01-Jan-1012 0 0 0 0.00 0.00 65% 0 01-Jan-10 01-Jan-1013 0 0 0 0.00 0.00 70% 0 01-Jan-10 01-Jan-1014 0 0 0 0.00 0.00 75% 0 01-Jan-10 01-Jan-1015 0 0 0 0.00 0.00 80% 0 01-Jan-10 01-Jan-1016 0 0 0 0.00 0.00 85% 0 01-Jan-10 01-Jan-1017 0 0 0 0.00 0.00 90% 0 01-Jan-10 01-Jan-102TOTAL 0.00 0.00 95% 0 01-Jan-10 01-Jan-10
PresentValue (PV)Future Value CalculatorinFuture Value(FV)Future Value(FV)Present Value CalculatornPresent Value(PV)$6,210 0.1 4 $9,092 $0 0 0 $0$11,300 0.1 3 $15,040 $0 0 0 $0$15,380 0.1 2 $18,610 $0 0 0 $0$18,680 0.1 1 $20,548 $0 0 0 $0$21,186 0.1 0 $21,186 $0 0 0 $0$0 0 0 $0 $0 0 0 $0$0 0 0 $0 $0 0 0 $0$0 0 0 $0 $0 0 0 $0$0 0 0 $0 $0 0 0 $0$0 0 0 $0 $0 0 0 $0$0 0 0 $0 $0 0 0 $0$0 0 0 $0 $0 0 0 $0$72,756 $84,476 $0i
Fill in the white cellsFill in the white cells--all other cells are automatically calculated.Stochastic Cost <strong>Estimating</strong> ModelActivity Optimistic Most Likely Pessimistic Expected Cost VarianceNo. (o) (m) (p) Ce Probability Project Cost1 $0 $0 $0 $0 $0 10% $02 $0 $0 $0 $0 $0 15% $03 $0 $0 $0 $0 $0 20% $04 $0 $0 $0 $0 $0 25% $05 $0 $0 $0 $0 $0 30% $06 $0 $0 $0 $0 $0 35% $07 $0 $0 $0 $0 $0 40% $08 $0 $0 $0 $0 $0 45% $09 $0 $0 $0 $0 $0 50% $010 $0 $0 $0 $0 $0 55% $011 $0 $0 $0 $0 $0 60% $012 $0 $0 $0 $0 $0 65% $013 $0 $0 $0 $0 $0 70% $014 $0 $0 $0 $0 $0 75% $015 $0 $0 $0 $0 $0 80% $016 $0 $0 $0 $0 $0 85% $017 $0 $0 $0 $0 $0 90% $0TOTAL $0 $0 95% $02
Basis of EstimateNo. Direct Labor Hours Jan Feb Mar Apr May Jun Jul Aug Sep Oct Nov Dec Total123456Total Direct Labor HoursTotal Direct Labor CostsNo. Direct Material/Other Costs Jan Feb Mar Apr May Jun Jul Aug Sep Oct Nov Dec Total123456Total Direct Material/Other CostsNo. Total Costs Jan Feb Mar Apr May Jun Jul Aug Sep Oct Nov Dec Total123Total CostBasis Of Estimate Calculations (Direct Labor)123456
Project Critical-Path Crashing TableSort table on "crash ratio" after the "Crash Project" values are inserted.Fill In whire cells only NORMAL PROJECT CRASHED PROJECT CRASH CALCULATIONSActivityNo. Description Time Cost Time CostAllowableCrashCrash RatioProjectDurationCumulativeProject Cost0 #DIV/0! 0 #DIV/0!0 #DIV/0! 0 #DIV/0!0 #DIV/0! 0 #DIV/0!0 #DIV/0! 0 #DIV/0!0 #DIV/0! 0 #DIV/0!0 #DIV/0! 0 #DIV/0!0 #DIV/0! 0 #DIV/0!0 #DIV/0! 0 #DIV/0!0 #DIV/0! 0 #DIV/0!0 #DIV/0! 0 #DIV/0!0 #DIV/0! 0 #DIV/0!0 #DIV/0! 0 #DIV/0!0 #DIV/0! 0 #DIV/0!0 $0 0 $0
Triple Constraint Aspect Technical Schedule Cost TotalPriority Weight 0.00 0.00 0.00 0.00Fill in white cells only Technical Schedule Cost TOTALNo. Risk Description P C WRF P C WRF P C WRF WRF1 0 0 0.00 0 0 0.00 0 0 0.00 0.002 0 0 0.00 0 0 0.00 0 0 0.00 0.003 0 0 0.00 0 0 0.00 0 0 0.00 0.004 0 0 0.00 0 0 0.00 0 0 0.00 0.005 0 0 0.00 0 0 0.00 0 0 0.00 0.006 0 0 0.00 0 0 0.00 0 0 0.00 0.007 0 0 0.00 0 0 0.00 0 0 0.00 0.008 0 0 0.00 0 0 0.00 0 0 0.00 0.009 0 0 0.00 0 0 0.00 0 0 0.00 0.0010 0 0 0.00 0 0 0.00 0 0 0.00 0.00
VarianceProject Tracking - Zone MethodFill in white cells only.45%Week No. 1 2 3 4 5 6 7 8 9 10 11 12 13 14 15 16Schedule Events-PlannedSchedule Events-ActualVariance 0 0 0 0 0 0 0 0 0 0 0 0 0 0 0Schedule Variance (%) #DIV/0! #DIV/0! #DIV/0! #DIV/0! #DIV/0! #DIV/0! #DIV/0! #DIV/0! #DIV/0! #DIV/0! #DIV/0! #DIV/0! #DIV/0! #DIV/0! #DIV/0!Labor Hours-PlannedLabor Hours-ActualVariance 0 0 0 0 0 0 0 0 0 0 0 0 0 0 0Cost Variance (%) #DIV/0! #DIV/0! #DIV/0! #DIV/0! #DIV/0! #DIV/0! #DIV/0! #DIV/0! #DIV/0! #DIV/0! #DIV/0! #DIV/0! #DIV/0! #DIV/0! #DIV/0!Project Tracking30%Schedule Variance (%) Cost Variance (%)20%10%0%0 1 2 3 4 5 6 7 8 9 10 11 12 13 14 15 16-10%-20%-30%Week No.
ValueProject Tracking - Earned Value MethodFill in white cells only.Week No. 1 2 3 4 5 6 7 8 9 10 11 12 13 14 15 16Planned Value (PV)-Cumulative $0 $0 $0 $0 $0 $0 $0 $0 $0 $0 $0 $0 $0 $0 $0 $0Actual Cost (AC)-Cumulative $0 $0 $0 $0 $0 $0 $0 $0 $0 $0 $0 $0 $0 $0 $0 $0Earned Value (EV)-Cumulative $0 $0 $0 $0 $0 $0 $0 $0 $0 $0 $0 $0 $0 $0 $0 $0SPI #DIV/0! #DIV/0! #DIV/0! #DIV/0! #DIV/0! #DIV/0! #DIV/0! #DIV/0! #DIV/0! #DIV/0! #DIV/0! #DIV/0! #DIV/0! #DIV/0! #DIV/0! #DIV/0!CPI #DIV/0! #DIV/0! #DIV/0! #DIV/0! #DIV/0! #DIV/0! #DIV/0! #DIV/0! #DIV/0! #DIV/0! #DIV/0! #DIV/0! #DIV/0! #DIV/0! #DIV/0! #DIV/0!If font size is too small on the graph below increase its size for better viewing.1.30$1$1Planned Value (PV)-Cumulative1.20SPICPI$1Actual Cost (AC)-Cumulative$1Earned Value (EV)-Cumulative1.10$11.00$1$00.90$0$00.80$00.701 2 3 4 5 6 7 8 9 10 11 12 13 14 15 16$01 2 3 4 5 6 7 8 9 10 11 12 13 14 15 16Week No.Fill in white cells only.Estimate at Completion AnalysisWeek No. EAC= #VALUE!Total EV= $0 TCPI EAC = #VALUE!Total AC= $0 TCPI BAC = #VALUE!Estimate to Complete (ETC)= VAC= #VALUE!Budget at Completion (BAC)= VAC (%)= #VALUE!
DETERMINING THE SIZE OF THE PROJECT CONTROL STAFFFor projects over $2 Million:Estimated Total Project Cost = $5,000,000Estimated annual labor rate ($/year) for "controls" personnel = $45,000Estimated project duration (years) = 2.5For projects under $2 Million:Estimated Total Project Cost (