Protection Strategies to Mitigate Major Power System Breakdowns
Protection Strategies to Mitigate Major Power System Breakdowns
Protection Strategies to Mitigate Major Power System Breakdowns
- No tags were found...

You also want an ePaper? Increase the reach of your titles
YUMPU automatically turns print PDFs into web optimized ePapers that Google loves.
1.004SPEED [pu]1.00210.99816141210GENERATOR [NUMB]86421520253035TIME [s]4045<strong>Protection</strong> <strong>Strategies</strong> <strong>to</strong> <strong>Mitigate</strong><strong>Major</strong> <strong>Power</strong> <strong>System</strong> <strong>Breakdowns</strong>Mattias JonssonDepartment of Electric <strong>Power</strong> EngineeringCHALMERS UNIVERSITY OF TECHNOLOGYGöteborg, Sweden 2003
THESIS FOR THE DEGREE OF DOCTOR OF PHILOSOPHY<strong>Protection</strong> <strong>Strategies</strong> <strong>to</strong> <strong>Mitigate</strong> <strong>Major</strong> <strong>Power</strong><strong>System</strong> <strong>Breakdowns</strong>byMATTIAS JONSSONDepartment of Electric <strong>Power</strong> EngineeringChalmers University of TechnologyGöteborg, Sweden 2003
<strong>Protection</strong> <strong>Strategies</strong> <strong>to</strong> <strong>Mitigate</strong> <strong>Major</strong> <strong>Power</strong> <strong>System</strong> <strong>Breakdowns</strong>MATTIAS JONSSONISBN 91-7291-293-6© MATTIAS JONSSON, 2003.Dok<strong>to</strong>rsavhandlingar vid Chalmers tekniska högskolaNy serie nr 1975ISSN 0346-718XSchool of Electrical EngineeringChalmers University of TechnologyTechnical Report No. 447ISSN 1651-498XDepartment of Electric <strong>Power</strong> EngineeringChalmers University of TechnologySE-412 96 GöteborgSwedenTelephone: +46 (0)31 - 772 1660Fax: +46 (0)31 - 772 1633Cover: Inter-area modes in the 68 bus NPCC system.Chalmers bibliotek, ReproserviceGöteborg, Sweden 2003iv
AbstractThis thesis deals with new methods <strong>to</strong> improve the performance ofpower system protection in the case of voltage- and transientinstability. These methods are designed primarily <strong>to</strong> mitigate powersystem breakdown. Relay algorithms are proposed where conventionaldistance protection is combined with additional relay criteria. In caseof voltage instability the criteria are based on the derivative of thevoltage whereas the rate of change of the phase angle of the current isused for transient instability. For genera<strong>to</strong>r coherency determination amethod based on wide area genera<strong>to</strong>r speed measurements and Fourieranalysis is proposed. Using this method a concept for a <strong>System</strong><strong>Protection</strong> Scheme addressing inter-area events is introduced. Finally,an emergency scheme based on conventional distance relays isproposed <strong>to</strong> avoid a complete system collapse in the case of severevoltage instability.The performance of these new methods has been compared withconventional methods based on simulations using different testsystems.The proposed relay algorithms improve the relay security with respect<strong>to</strong> voltage instability whereas the reach of the distance protection is notrestricted. Neither the line length, different swing frequencies or faultshaving a slowly decreasing impedance will affect the performance ofthe proposed schemes as may be the case when using conventional<strong>Power</strong> Swing Detec<strong>to</strong>rs. The fault clearing will also not be blocked aswith conventional PSD applications. The proposed method forestablishing genera<strong>to</strong>r coherency leads <strong>to</strong> almost identical results ifcompared with off-line methods as modal analysis or genera<strong>to</strong>r speed.Results obtained from phasor measurements however showeddeviations. This work also demonstrates that, taking initial transientdis<strong>to</strong>rtion after a contingency in<strong>to</strong> account, a reliable coherency isfaster obtained by the proposed technique than by methods using purespeed or genera<strong>to</strong>r voltage angle measurements. It has beendemonstrated that the proposed emergency scheme can save part of thesystem from a voltage collapse. Black-start can then be avoided andthe res<strong>to</strong>ration time can be reduced.Keywords: Distance protection, Genera<strong>to</strong>r coherency, Out-of-Step<strong>Protection</strong>, <strong>Power</strong> Swing Detec<strong>to</strong>rs, Voltage instability, <strong>System</strong><strong>Protection</strong> Schemes, Transient instability, Wide Area <strong>Protection</strong>.v
AcknowledgementsI owe my deepest gratitude <strong>to</strong> my advisor Professor Jaap Daalder. Firstfor accepting me as a student, then for the support and help he hasgiven me throughout the project. Finally for what I appreciate the most,that he has given me the feeling that his ”door is always open” when Ihad any kind of problem.Dag Holmberg at Svenska Kraftnät is acknowledged for his efforts inarranging the financial support for this project. The members of mysteering group Magnus Danielsson, Leif Koppari, Lars Wallin andKenneth Walve are acknowledged for their valuable contributions. Allgroup members are with Svenska Kraftnät. Additional staff at SvenskaKraftnät that I would like <strong>to</strong> thank for their help and support areAnders Edström, Anders Fransson (nowadays with SvenskaEnergihuset), Dag Ingemansson, Bertil Kielén, Allan Lundberg,Thomas Thor and Karl-Olof Jonsson. I also would like <strong>to</strong> thank themanagement of Svenska Kraftnät for funding the ARISTO computer.ABB <strong>Power</strong> <strong>System</strong>s are acknowledged for providing SIMPOW freeof charge. Special thanks go <strong>to</strong> Sune Sarri, Lars Lindkvist and JonasPersson for their valuable help with SIMPOW. In addition I would like<strong>to</strong> thank Stefan Arnborg, Svenska Kraftnät for being so generous withhis ”dsl models” when I started <strong>to</strong> work with SIMPOW.I am deeply grateful <strong>to</strong> Magnus Akke, Lars Messing and DanielKarlsson, all with ABB Au<strong>to</strong>mation Technology Products AB, for theirunrestrained way of sharing their great expertise in the area.I would like <strong>to</strong> sincerely thank Associate Professor Miroslav Begovicat Georgia Institute of Technology, Atlanta, USA for accepting me as avisiting scholar in his research group during the spring and summer,2002.Annika, Arne, Jan-Olov and Valborg thank you for all help withvarious practical things, I really appreciate it.Many thanks <strong>to</strong> all the staff and former colleagues at the Department ofElectric <strong>Power</strong> Engineering for the pleasant working atmosphere andyour friendship.Finally, I owe my deepest gratitude <strong>to</strong> Jenny-Ann and my parents, forunderstanding, encouragement and love throughout this project.vii
LIST OF PUBLICATIONSThis thesis is based on the work reported in the following papers.AJonsson M, Daalder J, “An adaptive scheme <strong>to</strong> prevent undesirabledistance protection operation during voltage instability”, Accepted forIEEE Transactions on <strong>Power</strong> Delivery.BJonsson M, Daalder J, “A new protection scheme <strong>to</strong> prevent mal-trips due<strong>to</strong> power swings”, IEEE/PES Transmission and Distribution Conferenceand Exposition, Oc<strong>to</strong>ber 28 - November 2, 2001, Atlanta, USA.Proceedings Vol. 2, pp. 724 - 729.CJonsson M, Daalder J, ”A distance protection scheme <strong>to</strong> prevent mal-tripsduring abnormal power system conditions”, Cigré Study Committee 34Colloquium and Meeting, September 10 - 14, 2001, Sibiu, Romania.Proceedings paper 113.DJonsson M, Begovic M, Daalder J, “A new method suitable for real timegenera<strong>to</strong>r coherency determination”, Submitted <strong>to</strong> IEEE Transactions on<strong>Power</strong> <strong>System</strong>s.EJonsson M, Daalder J, Begovic M, “A system protection scheme concept<strong>to</strong> counter inter-area oscillations”, Submitted <strong>to</strong> IEEE Transactions on<strong>Power</strong> Delivery.FJonsson M, Daalder J, Walve K, “An emergency strategy scheme basedon conventional distance protection <strong>to</strong> avoid complete system collapse”,Accepted for IEEE/PES Transmission and Distribution Conference andExposition, September 7 - 12, 2003, Dallas, USA.viii
ContentsAbstract ...............................................................................................vAcknowledgements ...........................................................................viiList of Publications..........................................................................viiiContents..............................................................................................ixChapter 1 Introduction ................................................................... 11.1 Background and Motivation ...................................................................... 11.2 Outline of the Thesis .................................................................................. 2Chapter 2 <strong>Power</strong> <strong>System</strong> Instability .............................................. 52.1 Angle Instability - <strong>Power</strong> Oscillations ....................................................... 52.1.1 Transient Angle Instability ................................................................ 52.1.2 Small-Signal Angle Instability .......................................................... 62.2 Voltage Instability ...................................................................................... 72.3 Frequency Instability ................................................................................. 92.4 The Relation Between Network Configuration and <strong>System</strong>Instability Phenomena .............................................................................. 10Chapter 3 <strong>Power</strong> <strong>System</strong> Instability andLocal Area <strong>Protection</strong> ................................................. 133.1 Distance <strong>Protection</strong> and Voltage Instability ............................................ 133.1.1 Distance <strong>Protection</strong> may Contribute <strong>to</strong> Voltage Instability ............ 133.1.2 Worldwide Experience on Voltage Collapse Related <strong>to</strong>Distance <strong>Protection</strong> ......................................................................... 163.2 Distance <strong>Protection</strong> and Transient Instability .......................................... 183.2.1 Distance <strong>Protection</strong> During Transient Instability ............................ 183.2.2 <strong>Power</strong> Swing Detec<strong>to</strong>rs - Out-of-Step <strong>Protection</strong> ........................... 223.2.3 Worldwide Experience on Distance <strong>Protection</strong> andTransient Instability ......................................................................... 28Chapter 4 <strong>Power</strong> <strong>System</strong> Instability and<strong>System</strong> <strong>Protection</strong> Schemes ........................................ 314.1 <strong>System</strong> <strong>Protection</strong> Schemes ..................................................................... 324.1.1 Event- and Response based SPS ..................................................... 344.1.2 Local-, Central-, Remote-, Limited Area andWide Area Applications .................................................................. 364.2 Detection and Control Indica<strong>to</strong>rs for <strong>System</strong> <strong>Protection</strong> Schemes .......... 384.2.1 Indica<strong>to</strong>rs <strong>to</strong> Determine Voltage Instability .................................... 384.2.2 Indica<strong>to</strong>rs <strong>to</strong> Determine Transient Angle Instability ....................... 414.2.3 Indica<strong>to</strong>rs <strong>to</strong> Determine Frequency Instability ................................ 434.3 Curative Measures for <strong>System</strong> <strong>Protection</strong> Schemes ................................ 444.4 <strong>System</strong> <strong>Protection</strong> Schemes in the Nordel <strong>System</strong> .................................. 47Chapter 5 Summary of Publications ........................................... 535.1 Paper A: An Adaptive Scheme <strong>to</strong> Prevent Undesirable Distance<strong>Protection</strong> Operation During Voltage Instability ..................................... 53ix
5.2 Paper B: A New <strong>Protection</strong> Scheme <strong>to</strong> Prevent Mal-trips due <strong>to</strong><strong>Power</strong> Swings ...........................................................................................535.3 Paper C: A Distance <strong>Protection</strong> Scheme <strong>to</strong> Prevent Mal-trips DuringAbnormal <strong>Power</strong> <strong>System</strong> Conditions .......................................................545.4 Paper D: A New Method Suitable for Real Time Genera<strong>to</strong>r CoherencyDetermination ...........................................................................................545.5 Paper E: A <strong>System</strong> <strong>Protection</strong> Scheme Concept <strong>to</strong> Counter Inter-AreaOscillations ...............................................................................................545.6 Paper F: An Emergency Strategy Scheme Based on ConventionalDistance <strong>Protection</strong> <strong>to</strong> Avoid Complete <strong>System</strong> Collapse .......................545.7 Other Publications Reported within the Scope of the Project ..................555.7.1 Licentiate thesis - Line <strong>Protection</strong> and <strong>Power</strong> <strong>System</strong> Collapse .....555.7.2 Technical Report - Present Status of <strong>System</strong> <strong>Protection</strong> Schemes ..55Chapter 6 Conclusions and Future Work ................................... 576.1 Conclusions ..............................................................................................576.2 Future Work .............................................................................................59References ........................................................................................61Appendix I Summary of Important SPS Features ........................77x
Chapter 1 IntroductionChapter 1: Introduction1.1 Background and MotivationAt about 13.00 hrs. on Tuesday December 27, 1983, the Swedishelectrical power system experienced the most severe disturbance of thelast 30 years. The blackout resulted in a number of projects by theutilities and universities where different aspects of the collapse wereinvestigated. Several projects analysed the behaviour of differentpower system elements such as genera<strong>to</strong>rs, transformers and loadswhile other projects were addressing numerical methods intended <strong>to</strong>analyse events similar <strong>to</strong> the collapse.These investigations of the 1983 blackout indicated that theperformance of the relay protection system might had been deficient.At the same time developments in computer and communicationtechnologies have significantly enhanced the potential for improvedprotection systems. As a result the project <strong>Protection</strong> <strong>Strategies</strong> <strong>to</strong><strong>Mitigate</strong> <strong>Major</strong> <strong>Power</strong> system <strong>Breakdowns</strong> was initiated by SvenskaKraftnät 1 in co-operation with Chalmers University of Technology.The aim of the project has been <strong>to</strong> investigate the performance of theexisting relay protection during abnormal operating conditions and <strong>to</strong>improve protection methods in order <strong>to</strong> avoid extensive systembreakdowns.The NORDEL system in Fig. 1.1 is a synchronous system involvingFinland, Norway, Sweden and the part of Denmark east of the GreatBelt. This system is connected <strong>to</strong> surrounding synchronized systems byHVDC interconnections. There are also two HVDC interconnectionswithin the Nordel system; one from the middle part of Sweden <strong>to</strong> thesouth part of Finland and one from the Swedish mainland <strong>to</strong> the islandof Gotland. The installed generation capacity for the NORDEL systemamounts <strong>to</strong> about 80 000 MW. Approximately 50 % is hydrogeneration and 50 % thermal generation (oil, coal and nuclear).In the Swedish electrical power system the main load centres arelocated in the central and south regions while a significant part of thegeneration is located in the north. The regions are separated byhundreds of km and thus the Swedish bulk power system involves1. Regula<strong>to</strong>r of the Swedish bulk power system.1
Chapter 1: Introductionlarge power transfers over long distances. Deregulation resulting in thedecommission of (small) power plants in the south part of Sweden hasfurther enhanced the radial characteristic of the system. Thepossibilities for local genera<strong>to</strong>r support in the case of abnormaloperating conditions have obviously been reduced. In addition anincreased variation of power flow directions has been experiencedduring recent years. As a result the main constraints for the NORDELsystem are represented by power system stability issues.The main ambition in this project has been <strong>to</strong> improve the protectionperformance during power system instability without jeopardizingfault clearance. During the first part of the project which wasconcluded by the licentiate degree, focus was given <strong>to</strong> local areaprotection schemes. Furthermore, in the second part concluded by thePh.D degree focus was given <strong>to</strong> extensive protection systems involvinglarge areas.1.2 Outline of the ThesisThis dissertation is organized in<strong>to</strong> two parts. The first part gives abackground <strong>to</strong> the relevant <strong>to</strong>pics while the second part includes sixpapers in which the main technical contributions from this project arepresented.The background and motivation for the thesis are given in Chapter 1while Chapter 2 summarizes power system instability phenomena.Chapter 3 and Chapter 4 discuss the relevant relations between powersystem instability and power system protection. Chapter 3 treats localarea protection while Chapter 4 discusses <strong>System</strong> <strong>Protection</strong> Schemes.Chapter 5 briefly introduces the papers enclosed in the second part ofthis dissertation. Finally, the conclusions and suggestions for futurework are presented in Chapter 6.At the end of part 1 an appendix and the references of the six firstchapters are included.2
Chapter 1: IntroductionThe power transmission networkin northwestern EuropeNThe Swedish grid, comprises mainly 220 and400 kV lines, switchyards and transformer stationsand foreign links for alternating (AC) and directcurrent (DC).Extend 2002Overhead line Cable400 kV AC 10643 km4 km275 kV AC 75 km–220 kV AC 4295 km–130 kV AC –7 kmHVDC (High Voltage DC) 115 km 476 kmNHydro power plantThermal power plant (CHP)Transformer or switching station750 kV line400 kV line300 kV line220 kV lineJoint operation link forvoltages below 220 kVPlanned/under constructionTunnsjødalRøssågaOfotenSvartisenMelfjordRanaKobbelvSaltenSwedenNarvikLuleRovaniemiKemiUleåborgTrondheimUmeåFinlandNeaVasa(220 kV)NorwaySundsvall(220 kV)TammerforsBergenStavangerRjukanKristiansandOsloHasleOlkiluo<strong>to</strong>HVDCForsmarkEnköpingS<strong>to</strong>ckholmNorrköpingRaumaViborgÅboLoviisaHelsingforsTalliEs<strong>to</strong>niaPaideTartRussiaNNHVDCDenmarkKassøFlensburKielHamburgGermanyHVDCHVDCLübecRos<strong>to</strong>cMalmöKarlshamnSlupskKrajnikRinghalsHelsingborgCøpenhagenHVDCGothen-OskarshamnGdansk0 100 200 kmLiepajaKlaipedaKaliningradPolandRigaLithuaniaKaunasBiastys<strong>to</strong>kLatviaIgnalinaVilniusN N N N N NBelorussiaBrestFigure 1.1The NORDEL system.3
4Chapter 1: Introduction
Chapter 2: <strong>Power</strong> <strong>System</strong> InstabilityChapter 2 <strong>Power</strong> <strong>System</strong> InstabilityIn this section a brief summery of power system instability is given.The different types of power system instability are further described byKundur [1] while attention here is given <strong>to</strong> instability aspects relevant<strong>to</strong> power system protection. In particular the focus is on the relationbetween grid configuration and system instability due <strong>to</strong> its importancein the case of protection applications. For simplicity the different typesof power system instability are discussed separately. During a severedisturbance some of these phenomena may occur simultaneouslythough.2.1 Angle Instability - <strong>Power</strong> OscillationsThe fundamental phenomena appearing in a power system in case ofangle instability are power oscillations. Depending on their severityand origin they are categorised as transient angle instability or smallsignalangle instability.Generally power oscillations can be divided in<strong>to</strong> three differentcategories; 1) local plant mode oscillations or inter machineoscillations with a frequency range of 0.7 - 2 Hz (6 Hz), 2) inter-areaoscillations, where groups of genera<strong>to</strong>rs are swinging against eachother in the frequency range of 0.4 - 0.7 Hz and 3) large sub-systemsoscillating against each other where the swinging frequency usually isin the order of 0.1 - 0.3 Hz.2.1.1 Transient Angle InstabilityAccording <strong>to</strong> Kundur transient stability is the ability of the powersystem <strong>to</strong> maintain synchronism when subjected <strong>to</strong> a severedisturbance such as a fault on transmission facilities, loss ofgeneration, or loss of a large load [1]. Usually this type of disturbancesleads <strong>to</strong> large excursions of genera<strong>to</strong>rs angles and significant changesin active and reactive power flows, bus voltages, system frequency andother system variables. Accordingly both the cus<strong>to</strong>mers and the powersystem are confronted <strong>to</strong> these features where they have a more or lessdeveloped transient characteristic. In case appropriate counteractionsare not taken transient instability may result in extensive power systemblackouts.5
Chapter 2: <strong>Power</strong> <strong>System</strong> InstabilityLoss of synchronism may include one single generating unit, a powerplant represented by multiple genera<strong>to</strong>rs, a region of the network orseveral interconnected regions. The loss of synchronism may occurduring the first swing after the disturbance or after a number ofdivergent oscillations. In the first case the mismatch between theelectrical and mechanical <strong>to</strong>rque is considered <strong>to</strong> be the main issuewhile insufficient damping is associated <strong>to</strong> loss of synchronism after afew swings.Lightly meshed networks, large power flows and long distance powertransport are features which contribute <strong>to</strong> transient angle instability.Accordingly tie-lines, bottlenecks and weak interconnections (betweendifferent countries) are typical sources of transient instability. Astransient instability includes large voltage and power variations, fasttripping of power system devices may be initiated due <strong>to</strong> undesirableprotection operation. This is especially true for some genera<strong>to</strong>r and lineprotection [2].2.1.2 Small-Signal Angle InstabilitySmall-signal stability is the ability of the power system <strong>to</strong> maintainsynchronism when subjected <strong>to</strong> small disturbances. In this context, adisturbance is considered <strong>to</strong> be small if the equations that describe theresulting response of the system may be linearized for the purpose ofanalysis [1]. Such disturbances happen all the time due <strong>to</strong> smallvariations in loads and generation. The physical response of the systemmay be a steady increase in ro<strong>to</strong>r angle due <strong>to</strong> lack of synchronizing<strong>to</strong>rque or ro<strong>to</strong>r oscillations of increasing amplitude due <strong>to</strong> lack ofsufficient damping <strong>to</strong>rque. Important <strong>to</strong> observe is that although theinitial phase can be described by linear behaviour the consequences ofthese oscillations could be non-linear.Measures <strong>to</strong> counteract small-signal instability are usually based onclosed-loop controls. These devices provide dynamic control ofelectric quantities of the power system. Typical examples of closedloopcontrol devices include genera<strong>to</strong>r excitation control, powersystem stabilizers (PSS), Static Var Compensa<strong>to</strong>rs (SVCs) and seriescapaci<strong>to</strong>rs with a closed-loop controlled varying capacitance. Closedloopcontrol devices are not included here as they fall outside the scopeof the project.Normally, power oscillations associated with small-signal stabilityhave amplitudes which are non-relevant <strong>to</strong> protection applications.Consequently, in this report we will exclusively discuss the interaction6
Chapter 2: <strong>Power</strong> <strong>System</strong> Instabilitybetween transient instability and protection applications. However, incase small-signal instability results in power oscillations relevant <strong>to</strong>protection applications the fundamental principles and relevant issuesapplicable <strong>to</strong> transient instability are also true for small-signalinstability.2.2 Voltage InstabilityVoltage stability is concerned with the ability of a power system <strong>to</strong>maintain acceptable voltages at all buses in the system under normalconditions and after being subjected <strong>to</strong> a disturbance. A system enters astate of voltage instability when a disturbance such as an increase inload demand or a change in system conditions causes a progressive anduncontrollable decline in voltage. The main fac<strong>to</strong>r causing instability isthe inability of the power system <strong>to</strong> meet the demand for reactivepower [1]. According <strong>to</strong> the time duration of load response, voltageinstability can roughly be divided in<strong>to</strong> two different categories; shorttermand long-term voltage instability. Induction mo<strong>to</strong>rs res<strong>to</strong>re theiractive power consumption within one second (short-term) while LoadTap Changers (LTCs) will res<strong>to</strong>re voltage dependent loads within one<strong>to</strong> several minutes (long-term). Also thermostatically controlled loadshave a recovery time in the range of minutes. In case of long-termvoltage instability genera<strong>to</strong>r current limiters may be activated <strong>to</strong>protect the genera<strong>to</strong>rs from thermal stresses. When current limiters areactivated the operating condition of the power system is often seriouslyaggravated. Particularly armature current limiter activation often leads<strong>to</strong> blackouts. In many situations the distinction between voltage andtransient instability is diffuse as aspects of both phenomena may existfor a single disturbance.Voltage instability may be caused by a variety of single and/or multiplecontingencies. Typical initiating events are heavy load pick-up andgrid weakening. Obviously genera<strong>to</strong>r tripping also contributes <strong>to</strong>voltage instability; especially tripping of genera<strong>to</strong>rs located close <strong>to</strong> theloads supporting the voltage control in that area. Genera<strong>to</strong>r trippingcan be the event which initiates voltage instability, but it may also bean accelerating element when it occurs some time in<strong>to</strong> a voltageinstability event.In case of short-term voltage instability the system may collapse withina few seconds after the disturbance if no curative measures are taken.7
Chapter 2: <strong>Power</strong> <strong>System</strong> InstabilityFor short-term voltage instability the fault clearing time may beessential as an induction mo<strong>to</strong>r dominated load, e.g air conditioning,may become unstable if the fault is present for a longer period.During long-term voltage instability the power system normallyreaches a quasi-stable low voltage operating point after the initialdisturbance. Because of the voltage drop LTCs will start <strong>to</strong> res<strong>to</strong>re thevoltage on regional transmission and distribution levels. In turn theloads recover which leads <strong>to</strong> increased system loading. Consequentlythe voltage will further decline and the LTCs will operate again <strong>to</strong>res<strong>to</strong>re the loads. This interaction between LTCs and increased systemloading continues while the voltage on the transmission level declinescontinuously. The reactive power demand of the system iscontinuously increasing as the voltage is decreasing. Eventually thereactive power demand cannot be supplied by the genera<strong>to</strong>rs and theircurrent limiters operate. At this moment the voltage decay acceleratessignificantly, which in turn leads <strong>to</strong> genera<strong>to</strong>r tripping due <strong>to</strong> lowvoltage and cascading line outages due <strong>to</strong> overload. The voltage decaydue <strong>to</strong> LTCs is obviously restricted <strong>to</strong> the operating range of the tapchangers.In case of a heavy load pick-up in a highly meshed network the crucialaspect with respect <strong>to</strong> voltage stability will initially be related <strong>to</strong>whether local genera<strong>to</strong>rs manage <strong>to</strong> meet the increased load demandwithout hitting their limits. As when the local units hit their limits,stability will depend on the capability of the surrounding system <strong>to</strong>provide active and reactive power. If the surrounding system is strongit will be able <strong>to</strong> support the highly loaded area successfully. However,if the surrounding system is weak a sufficient support will most likelynot be given and the situation may aggravate <strong>to</strong> a voltage collapse.Generally speaking the more circuits and the shorter the lengths of thecircuits in the grid, the stronger the network.When a long distance separates a load centre from a significant amoun<strong>to</strong>f supply, a grid weakening between the two areas may lead <strong>to</strong> voltageinstability. The remaining grid may not have the capability <strong>to</strong> transportthe required power at a sufficient voltage level, which in turn increasesthe reactive power demand from the system and the tap-changerinteraction as discussed above. Moreover this may lead <strong>to</strong> genera<strong>to</strong>rshitting their limits, cascading lines outages because of (distance) relaysoperating on overload and eventually <strong>to</strong> a collapse.8
Chapter 2: <strong>Power</strong> <strong>System</strong> InstabilityThe case where genera<strong>to</strong>rs located close <strong>to</strong> loads are tripped is similar<strong>to</strong> the case of a heavy load increase. Also in this case the stability willbe decided by the capability of the surrounding system <strong>to</strong> provideactive and reactive power <strong>to</strong> the area lacking generation.To summarize, voltage instability is especially likely for systemconfigurations where large amounts of power have <strong>to</strong> be transportedlong distances in a lightly meshed network as in the case for weakinterconnections between remote generation areas and load centres.In addition <strong>to</strong> the network configuration also the following aspects areimportant as far as voltage stability is concerned:•Active and reactive power reserves. For example, genera<strong>to</strong>rs,synchronous condensers and SVCs. Both the amount of availablereactive power and the location are important.•Passive reactive power reserves such as capaci<strong>to</strong>rs.•<strong>System</strong> loading levels. High loading levels are critical.•Low power fac<strong>to</strong>r.•Load characteristics. Especially the load recovery due <strong>to</strong> LTCoperation as discussed above (or thermostatic heating).2.3 Frequency InstabilityFrequency stability describes the ability of a power system <strong>to</strong> maintainthe system frequency within an acceptable range during normaloperating conditions or after a severe disturbance. Thus frequencyinstability occurs when there is a mismatch between load and supplyand the system cannot compensate for this mismatch before thefrequency reaches an unacceptable value. Typical events which maylead <strong>to</strong> frequency instability are major outages of generating units andsplitting of the system in<strong>to</strong> isolated areas.In case normal frequency control measures fail <strong>to</strong> maintain thefrequency within an acceptable range, it is still important <strong>to</strong> limitfrequency excursions. Especially genera<strong>to</strong>rs are sensitive <strong>to</strong> fairlysmall frequency deviations. Normally genera<strong>to</strong>rs can operate within aband of ±0.5 Hz related <strong>to</strong> nominal frequency (50 and 60 Hz systems)without any restrictions. Additionally genera<strong>to</strong>rs can operate outside9
Chapter 2: <strong>Power</strong> <strong>System</strong> Instabilitythese values for a limited time period given by manufacturingconstraints.Publication [3] refers <strong>to</strong> an example of typical steam turbine limitationsduring abnormal frequency conditions where the worst case limitationshave been specified by five turbine manufactures with respect <strong>to</strong> 60 Hzoperation [4]. The example indicates that operation between 58.5 and57.9 Hz is permitted for ten minutes during the genera<strong>to</strong>r life timebefore turbine blade damage is probable. Note that steam turbines maybe considered <strong>to</strong> be the weakest link with respect <strong>to</strong> low frequencyoperation. In Sweden thermal power units are tripped around 47.5 Hz<strong>to</strong> protect the steam turbines against detrimental vibrations. The hydrounits in operation are more robust and can handle operatingfrequencies down <strong>to</strong> 45 Hz [5].Due <strong>to</strong> its nature protection applications responding <strong>to</strong> frequencyinstability are normally rather straightforward. For example, unitdevices protecting equipment from damage in the case of frequencyexcursions should respond <strong>to</strong> a certain frequency deviation present fora specified duration. Accordingly, simple frequency relays withsettings relevant <strong>to</strong> the current application can be used. Similarly theprocess for <strong>System</strong> <strong>Protection</strong> Schemes responding <strong>to</strong> frequencyinstability is also straightforward, although extensive settingprocedures in order <strong>to</strong> obtain the optimal curative measures may berequired. Hence, no further attention is explicitly given <strong>to</strong> frequencyinstability in this dissertation. Still there is a close relationship betweenfrequency- and transient instability and as far as undesirable distanceprotection performance is concerned, the discussion in section 3.2 isalso relevant <strong>to</strong> events involving frequency instability.2.4 The Relation Between Network Configuration and<strong>System</strong> Instability PhenomenaAs indicated above the network configuration where large amounts ofpower have <strong>to</strong> be transported long distances over weakinterconnections is vulnerable with respect <strong>to</strong> power system instability.In Table 2.1 1 a rough classification has been made with respect <strong>to</strong> therelation between network configuration and the different power systeminstability phenomena. The different system structures can roughly be1. The table was originally introduced in [3].10
Chapter 2: <strong>Power</strong> <strong>System</strong> Instabilitydivided in<strong>to</strong> densely meshed transmission systems with dispersedgeneration and demand or lightly meshed transmission systems withlocalised centres of generation and demand. Furthermore the couplingof the local sub-system <strong>to</strong> the surrounding system can also be given aclassification. The first characteristic includes transmission systemswhich are parts of larger power networks. The second characteristicincludes transmission systems that are not synchronouslyinterconnected with neighbouring systems or the largest partner in thecurrent power network.Table 2.1: The relation between network configuration and powersystem instability phenomena.Sub-system being apart of a large powernetworkSeparate systems notsynchronouslyinterconnected <strong>to</strong>other systems.<strong>System</strong>s by far thelargest sub-system ina power networkDensely meshed systemwith dispersedgeneration and demandSmall-signal instabilityThermal overloadNo large frequencyvariationsThermal overloadLarge frequencyvariationLightly meshed systemwith localised centres ofgeneration and/ordemandTransient instabilitySmall-signal instabilityVoltage instabilityTransient instabilityVoltage instabilityLarge frequency variation11
12Chapter 2: <strong>Power</strong> <strong>System</strong> Instability
Chapter 3: <strong>Power</strong> <strong>System</strong> Instability and Local Area <strong>Protection</strong>Chapter 3 <strong>Power</strong> <strong>System</strong> Instability and LocalArea <strong>Protection</strong>During a power system instability the presence of negative or zerosequence currents is usually limited. Therefore, protection schemesresponding <strong>to</strong> unbalanced operation should be unaffected by instabilityevents. Most relays respond <strong>to</strong> a quantity directly linked <strong>to</strong> the safeoperation of the particular system component protected by the relayunit. Irrespective of the surrounding system status, the relay shouldoperate when the relay criteria reach the tripping level(s) in order <strong>to</strong>avoid equipment damage. Also this type of protection devices is of lessimportance as far as power system instability is concerned. Finally,there is a class of relays responding <strong>to</strong> the impedance calculated frommeasured voltages and currents. Distance protection belongs <strong>to</strong> thisclass and is mainly used as line protection, but can also be utilized forgenera<strong>to</strong>rs. For genera<strong>to</strong>rs the impedance protection is used againstinternal short circuit- and/or loss of excitation. Genera<strong>to</strong>r impedanceprotection is of less concern with respect <strong>to</strong> power system instabilitydue <strong>to</strong> limited reach and its reverse characteristic. However, in the caseof strong transmission networks the concerns associated <strong>to</strong> transientinstability and line distance protection may be more relevant <strong>to</strong> thegenera<strong>to</strong>r protection. In this chapter the focus is on line distanceprotection as all relevant phenomena are then included. At the sametime identical fundamental concepts can be applied on any relevantissue involving genera<strong>to</strong>r impedance protection.3.1 Distance <strong>Protection</strong> and Voltage InstabilityHere the performance of distance protection during long term voltageinstability is discussed. The behaviour of distance protection duringshort term voltage instability is similar <strong>to</strong> the performance duringtransient instability. For the relation between short term voltageinstability and distance protection the reader is referred <strong>to</strong> section 3.2.3.1.1 Distance <strong>Protection</strong> may Contribute <strong>to</strong> Voltage InstabilityOne can define 10 distinct types of possible short circuit faults in athree phase power system [6]. In order <strong>to</strong> calculate the correct faultdistance for all types of faults, different voltage and current signals areused by the distance relay. Basically two types of equations areapplied. For three phase faults and phase <strong>to</strong> phase faults (3.1) is used13
Chapter 3: <strong>Power</strong> <strong>System</strong> Instability and Local Area <strong>Protection</strong>where L1 and L2 are the faulted phases. Equation (3.2) is valid forphase <strong>to</strong> ground fault involving phase L1.U L1 – U L2Z r = -------------------------I L1 – I L2(3.1)Z r=U L1-----------------------------------------Z 0 – Z 1I L1 + ----------------- ⋅ I 0Z 1(3.2)U L1 , U L2 : Phase voltages at the relay location.I L1 , I L2 : Phase currents at the relay location.I 0 : Residual (zero sequence-) current at the relay location.Z 1 : Positive sequence impedance for the primary protected circuit.Z 0 : Zero sequence impedance for the primary protected circuit.Z r : the apparent impedance as seen by the distance relay.Voltage instability is a phase symmetrical phenomenon. Hence no zerosequence component is present and the phase voltages and currents aresymmetrical. Thus the apparent impedance Z r as seen by a distancerelay during voltage instability is given in (3.3). Here U is the line <strong>to</strong>line voltage and P and Q are the injected active and reactive power atthe location of the relay.Z r=U L1--------- =I L1U 2 ⋅ ( P + jQ)-----------------------------------P 2 + Q 2(3.3)14
Chapter 3: <strong>Power</strong> <strong>System</strong> Instability and Local Area <strong>Protection</strong>In case Z r remains within the area of one of the pre-defined trippingzones during a time exceeding the setting of the timer associated <strong>to</strong> thezone, the relay will operate. Low system voltages and high (reactive)power flows are typical for voltage instability events. It follows from(3.3) that these events will lead <strong>to</strong> a reduced apparent impedance whichin turn may result in undesirable relay operation. This behaviour isnormally devastating as the system already is in a critical operatingcondition.Case a in Fig. 3.1 corresponds <strong>to</strong> a short circuit fault while case bcorresponds <strong>to</strong> a scenario where the zones of operation are slowly(seconds <strong>to</strong> minutes) approached from outside as the voltage decreasesand/or the reactive power increase. Undesirable relay operations due <strong>to</strong>voltage instability will then mainly be initiated by the zone with thelongest reach. Normally this is the zone used for remote back-upprotection; i.e zone 3. In some applications start elements are appliedwhich have a longer reach than the zone 3. However, they can usuallynot trip the line but only activate the tripping elements.The sensitivity for mal-trips due <strong>to</strong> voltage instability is depending onthe length of protected lines, the relay characteristic, the devices used<strong>to</strong> prevent load encroachment, the safety margins concerning overloadand the robustness of the system. Also the protection philosophy in thesetting process of the distance relay with the longest reach is important;is dependability or security emphasized?Paper A proposes a method <strong>to</strong> avoid incorrect distance relay tripping inthe case of voltage instability.15
Chapter 3: <strong>Power</strong> <strong>System</strong> Instability and Local Area <strong>Protection</strong>1.210.8X [pu]0.60.4t=100st≈50sb0.2t=0s0−0.2duringfault−0.4 −0.2 0 0.2 0.4 0.6 0.8 1 1.2R [pu]abeforefaultFigure 3.1Apparent impedance as seen by a distance relay during differentpower system events. a: Short circuit fault involving the primaryprotected circuit. b: A case where the voltage linearly decreasesfrom U=1 pu <strong>to</strong> U=0.8 pu and the reactive power linearlyincreases from Q=0 pu <strong>to</strong> Q=1 pu during a time interval of 100 s.The injected active power is held constant at P=1 pu.3.1.2 Worldwide Experience on Voltage Collapse Related <strong>to</strong>Distance <strong>Protection</strong>Undesirable distance protection operations during long term voltageinstability have contributed <strong>to</strong> blackouts worldwide. About 52 secondsafter the initiating event in the Swedish blackout in 1983 [7-11], at avoltage level of approximately 300 kV, a distance relay located in thereceiving end of the long distance transmission line between Kilforsenand Hallsberg operated. Roughly 1 second later cascading outagesfollowed and almost instantaneously south Sweden experienced ablackout. About 65% of the pre-fault load was lost. As distanceprotection usually is directional it may seem a bit remarkable that therelay in the receiving end of the line between Kilforsen and Hallsbergoperated. However the relay was operated in such a way that when theapparent impedance remained within the start zone for a time longer16
Chapter 3: <strong>Power</strong> <strong>System</strong> Instability and Local Area <strong>Protection</strong>than 3.2 seconds without relay operation, the start element aloneinitiated tripping. In such a case the relay behaved as a non-directionalunit with a long reach having a circular impedance characteristic,where operation due <strong>to</strong> load encroachment was not obstructed.On July 2, 1996 the WSCC system was operated within its transferlimits and only a few facilities were out of service [12-14]. Due <strong>to</strong> asingle phase <strong>to</strong> ground fault resulting in remedial actions, and incorrectrelay operation as a result of mechanical failure the system wassignificantly weakened. About 24 seconds after the initial fault animportant 230 kV line tripped through its zone 3 relay due <strong>to</strong> moderateoverload and moderate voltage depression. Cascading outages resultedand approximately 10 seconds later the system had separated in<strong>to</strong> fiveelectrical islands. About 2 million cus<strong>to</strong>mers were affected by thedisturbance. Furthermore, a zone 3 distance relay operated incorrectlyduring the res<strong>to</strong>rative process due <strong>to</strong> load encroachment and delayedthe res<strong>to</strong>ration of the system.On March 11, 1999, Brazil [15] faced the most severe powerinterruption in its his<strong>to</strong>ry. About 72 % of the pre-disturbance loadamounting <strong>to</strong> 34 200 MW was affected. The initiating event of theblackout was a phase <strong>to</strong> ground fault in a substation which led <strong>to</strong> theloss of five incoming 440 kV lines. The system survived thiscontingency and recovered <strong>to</strong> a quasi stable operating point. About 12seconds after the phase <strong>to</strong> ground fault another line tripped. Cascadingoutages followed and approximately 18 seconds later the entirenetwork collapsed. The tripping of the line after 12 seconds wasinitiated by the start unit of the distance protection. The start unit hadthe longest reach of all zones of operation <strong>to</strong> provide remote back-upfor all adjacent lines which are much longer than the given line. Thestart unit had been given a setting corresponding <strong>to</strong> a very long reachwith an associated time delay of 1.5 seconds. Hence, when the lineloading increased after the initial fault and likely in combination withan increasing reactive power demand throughout the entire system, theapparent impedance entered the start zone and the relay operated.Further examples where undesirable (zone 3) distance protectionoperations have contributed <strong>to</strong> blackouts include the ¨November 9,1965 Northeastern U.S/Canada disturbance and the August 22, 1987Western Tennessee U.S blackouts [16].17
Chapter 3: <strong>Power</strong> <strong>System</strong> Instability and Local Area <strong>Protection</strong>3.2 Distance <strong>Protection</strong> and Transient Instability<strong>Power</strong> oscillations are inherent <strong>to</strong> power systems. They may resultfrom any power system event such as line switching, short circuitfaults, genera<strong>to</strong>r tripping or load shedding. During normal operationthe magnitude of the oscillations are usually small and quicklyattenuated. However, during abnormal operation the oscillations can besevere and are in some cases of an increasing nature. In this section therelation between power oscillations and distance protection isexamined.3.2.1 Distance <strong>Protection</strong> During Transient InstabilityReferring <strong>to</strong> the frequency range of power oscillations given in 2.1power oscillations may be the source of incorrect relay behaviour asthe cycle times of the oscillations are in the same time range as thetimer settings of the protection devices.The two machine system in Fig. 3.2 can be used <strong>to</strong> analyse theperformance of distance protection during power oscillations. Themachines are interconnected through a 200 km long transmission lineand they are represented by voltage sources with constant magnitudebehind their transient reactance. By studying the apparent impedanceas seen by a relay located at C for different transfer angles the effect ofpower oscillations can be examined. The analysis made in this sectionis similar <strong>to</strong> the one given by Kundur in [1].E A∠δAX ASU CCIZ L = Z L∠εU DDE B∠0XBBSGenera<strong>to</strong>r AGenera<strong>to</strong>r BFigure 3.2Two machine system.18
Chapter 3: <strong>Power</strong> <strong>System</strong> Instability and Local Area <strong>Protection</strong>In Fig. 3.2, E A and E B are the internal voltages of the machines andX AS and X BS are the transient reactances. E B is assumed <strong>to</strong> be thereference phasor and δ represents the angle by which E A leads E B .Hence the current I is given in (3.4) and the voltage U C in (3.5).I=E A ∠δ– E B ∠0------------------------------------------jX AS + Z L + jX BS(3.4)U C = E A ∠δ– jX AS I(3.5)The apparent impedance as seen by the relay at C during phasesymmetrical operation can be determined when (3.4) and (3.5) areinserted in<strong>to</strong> (3.6).Z C=U C------- =IE A ∠δ-------------- – jX ASI(3.6)Z C =E A ∠δ– jX AS + ( jX AS + Z L + jX BS ) ⋅ -----------------------------------E A ∠δ– E B ∠0(3.7)Fig. 3.3 shows the locus of Z C as a function of the transfer angle δ inthe RX-diagram when different ratios of the magnitude of the internalvoltages of the genera<strong>to</strong>rs are applied in (3.7). The zones of operationof the relay are set <strong>to</strong> cover 80%, 120% and 200% of the line length,respectively.During a power swing the transfer angle δ will vary. For a stable swing,δ gradually increases until the maximum value is reached where thetrajec<strong>to</strong>ry shifts direction and δ decreases until the minimum value isreached where the trajec<strong>to</strong>ry ones again shifts direction. This sequenceof events is repeated until the oscillations are damped out. If thetrajec<strong>to</strong>ry of δ reaches beyond 180 degrees the swing can beconsidered <strong>to</strong> be unstable.19
Chapter 3: <strong>Power</strong> <strong>System</strong> Instability and Local Area <strong>Protection</strong>0.15E A>E Bδ=180°0.1δ=90°δ=60°X C [pu]0.050E A = E Bδ=350°Z C Locus−0.05E A
Chapter 3: <strong>Power</strong> <strong>System</strong> Instability and Local Area <strong>Protection</strong>circles with their centres on the extensions of the impedance line AB incase the internal voltage magnitude differ. For E > E A Bthe electricalcentre will be above the impedance centre while it will be below when< .E AE BE A>E BX C [pu]E A = E B<strong>System</strong> impedancejX AS +Z L +jX BSBX BSDE A
Chapter 3: <strong>Power</strong> <strong>System</strong> Instability and Local Area <strong>Protection</strong>associated <strong>to</strong> the start element the impedance can enter, leave and reenterthe zones of operation unlimited times and the timer will in anycase continue <strong>to</strong> count. This means that a tripping signal is generatedimmediately when the zone of operation is entered after the timer hasexpired. If the start element has a shape which surrounds all thetripping zones the area which decides the likelihood for mal-trips due<strong>to</strong> power swings has increased. Therefore it is very important <strong>to</strong> takethis effect in<strong>to</strong> account when power oscillations are considered withrespect <strong>to</strong> undesirable distance protection operations.Fig. 3.3 and Fig. 3.4 illustrate the impedance trajec<strong>to</strong>ries for a relaylocated in the sending end of a line. The trajec<strong>to</strong>ries for the receivingend are identical but reversed.Observe that the assumption made above where the internal machinereactance and voltages are given fixed values is a rough reflection ofthe system behaviour suitable for illustration. In real operation theelectrical centres are non-fixed points as the internal machineimpedances and voltages will vary during dynamic conditions.Distance protection should not operate for stable swings. However, inthe case of unstable power swings the protection system should operate<strong>to</strong> divide the system in<strong>to</strong> stable sub-systems or <strong>to</strong> separate the ”sick”part of the system from the ”healthy” parts. The issue is furtherdiscussed in the next section.3.2.2 <strong>Power</strong> Swing Detec<strong>to</strong>rs - Out-of-Step <strong>Protection</strong>Different approaches for <strong>Power</strong> Swing Detec<strong>to</strong>rs and Out-of-Step<strong>Protection</strong> have been suggested throughout the years. In [17] a method<strong>to</strong> avoid mal-trips due <strong>to</strong> high frequency (above 6 Hz) power swings isproposed based on the phase angle of the voltages at the line terminalsand at the fault location. The method is restricted <strong>to</strong> avoid zone 1 maloperationsdue <strong>to</strong> power swings. Another indica<strong>to</strong>r is proposed in [18-20] where tripping is prevented if the rate of change of an electricquantity exceeds a threshold value. In [21] decision trees are used <strong>to</strong>classify a transient swing on the basis of real-time phasormeasurement. Furthermore, neural networks are used in [22] <strong>to</strong> detectpower swings. An adaptive out-of-step relay is proposed in [23,24]which uses the equal area criterion and GPS technology. Also thealgorithm introduced in [25] applies the equal area criterion <strong>to</strong> assessthe stability of the genera<strong>to</strong>rs and determine when pole-slipping willoccur. In [26] circle fitting and parameter estimation are applied <strong>to</strong>discriminate power swings from faults. However, the most common22
Chapter 3: <strong>Power</strong> <strong>System</strong> Instability and Local Area <strong>Protection</strong>method used for <strong>Power</strong> Swing Detec<strong>to</strong>rs and Out-of-Step <strong>Protection</strong> isbased on the transition time through a blocking impedance area in theRX-diagram.<strong>Power</strong> Swing Detec<strong>to</strong>rs (PSD)X [Ω]Pre-disturbanceX [Ω]R [Ω]R [Ω]Post-disturbanceFigure 3.5Vertical and circular characteristics for <strong>Power</strong> Swing Detec<strong>to</strong>rschemes. The dashed lines indicate trajec<strong>to</strong>ries for the apparentimpedance during a power swing. The left scheme is operated atthe sending end of a line and the right scheme is located at thereceiving end of a line.Basically the method uses the feature that the movement of theapparent impedance during power swings is slow as compared <strong>to</strong> itsmovement for short circuit faults. Fig. 3.5 shows two differentcharacteristics of <strong>Power</strong> Swing Detec<strong>to</strong>r (PSD) schemes. When theapparent impedance penetrates the outer circle or line of the PSDschemes a timer is started. If the impedance crosses the grey area veryrapidly the PSD determines a short circuit fault and tripping ispermitted. If the transition time for the apparent impedance through thegrey area exceeds the pre-set timer value, the tripping function isblocked during a certain time. Usually the pre-set value for the timeramounts <strong>to</strong> about 80 ms and tripping is blocked during a couple ofseconds.23
Chapter 3: <strong>Power</strong> <strong>System</strong> Instability and Local Area <strong>Protection</strong>A circular PSD device is discussed in [27] where the inner circle iscomposed by the outermost zone of operation i.e zone 3. In order <strong>to</strong>cater for the fastest possible swings the outer circle is normally set witha reach as large as possible and consistent with load discrimination.However, <strong>to</strong> achieve satisfac<strong>to</strong>ry performance the reference asserts thatthe outer circle should have a diameter of at least 1.3 times thediameter of the outermost zone of operation.In some protection schemes the PSD is used alone. This means that thedistance relays will not operate due <strong>to</strong> stable power swings but neitherthe unstable power swings will be controlled. Thus some device isneeded as a supplement <strong>to</strong> the PSD <strong>to</strong> distinguish stable power swingsfrom unstable ones so that adequate relay action can be obtained. Thiscan be achieved by adding an additional circle (mho relay) or line(blinder) <strong>to</strong> the characteristics in Fig. 3.5. If the PSD has detected apower swing, the Out-of-Step Characteristic (OSC) is activated <strong>to</strong>decide if the swing is stable or unstable. The location of the line andcircle related <strong>to</strong> the OSC in Fig. 3.6 is usually determined bysimulating numerous power swing cases [6]. The impedance trajec<strong>to</strong>ryas seen by the distance relay for each of the stable cases is analysed. Itwill be found that all stable swings come no closer than a certainminimum distance from the origin in the RX-diagram. In order <strong>to</strong>detect unstable swings the OSC is usually given a position at a shorterdistance from the origin than the minimum distance obtained from thesimulations. When the PSD in Fig. 3.6 detects a power swing thedistance relay waits for the apparent impedance <strong>to</strong> pass the OSC. If theswing is stable the OSC is not passed and the relay is inactivated whileif the swing is unstable the OSC will be penetrated and the relayinitiates tripping.24
Chapter 3: <strong>Power</strong> <strong>System</strong> Instability and Local Area <strong>Protection</strong><strong>Power</strong> Swing Detec<strong>to</strong>rs (PSD)X [Ω]X [Ω]R [Ω]R [Ω]Out-of-Step Characteristic (OSC)Figure 3.6<strong>Power</strong> Swing Detec<strong>to</strong>rs and Out-of-Step scheme for relayslocated at the sending end.Sometimes the inner circle or the inner line of the PSDs in Fig. 3.5 isapplied as the boundary for stable swings. When the apparentimpedance passes the outer circle or line the timer is started. If theinner circle or line is penetrated shortly after the timer is started thedevice declares a short circuit fault. Alternatively, if the inner circle orline is not passed the device declares a stable swing while in case theinner line or circle is penetrated after the timer has expired the devicesignals an unstable swing. However, depending on the systemconfiguration nearby the relay this solution may not be acceptable withrespect <strong>to</strong> line length, fault clearing, load discrimination and the natureof possible power swings.If the line flow may occur in both directions the PSD and the OSCmust be duplicated; one application for sending and one for receivingoperating conditions. The application for the receiving operatingcondition looks similar as for the devices in Fig. 3.6 but is located onthe opposite side of the tripping characteristic.25
Chapter 3: <strong>Power</strong> <strong>System</strong> Instability and Local Area <strong>Protection</strong>The system in Fig. 3.7 can be used <strong>to</strong> study the influence of the sourceimpedance on the apparent impedance as seen by a relay located at busT during power swings. In the system one genera<strong>to</strong>r is connected <strong>to</strong> aninfinite system through a single transmission line. In Fig. 3.8 twodifferent swing loci as seen by the relay are illustrated where the ratiobetween the impedance of the transmission line and the sourceimpedance is varied.E∠δIBAZ sGenera<strong>to</strong>r andStep-up transformerTZ L = Z L∠εS k=U n∞Figure 3.7A genera<strong>to</strong>r connected <strong>to</strong> an infinite system through atransmission line.Fig. 3.8 indicates that for genera<strong>to</strong>rs connected <strong>to</strong> the main gridthrough a weak interconnection (large line impedance) the electricalcentre may appear on the transmission line. However, for genera<strong>to</strong>rsconnected via a strong grid the electrical centre will be in the step-uptransformer or in the genera<strong>to</strong>r itself. Although power oscillations aremainly relevant in the case of weak connections, they may also bepresent in strong line configurations. Consequently, the <strong>Power</strong> SwingDetec<strong>to</strong>r and the Out-of-Step Characteristic included in the lineprotection may be incapable <strong>to</strong> detect swings in the case of this type ofline configurations. To cope with the phenomenon the Genera<strong>to</strong>r Ou<strong>to</strong>f-Step<strong>Protection</strong> is introduced. The Genera<strong>to</strong>r Out-of-Step <strong>Protection</strong>[28] operates similar <strong>to</strong> Out-of-Step <strong>Protection</strong> for transmission linesand is used <strong>to</strong> clear unstable swings when the electrical centre is withinthe genera<strong>to</strong>r or step-up transformer. Note that line protection schemesmay be unaffected by the phenomenon as certain (mho) distance relaysinherently adjust their tripping zones with respect <strong>to</strong> the sourceimpedance [29].26
Chapter 3: <strong>Power</strong> <strong>System</strong> Instability and Local Area <strong>Protection</strong>In addition <strong>to</strong> the source impedance also a low excitation level tends <strong>to</strong>contribute <strong>to</strong> an impedance trajec<strong>to</strong>ry through the step-up transformeror the genera<strong>to</strong>r. See the case in Fig. 3.3.E A
Chapter 3: <strong>Power</strong> <strong>System</strong> Instability and Local Area <strong>Protection</strong>3.2.3 Worldwide Experience on Distance <strong>Protection</strong> andTransient InstabilityIn this paragraph a few relevant events are briefly discussed. The datapresented were obtained from a survey carried out by CIGRÉ WG34.09. On July 27, 1989 in Portugal a <strong>Power</strong> Swing Detec<strong>to</strong>r failed <strong>to</strong>operate and on August 24, 1993, in Spain three distance relaysoperated due <strong>to</strong> power swings as the swings had a higher frequencythan the effective range of the blocking unit. Furthermore, on July 18,1995 the WSCC system was subjected <strong>to</strong> incorrect out-of-stepblocking during non-three phase faults. The location of the out-of-stepprotection was the main reason for inadequate performance during adisturbance in South Africa on June 7, 1996.In Florida [30] and in South Africa [31] incorrect relay behaviourduring power swings has been (and still is) a major concern.An unwarranted distance relay operation due <strong>to</strong> a power swing was theimmediate reason for the system breakdown in the south-western par<strong>to</strong>f Sweden and Denmark in 1956 [32]. As a result power oscillationsand associated protection measures were given significant attention.However, apart from a limited number serving interconnectionsbetween Sweden and the other Nordic countries, all <strong>Power</strong> SwingDetec<strong>to</strong>rs were taken out of service in the middle of the seventies. Tothe author’s knowledge no formal investigation was carried out and thedecision was most likely based on the following arguments. As thetransmission system recently had been reinforced power oscillationswere not expected <strong>to</strong> cause any trouble and PSDs were thereforeconsidered unnecessary. In addition some doubts were addressed<strong>to</strong>wards their operational reliability. The general opinion is that poweroscillations were rare in the Swedish transmission system during thisperiod and the removal of the PSDs was never questioned. However, inthe late evening of the New Years day, 1997, the Nordic power systemwas subjected <strong>to</strong> serious inter-area oscillations. The oscillationsresulted from a busbar fault coincident with large power flows in anunusual direction. A few genera<strong>to</strong>r units and lines were lost but no loadwas affected. However, a couple of distance relays were very close <strong>to</strong>trip due <strong>to</strong> the impedance swings. In case these relays had orderedtripping a disturbance similar <strong>to</strong> the 1983 [11] had most likelyoccurred. In case PSDs had been in service, the risk of incorrect relayoperation due <strong>to</strong> the swings had been eliminated. The number ofrecorded oscillation events has increased significantly during recentyears in the Swedish power system. In 1996 the annual number of28
Chapter 3: <strong>Power</strong> <strong>System</strong> Instability and Local Area <strong>Protection</strong>recorded inter-area oscillation events amounted <strong>to</strong> about 15 while inthe year 2000 this number had increased <strong>to</strong> more than 300 [33]! In fact,in a few cases, operating conditions have occurred where the systemwas close <strong>to</strong> its limits and on the brink of a severe disturbance. Notethat about 30 % of the events recorded in 2000 were related <strong>to</strong> onespecific maintenance job lasting a period of three weeks.29
30Chapter 3: <strong>Power</strong> <strong>System</strong> Instability and Local Area <strong>Protection</strong>
Chapter 4: <strong>Power</strong> <strong>System</strong> Instability and <strong>System</strong> <strong>Protection</strong> SchemesChapter 4 <strong>Power</strong> <strong>System</strong> Instability and <strong>System</strong><strong>Protection</strong> SchemesThe protection schemes discussed here are intended <strong>to</strong> counter extremecontingencies and normally involve dispersed system devices fordetection, data acquisition and curative measures. These schemes arereferred <strong>to</strong> by different names e.g ”<strong>System</strong> <strong>Protection</strong> Scheme”, ”WideArea <strong>Protection</strong> Scheme”, ”Special <strong>Protection</strong> Scheme”, ”ContingencyArming Scheme”, ”Discrete Supplementary Controls” and ”RemedialAction Scheme”. Normally the expression ”Wide Area <strong>Protection</strong>Scheme” is exclusively used for schemes introduced <strong>to</strong> countercomplex and large phenomena which may jeopardise the integrity ofthe whole system. Other expressions may range from very localschemes <strong>to</strong> extensive wide area schemes. In a recent report [3]published by CIGRÉ, TF 38.02.19 the term ”<strong>System</strong> <strong>Protection</strong>Scheme” has been selected and will also be used throughout this thesis.<strong>System</strong> <strong>Protection</strong> Schemes are an attractive alternative for increasingthe utilisation of electrical power systems. First of all the economicalaspects are in favour of <strong>System</strong> <strong>Protection</strong> Schemes as control andprotection equipment are less expensive than EHV hardwareequipment. Furthermore, <strong>System</strong> <strong>Protection</strong> Schemes can mitigatewide area disturbances effectively. Finally, the environmental aspectsof <strong>System</strong> <strong>Protection</strong> Schemes are appealing as no new line corridorsare required. The fast progress during recent years within the area ofnumerical and communication technologies has increased the potentialof technically complex and cost-effective <strong>System</strong> <strong>Protection</strong> Schemes.The ability <strong>to</strong> acquire and process wide area data has also improvedsignificantly. The Phasor Measurement Unit [34-36] and inexpensivefibre optics are two attributes which have simplified the realization ofthese features. Particularly the reliability can be improved if compared<strong>to</strong> older solutions. Moreover there is a trend <strong>to</strong>day that protection andcontrol functions are merged <strong>to</strong>gether in sophisticated substation andcontrol units. This process also facilitates <strong>System</strong> <strong>Protection</strong> Schemes.Extensive surveys over <strong>System</strong> <strong>Protection</strong> Schemes have been made byboth Cigré and IEEE [3,37-39]. In addition a number of detailedpublications over specific <strong>System</strong> <strong>Protection</strong> Schemes [40-44] andrelated subjects [45-56] have been published. The material in thischapter is <strong>to</strong> a large extent based on these publications. Appendix 1gives a general overview with respect <strong>to</strong> the relations between differentpower system events, type of system, network configurations, curative31
Chapter 4: <strong>Power</strong> <strong>System</strong> Instability and <strong>System</strong> <strong>Protection</strong> Schemesmeasures and the indica<strong>to</strong>rs <strong>to</strong> be used <strong>to</strong> detect abnormal operatingconditions and initiate the curative measures. The appendix can beconsidered as a summary of the material published in this chapter.4.1 <strong>System</strong> <strong>Protection</strong> SchemesConventional power system protection is mainly used <strong>to</strong> protect powersystem equipment from damage while the fundamental aim of <strong>System</strong><strong>Protection</strong> Schemes is <strong>to</strong> protect the power system against partial or<strong>to</strong>tal breakdown. To obtain this objective protective measures are takenwhen abnormal operating conditions are identified. For these occasionsno ”traditional fault situation” is present but the system itself may be intransition <strong>to</strong> a dangerous situation such as a wide area disturbance or acomplete system blackout. Accordingly the protective measures areused <strong>to</strong> counteract this transition and bring the system back <strong>to</strong> a safeoperating condition.In [3] the following definition is given, ”A <strong>System</strong> <strong>Protection</strong> Scheme isdesigned <strong>to</strong> detect abnormal system conditions and takepredetermined, corrective action (other than the isolation of faultedelements) <strong>to</strong> preserve system integrity and provide acceptable systemperformance” and in [37] ”A <strong>System</strong> <strong>Protection</strong> Scheme is a protectionscheme that is designed <strong>to</strong> detect a particular system condition that isknown <strong>to</strong> cause unusual stress <strong>to</strong> the power system, and <strong>to</strong> take sometype of predetermined action <strong>to</strong> counteract the observed condition in acontrolled manner”. Note that in [37] <strong>System</strong> <strong>Protection</strong> Schemes arereferred <strong>to</strong> as Special <strong>Protection</strong> Schemes.32
Chapter 4: <strong>Power</strong> <strong>System</strong> Instability and <strong>System</strong> <strong>Protection</strong> Schemes<strong>System</strong> <strong>Protection</strong> Schemes (SPS) are used for different purposes.Below their main objectives are listed:1. Operate power systems closer <strong>to</strong> their limits.Due <strong>to</strong> deregulation and environmental constraints the operatingmargins have been reduced in many power systems worldwide. SPSare used <strong>to</strong> operate power systems closer <strong>to</strong> their limits withoutreducing the operating security of the system or impairing overalleconomic objectives. A typical application may be the reduction ofcongestion limitations between supply and load areas. Similarly, inthe case of limited financial resources SPS may be used <strong>to</strong> avoid orpostpone reinforcements of the transmission system withoutreducing its operating security.2. Increase power system security (particularly for extremecontingencies leading <strong>to</strong> system collapse).By including SPS and maintaining the original operating limits thepower system security can be increased. This type of SPS are oftendesigned <strong>to</strong> counteract serious disturbances.3. Improve power system operation.SPS may be designed <strong>to</strong> cope with operational difficulties imposedby certain power system characteristics. Examples are operatingconditions characterised by a higher rate of exposure <strong>to</strong> multiplefaults than <strong>to</strong>lerated by the design criteria or large frequency andvoltage variations in adjacent sub-systems. Actions are typicallytaken when a certain ”key element” is lost or a particular operatingcondition is present.4. Compensate for delays in a construction program.SPS may be used as a temporary solution such as before and duringthe time a new transmission line is constructed.Normally, SPS are dormant integrated protection systems whichoperate infrequently. The control actions taken by SPS are usually predeterminedand the SPS can be armed or disarmed depending on thepower system conditions. Fig. 4.1 1 shows the general structure of SPS.Generally all SPS include three main functions. First the schemecollects input data from the power system. These input data may bequantities like voltage or frequency. Alternatively, the input data are1. Originally published in [3].33
Chapter 4: <strong>Power</strong> <strong>System</strong> Instability and <strong>System</strong> <strong>Protection</strong> Schemesrelated <strong>to</strong> some specific power system event, for example the trippingof a specific transmission line. Next the scheme evaluates the inputdata and makes decisions for the actions <strong>to</strong> be taken. This task isperformed in the ”DECISION PROCESS” block where the input dataare used <strong>to</strong> represent some kind of indica<strong>to</strong>r(s). Normally the decisionprocess is based on discrete feed forward laws. Finally the actions <strong>to</strong> betaken by the SPS are launched by the ”ACTION” block. Typicalactions may be load- or genera<strong>to</strong>r shedding.<strong>Power</strong> <strong>System</strong>DisturbanceDirect Detection<strong>Power</strong><strong>System</strong>Electric VariablesACTION DECISION INPUTPROCESSSYSTEM PROTECTION SCHEMEFigure 4.1General structure of a <strong>System</strong> <strong>Protection</strong> Scheme.4.1.1 Event- and Response based SPSDependent on the input variables, SPS are classified as response basedor event based. SPS using input signals like voltage and frequency arereferred <strong>to</strong> as ”response based”. SPS which use input signals that arebased on specific events (or a particular combination of events) like thetripping of a certain line are called ”event based”. Event based SPS areof the open loop type whereas response based schemes are of theclosed loop type.Event based SPS are used in the case of critical events which are easy<strong>to</strong> identify and may lead <strong>to</strong> consequences which are particularly criticalfor the system stability and therefore require fast counteraction. The34
Chapter 4: <strong>Power</strong> <strong>System</strong> Instability and <strong>System</strong> <strong>Protection</strong> Schemesmain benefit of event based SPS are their fast response. Thefundamental idea of event based schemes is <strong>to</strong> initiate curative actionsquickly and before overall system behaviour becomes degraded. Thistype of schemes may be very effective as rapid control actions <strong>to</strong> limitelectromechanical dynamics before system stability is threatened.Event based schemes are based on rules obtained from off-linesimulations. Typical examples of applications are generation rejectionor remote load shedding initiated by the tripping of a specifictransmission line. The major drawback of event based SPS is theirreliability, as the performance of the schemes normally relies on alimited number of critical variables.Response based SPS are inherently slower than event based SPS asthey must wait for the system response; e.g the frequency or voltage <strong>to</strong>drop below a certain threshold. On the other hand response based SPSare more general than event based SPS as they react with respect <strong>to</strong>critical system quantities whatever the cause of the disturbance. Eventbased SPS will only take action in the case of specific events.Accordingly, response based SPS are also efficient for events that arenot explicitly identified or foreseen. Response based SPS are usuallysimple and secure schemes and their reliability depend mainly on thevariables chosen and their behaviour. Moreover, these schemes areusually insensitive <strong>to</strong> the failure of a single component as they areoften decentralised. Two common examples of response based SPS areunderfrequency- and undervoltage load shedding.35
Chapter 4: <strong>Power</strong> <strong>System</strong> Instability and <strong>System</strong> <strong>Protection</strong> Schemes4.1.2 Local-, Central-, Remote-, Limited Area and Wide AreaApplications<strong>System</strong> <strong>Protection</strong> Schemes can be based on local, central-, remote-,limited area or wide area arrangements.Local SPS acquire all the information necessary for the decisionprocess at the same location as where the curative actions areperformed. Generally local SPS are considered <strong>to</strong> be very reliable andsecure as they are not dependent on long distance communication andtheir actions are limited. Often such schemes are distributedthroughout a region of the network and <strong>to</strong>gether they fulfil therequirements. An example is UnderFrequency Load Shedding (UFLS),likely the most common local system protection scheme application.Normally a complete UFLS strategy is based on a number of loadblocks at different locations (local UFLS SPS) which all are trippedwith respect <strong>to</strong> local frequency criteria. In case of failure of a singlelocal scheme the other devices will still be able <strong>to</strong> counteract thedisturbance. Limited area Remote SPS are here considered <strong>to</strong> representapplications which affect a limited area but include more than onelocation, e.g remote load shedding. A typical example of limited arearemote load shedding is that in case a unit is lost in a genera<strong>to</strong>r stationa signal is sent from that station <strong>to</strong> initiate load shedding in anothersubstation.Central SPS collect data from remote locations and process these dataat a central location. This central location may for example be theutility’s main building complex where the control room is located.When the decision process is completed, signals are sent <strong>to</strong> the remotelocations <strong>to</strong> launch the curative measures. Obviously the centralschemes are highly dependent on telecommunication facilities whichinfluence their reliability. Central SPS may have the Limited areafeature. However, more common is the Wide area approach. Thedifference between a Limited area remote scheme and a Limited areacentral scheme can be explained as follows. When the contingency hasbeen detected locally the remote scheme directly issues orders <strong>to</strong> theremote station where the corrective actions should be taken. In the caseof a Limited area central scheme, signals are first sent from the stationwhere the contingency is detected <strong>to</strong> the central location, and afterprocessing, from the central location <strong>to</strong> the remote station where thecorrective actions are carried out.The decision process of Wide area SPS uses input data from a largenumber of locations throughout a wide area. They can have the central36
Chapter 4: <strong>Power</strong> <strong>System</strong> Instability and <strong>System</strong> <strong>Protection</strong> Schemesapproach but can also be represented by a number of remote stationsinteracting with each other. SPS based on a network of remote stations<strong>to</strong>gether with central schemes are obviously more complex than localSPS and are strongly dependent on communication <strong>to</strong>ols. For theseschemes the security is the main concern as in case of undesirableoperation (during normal operation) the consequences will besignificant. The different types of SPS arrangements are illustrated inFig. 4.2.Limited Area RemoteCENTRALWide Area RemoteCENTRALREMOTESUBSTAIONREMOTESUBSTAIONREMOTESUBSTAIONREMOTESUBSTAIONREMOTESUBSTAIONREMOTESUBSTAIONREMOTESUBSTAIONLimited Area CentralWide Area CentralCENTRALREMOTESUBSTAIONREMOTESUBSTAIONREMOTESUBSTAIONREMOTESUBSTAIONCENTRALREMOTESUBSTAIONREMOTESUBSTAIONREMOTESUBSTAIONFigure 4.2Illustration of Limited-/Wide area Central and Remoteapplications.37
Chapter 4: <strong>Power</strong> <strong>System</strong> Instability and <strong>System</strong> <strong>Protection</strong> Schemes4.2 Detection and Control Indica<strong>to</strong>rs for <strong>System</strong><strong>Protection</strong> SchemesIn order <strong>to</strong> obtain appropriate SPS operation, detection and controlindica<strong>to</strong>rs are required. A large number of indica<strong>to</strong>rs based onsophisticated mathematical methods have been proposed for off-linestudies applicable during the planning phase. However, real-timeapplications require indica<strong>to</strong>rs which are obtained very fast and thusthere are few indica<strong>to</strong>rs, apart from measured electrical quantities anddirect events, which are applicable. Dimension-less indices are alsosometimes useful, for example in case of long term voltage stabilityevents. However, they are more applicable as guidance for opera<strong>to</strong>rs.Often the main concerns in case of SPS design may not only be thechoice of indica<strong>to</strong>rs but the way of obtaining appropriate setting valuesfor the indica<strong>to</strong>rs. The next sections briefly describe indica<strong>to</strong>rsapplicable for the determination of power system instability.4.2.1 Indica<strong>to</strong>rs <strong>to</strong> Determine Voltage InstabilityIndica<strong>to</strong>rs for voltage instability are often related <strong>to</strong> the maximumloadability of the system. For event based SPS loss of generation,reactive resources and transmission facilities are typically used asindica<strong>to</strong>rs as they represent phenomena which may contribute <strong>to</strong>voltage instability. In the case of response based SPS the followingindica<strong>to</strong>rs based on direct measurement represent the most commoninputs:38•Bus voltage magnitude. In many systems the bus voltage magnitudeis the main indica<strong>to</strong>r available <strong>to</strong> detect voltage instability.However depending on the location in the system its reliability asan indica<strong>to</strong>r varies significantly. For example, close <strong>to</strong> genera<strong>to</strong>rsand at buses with a high level of shunt capaci<strong>to</strong>r compensation thevoltage may indicate a <strong>to</strong>o positive system status. For buses locatedaway from generation and with no shunt capaci<strong>to</strong>r compensationthe voltage may well be a valuable indica<strong>to</strong>r.•Reactive and active power output from genera<strong>to</strong>rs.•Reactive power reserves within regions.•Active and reactive power flows on lines (tie-lines).•Genera<strong>to</strong>r (field/armature) current limiter status.•Active and reactive load demand.
Chapter 4: <strong>Power</strong> <strong>System</strong> Instability and <strong>System</strong> <strong>Protection</strong> SchemesAdditional straightforward indica<strong>to</strong>rs which can be determined fromloadflow solutions or measurements are the active/reactive line lossesand sensitivities with respect <strong>to</strong> changes in active and reactive buspower [57]. A number of Voltage Collapse Indica<strong>to</strong>rs have beendeveloped where the distance <strong>to</strong> voltage collapse can be obtained froma dimension-less index. Mainly two categories exist. First thestraightforward type where the index is based on the fraction of thepresent value and the collapse value of any quantity; e.g the voltage orpower flow. The second type is more extensive where the indicestypically are given in a general form [58,59] as in (4.1).∑VCI( z,z c ) = w i ⋅ f i ( zz ,c )i(4.1)Here f i (z,z c ) is a real-valued function of z and z c ; z is a vec<strong>to</strong>rconsisting of measurable variables e.g the load bus voltages, load busreal and reactive power, genera<strong>to</strong>r reactive power etc.; z c is a referencevalue of z and w i are positive weighing functions. In order <strong>to</strong> detectvoltage instability the VCI is compared <strong>to</strong> a threshold (TH) value. Thussystem stability is decided with respect <strong>to</strong> the relations given in (4.2).VCI( z,z c ) ≤ TH ⇒ <strong>System</strong> is voltage stableVCI( z,z c ) > TH ⇒ <strong>System</strong> experience voltage collapse(4.2)The indica<strong>to</strong>rs given so far are fairly simple (but fast) and are based onthe threshold principle i.e when the indica<strong>to</strong>r exceeds or drops below apre-defined threshold value the corrective measures are carried out.Although the principle is simple the main challenge related <strong>to</strong> thisapproach is obviously the choice of appropriate threshold values.Today the setting values are often based on opera<strong>to</strong>r experience ornumerous simulations. No explicit methods are available <strong>to</strong> optimizethe corrective measures with respect <strong>to</strong> location, time for activationand extent. However, there are methods <strong>to</strong> predict voltage instabilityand thus the normal proceeding is <strong>to</strong> perform simulations where thepoint of instability is identified for different contingencies without39
Chapter 4: <strong>Power</strong> <strong>System</strong> Instability and <strong>System</strong> <strong>Protection</strong> Schemescorrective measures. The next step is <strong>to</strong> perform further simulationswhere corrective actions are included and based on these repeatedsimulations the setting values for the corrective measures can bedecided. A number of methods applicable for the setting process of<strong>System</strong> <strong>Protection</strong> Schemes are briefly mentioned below. Mostmethods are only applicable for the planning phase while a few alsocan be used as on-line indica<strong>to</strong>rs.Many static methods have been proposed <strong>to</strong> predict voltage instability.These methods exclude time dependent phenomena but are stillconsidered valuable in the analysis of voltage instability as they areless computational expensive than detailed time-domain simulations.Although time-domain simulations are considered <strong>to</strong> reflect the mostappropriate system behaviour, static and dynamic methods can be usedjointly <strong>to</strong> obtain the most favourable settings of SPS equipment.Methods <strong>to</strong> identify voltage instability include PV- and QV curves[16]. Development of these curves is a fairly extensive work as everynetwork configuration corresponds <strong>to</strong> a unique curve. In order <strong>to</strong>reduce the amount of work different curve-fittings methods may beused [60]. There are also methods based on PV curves with someextensions involving load margins, bifurcation points, sensitivity andenergy methods [61-66]. Another extension of PV- and QV curves arethe PQV surfaces [67] which can be developed for the entire system orfor individual buses. Generally these curves and surfaces are used forplanning, moni<strong>to</strong>ring or post-disturbance investigations but they canalso be used <strong>to</strong> control SPS measures. Different approaches based onthe Jacobian matrix [68-74] are common <strong>to</strong>ols for voltage instabilityidentification. Generally the Jacobian is <strong>to</strong>o computational demanding<strong>to</strong> be used as an on-line predic<strong>to</strong>r and thus more suitable for theplanning process. However, in [69] areas are merged <strong>to</strong>gether andtreated as one bus in order <strong>to</strong> reduce computation data. Another butdubious method, due <strong>to</strong> its sensitivity <strong>to</strong> numerical inadequacies, is theConvergence of the loadflow [75,76]. There are also numerousImpedance based methods proposed for voltage instabilityidentification. The Voltage Instability Predic<strong>to</strong>r (VIP) based on a pairof impedances that coalesce when reaching the critical point [77-80] isthe most encouraging as an on-line <strong>to</strong>ol. Other proposals involve avoltage stability Index for single lines [81-85]. In [86] a method isproposed where the entire system is reduced <strong>to</strong> a single line which thenis investigated by a single line index. Other methods use Fouriertransforms [87,88], Energy functions [89,90], Phasors [91,92],40
Chapter 4: <strong>Power</strong> <strong>System</strong> Instability and <strong>System</strong> <strong>Protection</strong> Schemesnumerical Optimization techniques [93-95] and methods based onNeural network [96-100].Under Voltage Load Shedding represents an important curativemeasure in the case of voltage instability. Accordingly extensive efforthas been given <strong>to</strong> indica<strong>to</strong>rs in order <strong>to</strong> assure optimal shedding[101,102]. In [103] a method is given <strong>to</strong> optimize the load shedding forload having a large share of induction mo<strong>to</strong>rs. Other techniques whichhave been used <strong>to</strong> obtain an optimal UVLS scheme are numericaloptimization based on an objective function and Fuzzy logic [104-106].4.2.2 Indica<strong>to</strong>rs <strong>to</strong> Determine Transient Angle InstabilityDue <strong>to</strong> the high speed requirements event based SPS are preferable <strong>to</strong>prevent transient instability. Typical events used as indica<strong>to</strong>rs arerelated <strong>to</strong> loss of generation-, transmission- and load facilities. Forresponse based SPS, indica<strong>to</strong>rs obtained by direct measurements arenormally used, but also indica<strong>to</strong>rs based on complex mathematicalconcepts. Typical quantities that can be moni<strong>to</strong>red (and used asindica<strong>to</strong>rs) from both lines and genera<strong>to</strong>rs include:•Voltage threshold values exceeded by the voltage within a predefinedtime period.•<strong>Power</strong> threshold values exceeded by the active power within a predefinedtime period.•Apparent power outside pre-defined threshold limits.•(Frequency).More extensive methods <strong>to</strong> investigate, detect and predict transientinstability include the Equal area criterion [107-112] which probablyis the most well known transient stability criterion. This criterionperforms best for two machine systems and therefore requires systemreduction in the case of large systems. Dependent on the systemconfiguration the reduction may vary in its degree of complexity andaccuracy. For practical applications the equal area criterion is mostsuitable for individual genera<strong>to</strong>rs feeding large systems through weakinterconnections or for weak interconnections connecting largesystems. Inherently the Swing equation addresses transient instability.However, solving the swing equations for a large system is fairly time41
Chapter 4: <strong>Power</strong> <strong>System</strong> Instability and <strong>System</strong> <strong>Protection</strong> Schemesconsuming and therefore suitable for the planning stage. In order <strong>to</strong>obtain on-line <strong>to</strong>ols based on the swing equation decision trees [113],neural networks and pattern recognition have been proposed [114].Voltage phasors are a common <strong>to</strong>ol for transient instabilityidentification where the angle difference between different busesnormally is used as a stability measure [115,116]. The voltage phasors<strong>to</strong> moni<strong>to</strong>r are normally easy <strong>to</strong> identify in the case of radial systemconfigurations. However, many systems are strongly meshed and havedispersed generation. In order <strong>to</strong> solve this problem the system isdivided in<strong>to</strong> coherent genera<strong>to</strong>r groups where one “pilot“ genera<strong>to</strong>r isselected for each group. The angle differences between the systemregions are obtained by comparing the angles of the “pilot“ genera<strong>to</strong>rs.A method <strong>to</strong> merge genera<strong>to</strong>rs in<strong>to</strong> coherent groups is proposed in[117]. Furthermore, a commissioned scheme based on phase anglevalidation is described in [118-123]. In [124,125] extra criteria areused in addition <strong>to</strong> the angle difference criterion <strong>to</strong> increase thereliability of the protection. These additional criteria must also remainwithin pre-determined ranges in order <strong>to</strong> dispense corrective actions.The additional criteria are frequency deviation, load bus voltagemagnitude and load bus voltage angle. Another but less commonapproach <strong>to</strong> distinguish coherent groups is <strong>to</strong> study the angle deviationin each bus with respect <strong>to</strong> the steady state condition [126].Furthermore, in [127] a method is proposed where the voltage angle ispredicted by applying the least square method, and dependent on thatprediction the control actions may be carried out. In case of transientinstability the different swing modes can be determined from theFrequency spectrum. Possible input signals are voltage, frequency,real-/reactive power, ro<strong>to</strong>r angle or ro<strong>to</strong>r speed [128-132]. Othermethods proposed for the analysis of transient instability involveModal analysis [133], Energy functions [134-139], Ro<strong>to</strong>r angle andRo<strong>to</strong>r speed deviation [140], Time domain simulations [141],Taylor/Maclaurin expansions and trigonometrical functions [142-145],Out-of-Step Relays [2], Lyponov stability analysis [146,147],Trajec<strong>to</strong>ry technique [148-150] and Mapping/Pattern recognition[151,152].Today the extensive methods mentioned above are often inapplicableas accurate real-time <strong>to</strong>ols for large power systems. In the case ofdetailed system modelling they often result in mathematical tasks,which the computers are incapable <strong>to</strong> solve within the required timeframe. If simplifications are introduced <strong>to</strong> facilitate the computationalrequirements the results may be unreliable. To assure effective curative42
Chapter 4: <strong>Power</strong> <strong>System</strong> Instability and <strong>System</strong> <strong>Protection</strong> Schemesactions in the case of transient instability on-line genera<strong>to</strong>r coherencydetermination is often required. Normally reliable genera<strong>to</strong>r coherencymethods are computational expensive and therefore limited <strong>to</strong> off-linestudies. In Paper D a simple coherency method is introduced that suitsapplications based on communication and GPS technology. This newconcept results in a more accurate genera<strong>to</strong>r coherency than phasormeasurements. This is of particular interest as phasor measurementsare the most common on-line <strong>to</strong>ol for genera<strong>to</strong>r coherencydetermination. In Paper E the method is applied on a SPS addressinginter-area oscillations. Paper D and Paper E are based on a methodbriefly introduced in [131].The extensive methods mentioned above are continuously developedand may become applicable as real-time <strong>to</strong>ols in the future. Presentresearch deals with conventional computer calculation methods butalso more modern approaches such as neural networks [113,129,153],decision trees [154], chaos [155], fuzzy logic [156-158] areinvestigated. Typically neural networks can be used <strong>to</strong> increase thespeed of prediction. Neural networks are trained during off-linesimulations; during on-line operation only limited and simplecalculations are required.4.2.3 Indica<strong>to</strong>rs <strong>to</strong> Determine Frequency InstabilityDue <strong>to</strong> the nature of the frequency instability phenomena the followingquantities are used as indica<strong>to</strong>rs for response based SPS:•Frequency.•Rate of change of frequency.Indica<strong>to</strong>rs for event based SPS may be:•Loss of a power station, a HVDC interconnection or tie-lines.•Loss of a load centre.•Pre- and post contingency power flows.43
Chapter 4: <strong>Power</strong> <strong>System</strong> Instability and <strong>System</strong> <strong>Protection</strong> Schemes4.3 Curative Measures for <strong>System</strong> <strong>Protection</strong> SchemesTable 4.1 gives an overview of the most common SPS in operation.The table was originally published in [37,38] and is based on a jointsurvey over SPS performed by IEEE and CIGRÉ. In <strong>to</strong>tal 49 utilitiesfrom 17 countries responded <strong>to</strong> a survey describing 111 schemes.Furthermore, Table 4.2 gives a general overview for which categoriesof power system instability the different types of curative measures aresuitable. The table was originally published in [3].Table 4.1: Mixture of most common SPS types.Type of SPS [%]Generation Rejection 21.6Load Rejection 10.8Underfrequency load shedding 8.2Controlled system separation 6.3Turbine fast valving 6.3Load & Genera<strong>to</strong>r rejection 4.5Stabilizers 4.5HVDC fast power change 3.6Out-of-step relaying 2.7Discrete excitation control 1.8Braking resis<strong>to</strong>r 1.8Genera<strong>to</strong>r run-back 1.8Var compensation 1.8Combination of schemes 11.7Others 12.6All SPS 10044
Chapter 4: <strong>Power</strong> <strong>System</strong> Instability and <strong>System</strong> <strong>Protection</strong> SchemesTable 4.2: Curative measures and their fields of application.Generation RejectionTurbine fast valvingGas turbine start-upActions on the AGCUnderfrequency load sheddingUndervoltage load sheddingLoad rejectionHVDC fast power changeAu<strong>to</strong>matic shunt switchingBraking resis<strong>to</strong>rControlled system separationTap changer blockingTransient instability X X X X X X XFrequency instability(freq. decay)Frequency instability(freq. rise)XX X X X XXVoltage instability X X X X X X X XCascade line outages X X X X XFig. 4.3 1 shows the relationship between the duration of major powersystem phenomena and the approximate time frame of SPS actionsused <strong>to</strong> limit their consequences. The time frames for different controland protection categories are indicated. The time scale is logarithmicand solid lines represent the typical operating range for the curativemeasures while dotted lines indicate potential operating ranges.1. Originally published in [3].45
Chapter 4: <strong>Power</strong> <strong>System</strong> Instability and <strong>System</strong> <strong>Protection</strong> SchemesTime range of SPS actions <strong>Power</strong> systemphenomenaElectromagneticswitching transientsEQUIPMENTPROTECTIONRANGETransient stability(angle and voltage)Small-signalstabilityAUTOMATIC ACTIONRANGEAu<strong>to</strong>matic shuntswitchingGenerationrejectionTurbine fastvalvingUnderfrequency loadsheddingLoadrejectionBrakingresis<strong>to</strong>rUndervoltage loadsheddingTap changersblockingLong termstabilityLong term voltagestabilityActions on AGC<strong>Power</strong> systemoperationMANUAL OPER-ATION RANGEGas turbinestart-upHVDC fastpowerchangeControlled opening ofinterconnection.001 .01 .1 1 10 100 1000Time [s]Figure 4.3Time frame relation between curative measures and powersystem phenomena.<strong>System</strong> separation schemes are normally used as a curative measure fortransient instability. However, sometimes separation schemes can alsobe designed <strong>to</strong> prevent the penetration of voltage instability fromneighbouring systems. These schemes are normally applied on theborderline between different countries or large utilities. Paper F is46
Chapter 4: <strong>Power</strong> <strong>System</strong> Instability and <strong>System</strong> <strong>Protection</strong> Schemesintroducing a similar scheme but instead of invoking large systemregions the aim of this scheme is <strong>to</strong> secure voltage stability in at leas<strong>to</strong>ne part of the system in order <strong>to</strong> avoid a black start. The scheme isusing conventional distance protection and should operate when acomplete breakdown cannot be obstructed by any other means.4.4 <strong>System</strong> <strong>Protection</strong> Schemes in the Nordel <strong>System</strong>SPS in the Nordel system will be treated here. An extensive survey onSPS and field experience worldwide is given in [159].The instantaneous emergency reserve in the Nordel system isequivalent <strong>to</strong> the loss of the largest unit in service; normally about1200 MW. In addition SPS are used for extreme contingencies such assevere grid weakening or a loss of generation exceeding the largestunit. There are a number of SPS operating in the Nordel system <strong>to</strong>day,addressing all different types of power system instability, involvinglarge and small areas. Examples are active power support fromneighbouring regions via HVDC links, au<strong>to</strong>matic conversion frompure reactive generation <strong>to</strong> active generation for some hydro units,au<strong>to</strong>matic start of gas turbines, load shedding or system separation. Toavoid overload or instability in case of reduced transfer capacity incritical intersections genera<strong>to</strong>r shedding is applied. The HVDC supportis activated in case of low frequency and/or low voltage in the HVDCstation or low voltage in a remote station. A number of Emergency<strong>Power</strong> Control steps are implemented in the control systems of thelinks. There are different setting possibilities but the most commonway <strong>to</strong> control the power flow is <strong>to</strong> apply a number of time-delayedstep-changes e.g ∆P=50 MW with a 2 s time delay. Au<strong>to</strong>maticfrequency controlled start of gas-turbines is used <strong>to</strong> some extent withinthe Nordel system. In Sweden these units are started at 49.5 Hz. NondiscriminativeUFLS is used as a final curative measure in case ofextreme loss of generation. The UFLS is divided in<strong>to</strong> five steps whereeach step has two different time delays.Fig. 4.4 gives an overview of the main corrective measures used <strong>to</strong>counteract the different types of power system instability in the Nordelsystem. The grey window represents the emergency reserve <strong>to</strong>getherwith on-line hydro units. The emergency reserve is divided in<strong>to</strong>instantaneous-, fast- and slow reserves. The emergency reserve isintended <strong>to</strong> counter frequency decays down <strong>to</strong> 49.5 Hz. In case the47
Chapter 4: <strong>Power</strong> <strong>System</strong> Instability and <strong>System</strong> <strong>Protection</strong> Schemesfrequency drops below 49.5 Hz a severe contingency has occurredaccording <strong>to</strong> the design criteria. Thus additional SPS (e.g UFLS) isused <strong>to</strong> arrest further frequency decay.Normal operationThermal overloadGenera<strong>to</strong>r sheddingFrequency instabilityConversion <strong>to</strong> activegeneration by units generatingreactive powerShedding of plants operatingin pumpingmodeAu<strong>to</strong>matic start of gasturbinesHVDC emergencypowerAdditional HVDCemergency powerUFLS<strong>System</strong> separationTransient instabilityGenera<strong>to</strong>r sheddingFast valvingSVCHVDC damping<strong>System</strong> separationVoltage instabilityAu<strong>to</strong>matic shunt capaci<strong>to</strong>r/reac<strong>to</strong>rswitchingSVC/Static compensa<strong>to</strong>rTap-changer blocking/controlHVDC controlUVLS<strong>System</strong> separationFigure 4.4Main <strong>System</strong> <strong>Protection</strong> Schemes in the Nordel system. The greywindow represents corrective measures which are a part of theemergency reserve.48
Chapter 4: <strong>Power</strong> <strong>System</strong> Instability and <strong>System</strong> <strong>Protection</strong> SchemesTable 4.1 gives an overview of the extent of installations of correctivemeasures used for SPS in the Nordel system. Some schemes involveonly one type of corrective action while other schemes comprisenumerous actions. The extent of installations in 2001 is compared <strong>to</strong>the situation in 1992 [160,161].Table 4.1: Overview of SPS in the Nordel system 1992 and 2001.SPS Available 1992 Available 2001Genera<strong>to</strong>rsheddingapprox. 7000 MWapprox. 7000 MWFast valving max. 350 MW approx. 480 MWConversion <strong>to</strong>active powergeneration byhydro unitsgeneratingreactive powerapprox. 1795 MWapprox. 438 MWShedding of plan<strong>to</strong>perating inpumping modeAu<strong>to</strong>matic start ofgas turbines (and adiesel unit)950 MW 550 MW695 MW (20 MW) 485 MW (20 MW)Au<strong>to</strong>matic shunt about 1500 MVAr + 23capaci<strong>to</strong>r capaci<strong>to</strong>rs in Finlandswitching aabout 1750 MVAr + 26capaci<strong>to</strong>rs in FinlandAu<strong>to</strong>matic shuntreac<strong>to</strong>r switchingSVCStaticcompensa<strong>to</strong>rsTap-changerblocking3700 MVAr + the reac<strong>to</strong>rsin Sweden minus thereac<strong>to</strong>rs in the Sydkraftarea±930 MVAr+360 MVAr inductive8500 MVAr±1250 MVAr+360 MVAr inductive- 140 MVAr- In operation in Finland andNorway49
Chapter 4: <strong>Power</strong> <strong>System</strong> Instability and <strong>System</strong> <strong>Protection</strong> SchemesSPS Available 1992 Available 2001HVDC, Control ofNorway -Denmark powerflow in case oflow voltage inNorwayHVDC emergencypowermax. 240 MWmax. 560 MW <strong>to</strong> counterfrequency decaymax. 240 MWSimilar scheme for Balticcable (max. 200 MW),SwePol Link (max. 300MW) and Kontek (max. 250MW) in case of low voltagein local station or in Segemax. 890 MW <strong>to</strong> counterfrequency decayHVDC damping ? ±100 MWUVLS max. 200 max. 200Au<strong>to</strong>matic UFLS b Sweden: 34 % of <strong>to</strong>t. loadNorway: 32 % of <strong>to</strong>t. loadFinland: 20 % of <strong>to</strong>t. loadDenmark: 45 % of <strong>to</strong>t. loadSweden: 34 % of <strong>to</strong>t. loadNorway: 32 % of <strong>to</strong>t. loadFinland: 20 % of <strong>to</strong>t. loadDenmark: 45 % of <strong>to</strong>t. load<strong>System</strong> separation Similar <strong>to</strong> the 2001situationHVDC interconnections aresevered in case of severeunderfrequency orovervoltage.Finland: Isolated islandoperation in case ofunderfrequency.The south part of Norway isseparated from theremaining system in case ofstrained operation of theHassle bottleneck.Splitting schemes based onpower-, voltage levels andloss of circuit also exist.50
Chapter 4: <strong>Power</strong> <strong>System</strong> Instability and <strong>System</strong> <strong>Protection</strong> SchemesSPS Available 1992 Available 2001<strong>Power</strong> swingdetec<strong>to</strong>rsSimilar <strong>to</strong> the 2001situationGenerally used <strong>to</strong> detectpower swings but not <strong>to</strong>avoid undesirable relayoperation or control systemseparation. However, inNorway there is a limitednumber of detec<strong>to</strong>rs whichalso control correctiveactions (genera<strong>to</strong>rrejection).a. Although the numbers are according <strong>to</strong> [160] and [161] information is missing or presenteddifferently for certain countries which may affect the presented data.b. The values presented here were slightly updated when the new load shedding policywas introduced on January 1, 2002.51
Chapter 4: <strong>Power</strong> <strong>System</strong> Instability and <strong>System</strong> <strong>Protection</strong> Schemes52
Chapter 5: Summary of PublicationsChapter 5 Summary of PublicationsAs a part of this Ph.D dissertation the papers presented below arepublished in their full length. Paper A - Paper C address local areaprotection while Paper D - Paper F analyse applications associatedwith <strong>System</strong> <strong>Protection</strong> Schemes.5.1 Paper A: An Adaptive Scheme <strong>to</strong> PreventUndesirable Distance <strong>Protection</strong> OperationDuring Voltage InstabilityThe paper introduces an adaptive algorithm <strong>to</strong> prevent undesirabledistance protection operation during voltage instability. The rate ofchange of voltage is used as an additional relay criterion <strong>to</strong> improve thedistance relay security with respect <strong>to</strong> voltage instability. Theperformance of the new algorithm is analysed using two different testsystems; a 15 bus system developed by the authors and the NORDIC32system [162].This paper has been published in condensed form as [163].5.2 Paper B: A New <strong>Protection</strong> Scheme <strong>to</strong> PreventMal-trips due <strong>to</strong> <strong>Power</strong> SwingsIn this paper distance protection algorithms based on mathematicallogic blocks are proposed. The algorithms prevent mal-trips due <strong>to</strong>power oscillations using additional criteria in combination withtraditional distance relaying. These additional criteria are based onsymmetrical components and the rate of change of the phase angleassociated with the current as seen by the relay. Finally, theperformance of the algorithms is analysed in a simulation performed ina eighteen bus system developed by the authors.53
Chapter 5: Summary of Publications5.3 Paper C: A Distance <strong>Protection</strong> Scheme <strong>to</strong>Prevent Mal-trips During Abnormal <strong>Power</strong><strong>System</strong> ConditionsIn this paper distance relay algorithms are further developed based onPaper A and Paper B. The eighteen bus system introduced in Paper Bis used <strong>to</strong> investigate the performance of the algorithms.5.4 Paper D: A New Method Suitable for Real TimeGenera<strong>to</strong>r Coherency DeterminationBased on three test cases in a 68 bus system the paper illustrates thatwide area genera<strong>to</strong>r speed measurements combined with Fourieranalysis can be used <strong>to</strong> determine coherent genera<strong>to</strong>r groups. To verifyits performance the new method is compared <strong>to</strong> conventional methodsbased on the genera<strong>to</strong>r speed, modal analysis and phasor anglemeasurements.5.5 Paper E: A <strong>System</strong> <strong>Protection</strong> Scheme Concept <strong>to</strong>Counter Inter-Area OscillationsThis paper introduces a concept of a genera<strong>to</strong>r coherency based <strong>System</strong><strong>Protection</strong> Scheme, addressing inter-area oscillation events. Thescheme is based on the coherency method introduced in Paper D. Asimulated test case in a 68 bus system is used <strong>to</strong> introduce theoperating principle of the scheme. The test case is also used <strong>to</strong> evaluatethe scheme’s suitability for different well established DSP methods.Aspects such as evolving-/sliding window functions, window size andfrequency resolution are examined.5.6 Paper F: An Emergency Strategy Scheme Basedon Conventional Distance <strong>Protection</strong> <strong>to</strong> AvoidComplete <strong>System</strong> CollapseIn order <strong>to</strong> reduce the res<strong>to</strong>ration time after a voltage collapse affectinga large system an emergency protection scheme based on conventionaldistance protection is proposed. The performance of the scheme isinvestigated using the NORDIC32 test system [162].54
Chapter 5: Summary of Publications5.7 Other Publications Reported within the Scope ofthe ProjectIn addition <strong>to</strong> this Ph.D thesis a licentiate thesis [2] and a technicalreport [159] have been published.5.7.1 Licentiate thesis - Line <strong>Protection</strong> and <strong>Power</strong> <strong>System</strong>CollapseIn the licentiate thesis the influence of line protection on transient- andvoltage instability is investigated. Different types of line protectionapplications are discussed and their likelihood of contributing <strong>to</strong> powersystem instability is analysed. The different types of relaycharacteristics used in distance protection are analysed and theirrelative numbers in the Swedish transmission system are given.Statistics of zone 3 distance protection operation in the Swedishtransmission system are shown for the period 1985 - 2000.Additionally, a number of disturbances related <strong>to</strong> distance protectionand power system instability is investigated.Also the significance of co-ordination between distance protection andgenera<strong>to</strong>r current limiters in case of voltage instability is investigated.Subsequently the interaction between distance protection and otherprotection devices during power system instability is discussed. Conventional<strong>Power</strong> Swing Detec<strong>to</strong>rs and Out-of-Step <strong>Protection</strong> have alsobeen examined.Papers A-C introduced above are all incorporated in<strong>to</strong> the thesis.5.7.2 Technical Report - Present Status of <strong>System</strong> <strong>Protection</strong>SchemesThe report gives an overview of publications and projects within thearea of <strong>System</strong> <strong>Protection</strong> Schemes. Different theoretical aspectsinvolving power system instability, indica<strong>to</strong>rs, system configuration,curative measures and their internal relations are examined.Furthermore, an extensive survey of commissioned <strong>System</strong> <strong>Protection</strong>Schemes worldwide is presented.55
56Chapter 5: Summary of Publications
Chapter 6: Conclusions and Future WorkChapter 6 Conclusions and Future Work6.1 ConclusionsThis thesis introduces new methods <strong>to</strong> improve the performance ofpower system protection in case of system instability. The methods areprimarily designed <strong>to</strong> mitigate power system breakdown.Distance protection may contribute <strong>to</strong> power system instability.Measures <strong>to</strong> improve its performance have been proposed using newrelay criteria combined with conventional impedance characteristics.In case of voltage instability the criteria are based on the derivative ofthe voltage whereas the rate of change of the phase angle of the currentis used for transient instability. The measures improve the relaysecurity with respect <strong>to</strong> voltage instability whereas the reach of thedistance protection is unrestricted. Line length, different swingfrequencies or faults having a slowly decreasing impedance will notaffect the performance and availability of the proposed schemes, whichmay be the case for conventional <strong>Power</strong> Swing Detec<strong>to</strong>rs.Furthermore, fault clearing will not be blocked as in the case ofconventional PSD applications.A high degree of security is relevant <strong>to</strong>day as the trend implies thatutilities are subjected <strong>to</strong> penalty fees in the case of undelivered energy.Companies therefore want <strong>to</strong> avoid undesirable relay tripping indeed.The methods proposed here are based on mathematical logic blockswhich are easily adapted <strong>to</strong> numerical relays.In the Swedish bulk power system the number of power oscillationshas increased significantly during recent years. To dampen oscillationsa well established genera<strong>to</strong>r coherency is often required. In this thesis amethod based on wide area genera<strong>to</strong>r speed measurements and Fourieranalysis is proposed for the purpose of on-line coherency tracking. Theperformance of the new method has been evaluated by comparing thegenera<strong>to</strong>r coherency obtained from the new method with coherenciesobtained from conventional methods based on genera<strong>to</strong>r speed, modalanalysis and phasor angle measurements. The new method and the offlinemethods based on genera<strong>to</strong>r speed and modal analysis give almostidentical results, however the results obtained from phasormeasurements show deviations. This is particularly interesting as thegenera<strong>to</strong>r angle probably is the most common on-line indica<strong>to</strong>r for57
Chapter 6: Conclusions and Future Workgenera<strong>to</strong>r coherency determination. Furthermore, taking the transientdis<strong>to</strong>rtion immediately after a disturbance in<strong>to</strong> account, this workindicates that the method introduced here generates a reliablecoherency considerably quicker than the methods based on pure speedor genera<strong>to</strong>r voltage angle measurements.Using a method based on speed measurement combined with Fourieranalysis a concept for a <strong>System</strong> <strong>Protection</strong> Scheme addressing interareaevents is proposed. Different Digital Signal Processing issuessuch as window functions, time-frequency resolution and signalanalysis methods have been investigated. Based on these investigationsa scheme was designed. For the detection of inter-area modes,parametric methods are the most feasible. Evolving window functionsgenerally detect the main mode somewhat faster than sliding windows.However, evolving windows require a trigger activated by the presenceof an inter-area mode. This trigger may complicate the design of thescheme and therefore the design proposed here is based on a slidingwindow. To shorten the detection time of the main mode, a reducedfrequency resolution can be applied. However, a lower frequencyresolution contributes <strong>to</strong> spectral mode shifts and reduces the quality ofthe estimate of the instantaneous speed deviation. As a result thediscrimination of the unstable/stable nature of the modes is of a lowerquality. Also the phase estimation deteriorates which in turn leads <strong>to</strong> aless reliable genera<strong>to</strong>r coherency determination. The design proposedhere is therefore based on a high frequency resolution, accepting asomewhat slower response.Finally, an emergency scheme is proposed utilising conventionaldistance relays <strong>to</strong> avoid a complete system collapse in case of severevoltage instability. The purpose of the scheme is <strong>to</strong> co-ordinate alldistance relays belonging <strong>to</strong> a transfer section so they willsimultaneously operate due <strong>to</strong> the voltage instability. As a result a par<strong>to</strong>f the system can be saved from the collapse, black-start can beavoided and the res<strong>to</strong>ration time can be reduced. Furthermore, in caselong distance communication is introduced the scheme can be utilizedfor the supervision of corrective measures such as genera<strong>to</strong>r or loadshedding.58
Chapter 6: Conclusions and Future Work6.2 Future WorkFuture work directly linked <strong>to</strong> the work in this thesis includes variouspractical issues related <strong>to</strong> the realization of the proposed applications.For the distance relay algorithms emphasising security, issues such asdata memory, window size and data filtering must be furtherinvestigated. To obtain reliable operation well defined settingprocedures for the new relay criteria should also be developed.The <strong>System</strong> <strong>Protection</strong> Scheme based on speed measurements andFourier Analysis is still at an early stage of development. An adaptivefrequency resolution for the detection process could be used <strong>to</strong> furtherimprove the performance of the scheme. Also the main mode trackingsystems could be based on a combination of evolving and slidingwindow functions.A future approach could be the use of extensive protection systemswhere equipment protection and <strong>System</strong> <strong>Protection</strong> Schemes areclosely related <strong>to</strong> each other. As communicative relays become morewidely used a large amount of data is available and the number ofpossible remedial actions increases significantly. These features areattractive for SPS. At the same time the wide area data acquisition used<strong>to</strong> control the actions associated with the SPS, can also be used <strong>to</strong>prevent incorrect equipment protection performance, as theiralgorithms can be based on wide area data. Possible research <strong>to</strong>pics arethe optimal utilization of the extensive data with respect <strong>to</strong> relayalgorithms and the detection and counteraction of different powersystem phenomena. Also the optimal co-ordination between local andsystem wide protection applications with respect <strong>to</strong> dependability andsecurity should be investigated.Traditionally measures taken by <strong>System</strong> <strong>Protection</strong> Schemes have beenextensive. The schemes have not been adjusted <strong>to</strong> each specificdisturbance and sometimes the overstated curative measures haveresulted in needless social inconvenience and unnecessary largedisturbance cost. Another aspect is the relation between operatingsafety limits and the (real-time) prevailing operating conditions wherethe remedial measures represent one feature. To utilize the system (atevery single moment) <strong>to</strong> its maximum capacity a continuousoptimization must be performed with respect <strong>to</strong> all parameters wherealso the remedial actions should be adjusted based on the actual systemcondition. There are therefore major incentives for more accurate andintelligent (adaptive) applications controlling the corrective measures.59
Chapter 6: Conclusions and Future WorkOne interesting <strong>to</strong>ol for this purpose is GPS synchronized wide areameasurements where the system status is provided in real-time. Thisfeature combined with for example Artificial Intelligence could be afruitful area.As computers become faster more sophisticated DSP methods can beused for protection applications. Traditionally the measured relaysignals have been processed based on DSP techniques, and then theelectrical quantities associated with the signals have been used as relaycriteria. However, the present situation makes it interesting <strong>to</strong> searchfor new relay criteria based on inherent DSP parameters. Typically thecriteria could be an intermediate quantity obtained from the DSPprocess during the evaluation of the electrical signal.An observation made during the project is the importance of accurateprotection modelling during simulation based studies. Anotherobservation is the influence of numerical defects during simulationsclose <strong>to</strong> instability. An ever lasting important task is <strong>to</strong> further developsimulations <strong>to</strong>ols, both with respect <strong>to</strong> numerical and modellingaspects.A result of the more extensive use of communication in power systemprotection are the increased requirements of data security. Overall thisis a very relevant <strong>to</strong>pic involving numerous aspects of power systemoperation. The <strong>to</strong>pic offers many challenges within a broad range ofdifferent research areas.60
ReferencesReferences[1] Kundur P, ”<strong>Power</strong> <strong>System</strong> Stability and Control”, ISBN 0-07-035958-X,McGraw - Hill, 1994.[2] Jonsson M, ”Line <strong>Protection</strong> and <strong>Power</strong> <strong>System</strong> Collapse”, TechnicalReport No. 393L, Chalmers University of Technology, Sweden, 2001.[3] CIGRÉ, TF 38.02.19, ”<strong>System</strong> protection schemes in power networks”,June, 2001.[4] ANSI/IEEE C37.106-1987, ”Guide for abnormal frequency protection forpower generating plants”.[5] Lindahl S, ”Frekvenshållning inom Nordel-systemet”, Nordel 1983,Särtryck ur årsberättelsen, Sydkraft AB, 1983 (In Swedish).[6] Horowitz S.H, Phadke A.G, ”<strong>Power</strong> <strong>System</strong> Relaying”, ISBN 0-86380-185-4, Research Studies Press Ltd, 1995.[7] ”The blackout in Sweden 27-12-1983”, Vattenfall publication, February1984.[8] Larsson S, Kearsly R, ”The blackout in the Swedish <strong>Power</strong> Supply <strong>System</strong>,December 1983”, CEPSI Conference, Manilla, Philippines, November1984.[9] Kearsly R, ”Res<strong>to</strong>ration in Sweden and Experience Gained from theBlackout of 1983”, IEEE Transactions on <strong>Power</strong> <strong>System</strong>s, Vol. PWRS-2,No. 2, May 1987, pp. 422-428.[10] Otterberg R, ”Res<strong>to</strong>ration After Disturbances in the Swedish Bulk-<strong>Power</strong>Network - Instruction <strong>System</strong> and Au<strong>to</strong>matic Equipment”, CIGRÉ StudyCommittee 39 Colloquim, Toron<strong>to</strong>, Canada, September 1985.[11] ”DRIFTSTÖRNING 83-12-27”, RAPPORT FRÅN ARBETSGRUPP,MARS 1984 (In Swedish).[12] Western <strong>System</strong>s Coordinating Council Disturbance Report For the <strong>Power</strong><strong>System</strong> Outages that Occurred on the Western Interconnection on July 2,1996, 1424 MAST and July 3, 1996, 1403 MAST, Approved September19, 1996.61
References[13] Taylor C.W, Erickson D.C, ”Recording and Analyzing the July 2Cascading Outage”, IEEE Computer Applications in <strong>Power</strong>, Vol. 10, No.1, January 1997, pp. 26 - 30.[14] Samuelsson O, ”Wide Area Measurements of <strong>Power</strong> <strong>System</strong> Dynamics -The North American WAMS Project and its Applicability <strong>to</strong> the NordicCountries”, Elfork report 99:50, January 2000.[15] X. Vieira et. al, ”The March 11:th 1999 Blackout: Short-Term Measures <strong>to</strong>Improve <strong>System</strong> Security and Overview of the Reports Prepared by theInternational Experts”, CIGRÉ Session, SC 39 Workshop on LargeDisturbances, Paris, August 29, 2000.[16] Taylor C.W, ”<strong>Power</strong> <strong>System</strong> Voltage Stability”, ISBN 0-07-113708-4,McGraw-Hill, 1994, pp. 263.[17] Mechraoui A, Thomas D.W.P, ”A new distance protection scheme whichcan operate during fast power swings”, IEE Conference Publication No.434, Developments in <strong>Power</strong> <strong>System</strong> <strong>Protection</strong>, March 25-27, 1997, pp206 - 209.[18] Ilar F, ”Innovations in the Detection of <strong>Power</strong> Swings in ElectricalNetworks”, Brown Boveri Review No. 68, 1981.[19] Machowski J, Nelles D, ”Licentia Patent-Verwaltungs-GmbH AEG-Franfurt, P4100646.1”.[20] Machowski J, Nelles D, ”New <strong>Power</strong> Swing Blocking Method”, IEEDevelopments in <strong>Power</strong> <strong>System</strong> <strong>Protection</strong>, Conference Publication No.434, March 25-27, 1997, pp 218 - 221.[21] Rovnyak S et.al, ”Decision trees for real-time transient stabilityprediction”, IEEE Transaction on <strong>Power</strong> <strong>System</strong>s, Vol. 9, No. 3, August1994, pp. 1417-1426.[22] Jiali H, Yuqian D, Yongli L, Gang W, Shanshan L, ”Distance Relay<strong>Protection</strong> Based on Artificial Neural Network”, Proceedings of the 4thInternational Conference on Advances in <strong>Power</strong> <strong>System</strong> Control,Operation and Management, APSCOM-97, Hong Kong, November 1997,pp. 515 - 520.[23] Centeno V et. al, ”An adaptive out-of-step relay”, IEEE Transaction on<strong>Power</strong> Delivery, Vol. 12, No. 1, January 1997, pp. 61-71.62
References[24] Centeno V, Phadke A.G, Edris A, ”Adaptive out-of-step relay with phasormeasurement”, IEE Conference Publication No. 434, Developments in<strong>Power</strong> <strong>System</strong> <strong>Protection</strong>, March 25-27, 1997, pp 210 - 213.[25] Redfern M.A, Checksfield M.J, ”A new pole slipping protection algorithmfor dispersed s<strong>to</strong>rage and generation using the equal area criterion”, IEEETransaction on <strong>Power</strong> Delivery, Vol. 10, No. 1, January 1995, pp. 194-202.[26] Hemmingsson M, “<strong>Power</strong> <strong>System</strong> Oscillations - Detection, Estimation &Control“, Ph.D thesis, ISBN 91-88934-27-6, Lund University, 2003.[27] ”Protective Relays Application Guide”, GEC ALSTHOM, ed. 3, 1987.[28] IEEE Working Group Report, ”Out of Step Relaying for Genera<strong>to</strong>rs”,IEEE Transaction, Vol. PAS-96, September /Oc<strong>to</strong>ber 1977, pp. 1556-1564.[29] Elmore W.A, ”Pilot Protective Relaying”, ISBN 0-8247-8195-3, MarcelDekker Inc, 2000.[30] Fouad A.A et.al, ” Investigation of Loss of Generation Disturbances in theFlorida <strong>Power</strong> and Light Company Network by the Transient EnergyFunction Method”, IEEE Transaction on <strong>Power</strong> <strong>System</strong>s, PWRS-1, No. 3,1986, pp. 60-66.[31] van Eyssen J, ”Introducing a new application philosophy for out-of-stepprotection”, IEE Conference Publication No. 434, Developments in <strong>Power</strong><strong>System</strong> <strong>Protection</strong>, March 25-27, 1997, pp 214 - 217.[32] ”The Swedish 380 kV <strong>System</strong>”, Kungl. Vattenfallsstyrelsen, Kungl.Boktryckeriet P.A Norstedt & Söner, 1960.[33] Wide Area <strong>Protection</strong> seminar, “Real-Time Moni<strong>to</strong>ring of Fast Dynamicin the Swedish National Grid (Fast RTMS)”, Presentation by SvenskaKraftnät, Västerås, Sweden, April 2, 2001.[34] Phadke A.G, ”Synchronized Phasor Measurements in <strong>Power</strong> <strong>System</strong>s”,IEEE Computer Applications in <strong>Power</strong>, Vol. 6, No. 2, April 1993, pp. 10 -15.[35] Martin K.E et.al, ”IEEE Standards for Synchrophasors for <strong>Power</strong><strong>System</strong>s”, IEEE Transactions on <strong>Power</strong> Delivery, Vol. 13, No. 1, January1998, pp. 73 - 77.63
References[36] Hauer J.F, ”Validation Of Phasor Calculations In The Macrodyne PMUFor California-Oregon Transmission Project Tests Of March 1993”, IEEETransactions on <strong>Power</strong> Delivery, Vol. 11, No. 3, July 1996, pp. 1224-1231.[37] Anderson P.M, LeReverend B.K, ”Industry Experience with Special<strong>Protection</strong> Schemes”, IEEE Transactions on <strong>Power</strong> <strong>System</strong>s, Vol. 11, No.3, August 1996, pp. 1166- 1179.[38] CIGRÉ WG 39.05, LeReverend B.K, Anderson P.M, ”IndustryExperience with Special <strong>Protection</strong> Schemes”, Electra, No. 155, August,1994.[39] IEEE <strong>Power</strong> <strong>System</strong> Relaying Committee C6, ”Wide Area <strong>Protection</strong> andEmergency Control”, working.[40] Trudel G et.al, ”Hydro-Québec’s defence plan against extremecontingencies”, IEEE Transactions on <strong>Power</strong> <strong>System</strong>s, Vol. 14, No. 3,August 1999, pp. 958 - 966.[41] Faucon O, Dousset L, ”Coordinated Defence Plan Protects AgainstTransient Instabilities”, IEEE Computer Applications in <strong>Power</strong>, Vol. 10,Issue. 3, July 1997, pp. 22 - 26.[42] Harker K, ”The North Wales supergrid special protection schemes”,Electronics & <strong>Power</strong>, no. 9, September, 1984, pp. 719 - 724.[43] Coetzee G.J, Wittwer F, ”Development of a transient stability protectionsystem for Eskom’s Matimba power station”, IEE Conference PublicationNo. 434, Developments in <strong>Power</strong> <strong>System</strong> <strong>Protection</strong>, March 25 - 27, 1997,pp. 36 - 39.[44] Ingelsson B, Lindström P-O, Karlsson D, Runvik G, Sjödin J-O, ”Wideareaprotection against voltage collapse”, IEEE Computer Applications in<strong>Power</strong>, Vol. 10, Issue. 4, Oc<strong>to</strong>ber 1997, pp. 30 - 35.[45] CIGRÉ TF 38.01.03, ”Planning against voltage collapse”, 1987.[46] CIGRÉ TF 38.02.08, ”Long Term Dynamic Simulation Methods”, 1995.[47] CIGRÉ TF 38.02.10, ”Modelling of Voltage Collapse Including DynamicPhenomena”, 1993.[48] CIGRÉ TF 38.02.11, ”Indices Predicting Voltage Collapse IncludingDynamic Phenomena”, 1994.64
References[49] CIGRÉ TF 38.02.12, ”Criteria and Countermeasures for VoltageCollapse”, 1995.[50] CIGRÉ TF 38.01.07, ”Control of <strong>Power</strong> <strong>System</strong> Oscillations”, 1996.[51] CIGRÉ WG 34.08, ”<strong>Protection</strong> against Voltage Collapse”, No. 128,August, 1998.[52] CIGRÉ TF 38.02.14, ”Analysis and Modelling Needs of <strong>Power</strong> <strong>System</strong>sunder <strong>Major</strong> Frequency Disturbances”, 1999.[53] CIGRÉ TF 38.02.17, ”Advanced Angle Stability Controls”, 1999.[54] IEEE <strong>Power</strong> <strong>System</strong> Relaying Committee K12, ”<strong>System</strong> <strong>Protection</strong> andVoltage Stability”, 1993.[55] IEEE <strong>Power</strong> <strong>System</strong> Relaying Committee K12, ”Voltage CollapseMitigation”, 1997.[56] IEEE <strong>Power</strong> <strong>System</strong> Relaying Committee C6, ”Performance of Genera<strong>to</strong>r<strong>Protection</strong> During <strong>Major</strong> <strong>System</strong> Disturbances”, working.[57] Ajjarapu V, Feng Z, ”A novel approach for voltage collapse analysis andcontrol”, Proceedings of <strong>Power</strong>Con, 1998, pp. 1499 - 1503.[58] Fischl R, Mercede F, ”Can Voltage Security Indices Predict VoltageCollapse Problems in Large-Scale <strong>Power</strong> Networks”, Proceedings of IEEEInternational Symposium on Circuit and <strong>System</strong>s, 1988, pp.665 - 668.[59] Fischl R et.al, ”A comparison of indices for predicting voltage collapse inpower systems”, Proceedings of the 27th Conference on Decision andControl, Austin, Texas, USA, December, 1988.[60] Ejebe G.C et.al, ”On-Line Voltage Stability Assessment: Framework andImplementation”, Proceedings of IEEE PES Winter meeting, Tampa,Florida, USA, 1998.[61] Dobson I et.al, “Voltage Collapse in <strong>Power</strong> <strong>System</strong>s”, IEEE Circuit andDevices Magazine, Vol. 8, Issue. 3, May 1992, pp. 40 - 45.[62] Evers T.A et.al, “Prediction of Voltage Collapse in <strong>Power</strong> <strong>System</strong>s”,Proceedings of the Thirtieth Southeastern Symposium on <strong>System</strong> Theory,1998, pp. 354 - 358.65
References[63] Greene S et.al, ”Sensitivity of the load margin <strong>to</strong> voltage collapse withrespect <strong>to</strong> arbitrary parameters”, IEEE Transactions on <strong>Power</strong> <strong>System</strong>s,Vol. 12, No. 1, February 1997, pp. 262 - 272.[64] Sam D et.al, “Local Severity Indices and Alarm Processing for Small Scale<strong>Power</strong> <strong>System</strong>s”, Proceedings of the American Control Conference,Arling<strong>to</strong>n, USA, June 25 - 27, 2001.[65] Crow M.L, Lesieutre B.C, “Voltage collapse”, IEEE Potentials, Vol. 13,No.2, April 1994, pp. 18 - 21.[66] Kulkarni S.S et.al, ”New perceptions in integrated power system operationand control”, Proceedings of IEEE Region 10 International Conference onGlobal Connectivity in Energy, Computer, Communication and Control,1998, pp. 489 - 496.[67] Yabe K et.al, ”Conceptual Designs of AI-based <strong>System</strong>s for LocalPrediction of Voltage Collapse”, IEEE Transactions on <strong>Power</strong> <strong>System</strong>s,Vol. 11, No. 1, February 1996, pp. 137 - 145.[68] Momoh J.A, Zhang Y, ”Voltage Stability Estimation”, Proceedings ofIEEE International Conference on <strong>System</strong>s, Man and Cybernetics, 1990,pp. 94 - 97.[69] Begovic M.M, Phadke A.G, ”Voltage stability assessment throughmeasurement of a reduced state vec<strong>to</strong>r”, IEEE Transactions on <strong>Power</strong><strong>System</strong>s, Vol. 5, No. 1, February 1990, pp. 198 - 203.[70] Chiang H-D, René J-J, ”Toward a Practical Performance Index forPredicting Voltage Collapse in Electric <strong>Power</strong> <strong>System</strong>s”, IEEETransactions on <strong>Power</strong> <strong>System</strong>s, Vol. 10, No. 2, May 1995, pp. 584- 592.[71] Canizares C.A et.al, ”Comparison of Performance Indices for Detection ofProximity <strong>to</strong> Voltage Collapse”, IEEE Transactions on <strong>Power</strong> <strong>System</strong>s,Vol. 11, No. 3, August 1996, pp. 1441 - 1450.[72] Madan S, Bollinger K.E, ”Artificial Intelligence Assisted Voltage StabilityEnhancement”, Proceedings of Canadian Conference on Electrical andComputer Engineering, 1996, pp. 392 - 395.[73] De Angelis G et.al, ”Transient voltage stability signature in time domainsimulations”, Proceedings of MELECON 8th MediterraneanElectrotechnical Conference, 1996, pp. 859 - 862.66
References[74] Löf P.A et.al, ”Fast calculation of a voltage stability index”, IEEETransactions on <strong>Power</strong> <strong>System</strong>s, Vol. 7, No. 1, February 1992, pp. 54 - 64.[75] Tamura Y et.al, ”Voltage Instability Proximity Index (VIPI) Based onMultiple Load Flow Solutions in Ill-conditioned <strong>Power</strong> <strong>System</strong>s”,Proceedings of the 27th Conference on Decision and Control, Austin,Texas, USA, December, 1988.[76] Tamura Y et.al, ”Relationship between voltage instability and multipleload flow solutions in electric power systems”, IEEE Transactions on<strong>Power</strong> Apparatus and <strong>System</strong>s, Vol. 102, No. 5, May 1983, pp. 1115 -1125.[77] Vu K et.al, ”Use of Local Measurement <strong>to</strong> Estimate Voltage-StabilityMargin”, IEEE Transactions on <strong>Power</strong> <strong>System</strong>s, Vol. 14, No. 3, August1999, pp. 1029- 1035.[78] Vu K et.al, ”Voltage Instability Predic<strong>to</strong>r (VIP) and Its Applications”,Proceedings of PSCC 99 Conference, June, 1999.[79] Vu K et.al, ”Grids Get Smart <strong>Protection</strong> and Control”, IEEE ComputerApplications in <strong>Power</strong>, Oc<strong>to</strong>ber, 1997.[80] Julian D.E et.al, ”Quantifying Proximity To Voltage Collapse Using TheVoltage Instability Predic<strong>to</strong>r (VIP)”, Proceedings of IEEE <strong>Power</strong>Engineering Society Summer Meeting, 2000, pp. 931 - 936.[81] Moghavvemi M, Omar F.M, ”Technique for contingency moni<strong>to</strong>ring andvoltage collapse prediction”, IEE Proceedings on Generation,Transmission and Distribution, Vol. 145, No. 6, November 1998, pp. 634- 640.[82] Moghavvemi M, Omar F.M, ”A Line Outage Study for Prediction of StaticVoltage Collapse”, IEEE <strong>Power</strong> Engineering Review, Vol. 18, No. 7, July1998, pp. 52- 54.[83] Moghavvemi M, Faruque M.O, ”Estimation of Voltage Collapse fromLocal Measurement of Line <strong>Power</strong> Flow and Bus Voltages”, Proceedingsof International Conference on Electric <strong>Power</strong> Engineering (<strong>Power</strong>Tech).Budapest, 1999, pp. 77.[84] Chiang H-D et.al, ”On voltage collapse in electric power systems”,Proceedings of <strong>Power</strong> Industry Computer Application Conference (PICA),1989, pp. 342 - 349.67
References[85] Chiang H-D et.al, ”On voltage collapse in electric power systems”, IEEETransactions on <strong>Power</strong> <strong>System</strong>s, Vol. 5, No. 2, May 1990, pp. 601 - 611.[86] Jasmon G.B et.al, ”Prediction of voltage collapse in power systems usinga reduced system model”, International Conference on Control, 1991, pp.32 - 36.[87] Marceau R.J et.al, ”Fourier methods for estimating power system stabilitylimits”, Proceedings of the <strong>Power</strong> Industry Computer ApplicationConference, 1993, pp. 418 - 425.[88] Marceau R.J et.al, ”Fourier methods for estimating power system stabilitylimits”, IEEE Transactions on <strong>Power</strong> <strong>System</strong>s, Vol. 9, No. 2, May 1994,pp. 764 - 771.[89] DeMarco C.L, Overbye T.J, ”An energy based security measure forassessing vulnerability <strong>to</strong> voltage collapse”, IEEE Transactions on <strong>Power</strong><strong>System</strong>s, Vol. 5, No. 2, May 1990, pp. 419 - 427.[90] Overbye T.J et.al, ”A composite framework for synchronous and voltagestability in power systems”, Proceedings of IEEE InternationalSymposium on Circuit and <strong>System</strong>s, 1992, pp. 2541 - 2544.[91] Gubina F, Strmcnik B, ”Voltage Collapse Proximity Index DeterminationUsing Voltage Phasors Approach”, IEEE Transactions on <strong>Power</strong> <strong>System</strong>s,Vol. 10, No. 2, May 1995, pp. 788 - 794.[92] Verbic G, Gubina F, ”A new concept of <strong>Protection</strong> against VoltageCollapse Based on Local Phasors”, Proceedings of <strong>Power</strong>Con 2000, 2000,pp. 965 - 970.[93] Guo R et.al, ”Preventive/Corrective Control for Voltage Stability UsingPredic<strong>to</strong>r-Correc<strong>to</strong>r Interior Method”, Proceedings of <strong>Power</strong>Con 1998,1998, pp. 1513 - 1517.[94] Tuglie E.D et.al, ”Real-time preventive actions for the enhancement ofvoltage-degraded trajec<strong>to</strong>ries”, IEEE Transactions on <strong>Power</strong> <strong>System</strong>s,Vol. 14, No. 2, May 1999, pp. 561 - 568.[95] Tuglie E.D et.al, ”A Corrective Control for Angle and Voltage StabilityEnhancement on the Transient Time-Scale”, IEEE Transactions on <strong>Power</strong><strong>System</strong>s, Vol. 15, No. 4, November 2000, pp. 1345- 1353.68
References[96] Hui K.C, Short N.J, ”Voltage security moni<strong>to</strong>ring, prediction and controlby neural networks”, Proceedings of IEE International Conference onAdvances in <strong>Power</strong> <strong>System</strong> Control, Operation and Management,November 1991, Hong Kong.[97] Momoh J.A et.al, ”Investigation of Artificial Neural Networks for VoltageStability Assessment”, Proceedings of IEEE International Conference on<strong>System</strong>s, Man and Cybernetics, 1995, pp. 2188 - 2192.[98] Chen D, Mohler R, “Load modelling and voltage stability analysis byneural networks”, Proceedings of the American Control Conference, June1997, Albuquerque, New Mexico, USA.[99] Belhadj C.A et.al, “Voltage stability estimation and prediction usingneural network”, Proceedings of <strong>Power</strong>Con 1998, 1998, pp. 1464 - 1467.[100] Dinavahi V.R, Srivastava S.C, “ANN Based Voltage Stability MarginPrediction”, Proceedings of IEEE <strong>Power</strong> Engineering Society SummerMeeting, 2001, pp.1275 - 1280.[101] Moors C et.al, ”Load Shedding Controllers against Voltage Instability: acomparison of designs”, Proceedings of IEEE Por<strong>to</strong> <strong>Power</strong> Tech.Conference, Por<strong>to</strong>, Portugal, September 10 - 13, 2001.[102] Arnborg S, ”Emergency Control of <strong>Power</strong> <strong>System</strong>s in Voltage Unstableconditions”, Ph.D thesis, ISSN 1100-1607, S<strong>to</strong>ckholm, Sweden, 1997.[103] Balanathan R et.al, ”Undervoltage load shedding for induction mo<strong>to</strong>rdominant loads considering P,Q coupling”, IEE Proceedings onGeneration, Transmission and Distribution, Vol. 146, No. 4, July 1999, pp.337- 342.[104] Tso S.K et.al, ”Evaluation of load shedding <strong>to</strong> prevent dynamic voltageinstability based on extended fuzzy reasoning”, IEE Proceedings onGeneration, Transmission and Distribution, Vol. 144, No. 2, March 1997,pp. 81 - 86.[105] Balanathan R et.al, ”Undervoltage load shedding <strong>to</strong> avoid voltageinstability”, IEE Proceedings on Generation, Transmission andDistribution, Vol. 145, No. 2, March 1998, pp. 175 - 181.[106] Tuan T.Q et.al, ”Emergency load shedding <strong>to</strong> avoid risks of voltageinstability using indica<strong>to</strong>rs”, IEEE Transactions on <strong>Power</strong> <strong>System</strong>s, Vol. 9,No. 1, February 1994, pp. 341 - 351.69
References[107] Lemmon W.W et.al, ”Transient stability prediction and control in realtimeby QUEP”, IEEE Transactions on <strong>Power</strong> <strong>System</strong>s, Vol. 4, No. 2, May1989, pp. 627 - 642.[108] Dong Y, Pota H.R, ”Transient stability margin prediction using equal-areacriterion”, IEE Proceedings on Generation, Transmission and Distribution,Vol. 140, No. 2, March 1993, pp. 96 - 104.[109] Redfern M.A, Checksfield M.J, ”A new pole slipping protection algorithmfor dispersed s<strong>to</strong>rage and generation using the equal area criterion”, IEEETransactions on <strong>Power</strong> <strong>System</strong>s, Vol. 10, No. 1, January 1995, pp. 194 -202.[110] Tso S.K, Cheung S.P, “Fast prediction of transient stability margin insystems with SVC control and HVDC link”, Proceedings of EMPD 95International Conference on Energy Management and <strong>Power</strong> Delivery,1995, pp. 456 - 461.[111] Wang L et.al, “Quantitative search of transient stability limits usingEEAC”, Proceedings of IEEE <strong>Power</strong> Engineering Society SummerMeeting, 1997.[112] Pavella M et.al, “An approach <strong>to</strong> real-time transient stability assessmentand control”, Proceedings of IEEE <strong>Power</strong> Engineering Society SummerMeeting, 1997.[113] Ah King R.T.F, Rughooputh H.C.S, “Real-time transient stabilityprediction using neural tree networks”, Proceedings of the IEEEInternational Conference on Intelligent <strong>System</strong>s for the 21st Century, June1995, pp. 2182 - 2187.[114] Yan P, “Pattern recognition techniques applied <strong>to</strong> the classification ofswing curves generated in a power system transient stability study”,Proceedings of the IEEE Southeastcon 2000, 2000, pp. 493 - 496.[115] Bretas N.G, Phadke A.G, “Real time instability prediction throughadaptive time series coefficients”, Proceedings of IEEE <strong>Power</strong>Engineering Society Winter Meeting, 1999, pp. 731 - 736.[116] Su M-C et.al, ”Neural-network based fuzzy model and its application <strong>to</strong>transient stability prediction in power systems”, IEEE Transactions on<strong>System</strong>s, Man and Cybernetics - Part C: Application and Reviews, Vol. 29,No. 1, February 1999, pp. 149 - 157.70
References[117] Ota Y et.al, “Evaluation of stability and electric power quality in powersystem by using phasor measurements”, Proceedings of <strong>Power</strong>Con 2000,2000, pp. 1335 - 1340.[118] Trotignon M et.al, ”Plan de défence du réseau THT Francais contre lesincidents généralisés: dispositions actuelles et perspectives d´évolution”,CIGRÉ Report 39-306, September, 1992, Paris, France.[119] Counan C et.al, ”<strong>Major</strong> incidents on the French electric system:potentiality and curative measures studies”, IEEE/PES Summer meeting,Paper 92 SM 432-5 PWRS, July, 1992, Seattle, USA.[120] Bidet M, ”Contingencies: system against losses of synchronism based onphase angle measurements”, IEEE/PES Winter meeting, Panel session onapplication and experiences in power system moni<strong>to</strong>ring with phasormeasurement, 1993.[121] Faucon O, Dousset L, Boisseau, Harmand Y, ”Coordinated Defence Plan- an integrated protection system”, CIGRÉ Report 200-07, Symposium,1995, Helsinki, Finland.[122] Denys P et.al, ”Measurement of voltage phase for the French futuredefence plan against losses of synchronism”, IEEE Transactions on <strong>Power</strong>Delivery, Vol. 7, No. 1, January 1992, pp. 62 - 69.[123] Lemoing H. et.al, ”Experiment of a satellite-type transmission network forthe defence plan”, SEE meeting, August 10, 1991, Paris.[124] Liu C-W, Thorp J, ”Application of synchronised phasor measurements <strong>to</strong>real-time transient stability prediction”, IEE Proceedings on Generation,Transmission and Distribution, Vol. 142, No. 4, July 1995, pp. 355 - 360.[125] Liu C-W et.al, ”New Methods for computing power system dynamicresponse for real-time transient stability prediction”, IEEE Transactions onCircuit and <strong>System</strong>s-I: Fundamental Theory and Applications, Vol. 47,No. 3, March 2000, pp. 324 - 337.[126] Minakawa T, “The required technological breakthrough in developinguniversal emergency control systems in terms with transient and dynamicstability”, Proceedings of IEEE <strong>Power</strong> Engineering Society WinterMeeting, 2000, pp. 66 - 71.71
References[127] Wang Y-J et.al, “A remedial control scheme protects against transientinstabilities based on Phasor Measurement Units (PMUs) - A case study”Proceedings of IEEE <strong>Power</strong> Engineering Society Summer Meeting, 2000,pp. 1191 - 1195.[128] Chang C-L et.al, ”Oscilla<strong>to</strong>ry stability analysis using real-time measureddata”, IEEE Transactions on <strong>Power</strong> <strong>System</strong>s, Vol. 8, No. 3, August 1993,pp. 823 - 829.[129] Sharaf A.M et.al, ”Transient stability and critical clearing timeclassification using neural networks”, Proceedings of IEE 2ndInternational Conference on Advances in <strong>Power</strong> <strong>System</strong> Control,Operation and Management, December 1993, Hong Kong, pp. 365 - 372.[130] Sharaf A.M et.al, ”Neural network pattern classification of transientstability and loss of excitation for synchronous genera<strong>to</strong>rs”, Proceedings ofIEEE International Conference on Neural Networks, 1994, pp. 2916 -2921.[131] Begovic M.M, Milisavljevic M, ”Moni<strong>to</strong>ring and Control of InterareaOscillations Via Real-Time Measurements and TCSC Control”,Proceedings of the Bulk <strong>Power</strong> <strong>System</strong> Dynamics and Control IV -Restructuring, San<strong>to</strong>rini, Greece, August 24 - 28, 1997.[132] Hemmingsson M et.al, “Estimation of electro-mechanical modeparameters using frequency measurements”, Proceedings of IEEE <strong>Power</strong>Engineering Society Winter Meeting, 2001.[133] Demarco C.L, “Identifying swing mode bifurcations and associated limitson available transfer capability”, Proceedings of the American ControlConference, Philadelphia, Pennsylvania, USA, June 1998.[134] Vittal V et.al, ”Transient stability analysis of stressed power systems usingthe energy function method”, IEEE Transactions on <strong>Power</strong> <strong>System</strong>s, Vol.3, No. 1, February 1988, pp. 239 - 244.[135] Chiang H-D et.al, “Direct stability analysis of electric power systems usingenergy functions: theory, applications, and perspectives”, Proceedings ofthe IEEE, Vol. 83, No. 11, November 1995 pp. 1497 - 1529.[136] Lo K.L et.al, “<strong>Power</strong> system transient stability analysis by using modifiedKohonen network”, Proceedings of IEEE International Conference onNeural Networks, 1995, pp. 893 - 898.72
References[137] Marceau R.J et.al, “Signal energy search strategies for transient stabilitytransfer limit determination”, Proceedings of IEEE <strong>Power</strong> EngineeringSociety Summer Meeting, 1997.[138] Marceau R.J, Soumare S, ”A unified approach for estimating transient andlong-term stability transfer limits”, IEEE Transactions on <strong>Power</strong> <strong>System</strong>s,Vol. 14, No. 2, May 1999, pp. 693 - 701.[139] Tao W, Liu S, “Stability limits prediction by second order sensitivity basedBCU method with structure preserving model”, Proceedings of <strong>Power</strong>Con1998, 1998, pp. 1325 - 1330.[140] Morioka Y et.al, ”<strong>System</strong> separation equipment <strong>to</strong> minimize power systeminstability using genera<strong>to</strong>r’s angular-velocity measurement”, IEEETransactions on <strong>Power</strong> Delivery, Vol. 8, No. 3, July 1993, pp. 941 - 947.[141] Tang C.K et.al, ”Transient stability index from conventional time domainsimulation”, IEEE Transactions on <strong>Power</strong> <strong>System</strong>s, Vol. 9, No. 3, August1994, pp. 1524 - 1530.[142] Sun J.H, Lo K.L, “Transient stability real-time prediction for multimachinepower systems by using observation”, Proceedings of TENCON'93, IEEE Region 10 Conference on Computer, Communication, Controland <strong>Power</strong> Engineering, 1993, pp. 217 -221.[143] Auckland D.W et.al, ”Artificial neural network-based method for transientresponse prediction”, IEE Proceedings on Generation, Transmission andDistribution, Vol. 142, No. 3, November 1995, pp. 323 - 329.[144] Qingsheng L et.al, “Real-time prediction and control for transient stabilityof multi-machine power system”, Proceedings of <strong>Power</strong>Con 1998, 1998,pp. 1361 - 1363.[145] Daoud A.A et.al, “A new fast-learning algorithm for predicting powersystem stability”, Proceedings of IEEE <strong>Power</strong> Engineering Society WinterMeeting, 2001, pp. 594 - 598.[146] Lyapunov A.M, ”General problem of stability of motion”, (Englishtranslation) Academic Press, Inc., 1967.[147] Machowski J et.al, “<strong>Power</strong> system dynamics and stability”, ISBN 0-471-95643-0, John Wiley & Sons, 1998.73
References[148] Ejebe G.C et.al, “Transient energy based screening and moni<strong>to</strong>ring forstability limits”, Proceedings of IEEE <strong>Power</strong> Engineering Society SummerMeeting, 2001.[149] Wang L, Girgis A.A, ”A new method for power system transient instabilitydetection”, IEEE Transactions on <strong>Power</strong> Delivery, Vol. 12, No. 3, July1997, pp. 1082 - 1089.[150] Hiskens I.A, Akke M, ”Analysis of the Nordel power grid disturbance ofJanuary 1, 1997 using trajec<strong>to</strong>ry sensitivities”, IEEE Transactions on<strong>Power</strong> <strong>System</strong>s, Vol. 14, No. 3, August 1999, pp. 987- 994.[151] Mannerback K-J, Rydberg J, ”On line fault identification algorithms onsevere fault conditions in weak network supported by HVDC light”,Master-thesis, Department of Electrical <strong>Power</strong> Engineering, CHALMERS,2001.[152] Chang C.S, ”A hybrid model for transient stability evaluation ofinterconnected longitudinal power systems using neural network/patternrecognition approach”, IEEE Transactions on <strong>Power</strong> <strong>System</strong>s, Vol. 9, No.1, February 1994, pp. 85- 92.[153] Huang K et.al, ”Neural-net based critical clearing time prediction in powersystem transient stability analysis”, Proceedings of IEE 2nd InternationalConference on Advances in <strong>Power</strong> <strong>System</strong> Control, Operation andManagement, December 1993, Hong Kong, pp. 679 - 683.[154] Rovnyak S et.al, ”Decision trees for real-time transient stabilityprediction”, IEEE Transactions on <strong>Power</strong> <strong>System</strong>s, Vol. 9, No. 3, August1994, pp. 1417 - 1426.[155] Liu C-W et.al, ”Detection of transiently chaotic swings in power systemsusing real-time phasor measurement”, IEEE Transactions on <strong>Power</strong><strong>System</strong>s, Vol. 9, No. 3, August 1994, pp. 1285 - 1292.[156] Tso S.K et.al, ”Fuzzy assessment of power system transient stability levelbased on steady-state data”, IEE Proceedings on Generation, Transmissionand Distribution, Vol. 144, No. 6, November 1997, pp. 525 - 531.[157] Xinli S et.al, “A fuzzy theory based principle <strong>to</strong> distinguish stable swingsand unstable swings in complicated power systems”, Proceedings of<strong>Power</strong>Con 1998, 1998, pp. 1091 - 1095.74
References[158] Liu C-W et.al, ”Application of a novel fuzzy neural network <strong>to</strong> real-timetransient stability swings prediction based on synchronized phasormeasurement”, IEEE Transactions on <strong>Power</strong> <strong>System</strong>s, Vol. 14, No. 2, May1999, pp. 685 - 692.[159] Jonsson M, “Present Status of <strong>System</strong> <strong>Protection</strong> Schemes“, Tech.Report23R, ISSN 1401-6167, Chalmers University of Technology, Gothenburg,Sweden, 2002.[160] Fismen S.A, ”Nettvern i Nordel-området”, NOSY-rapport, June 29, 1992,Oslo, Norway, (in Norwegian).[161] Janset O.P, ”Nettvern i Nordel-området”, NOSY-rapport, status 2000,Oslo, Norway, (in Norwegian).[162] CIGRÉ TF 38-02-08, ”Long Term Dynamics Phase II”, 1995.[163] Jonsson M, Daalder J, “Distance <strong>Protection</strong> and Voltage Stability“,<strong>Power</strong>Con 2000, December 4-7, Perth, Australia, Proceedings Vol.2, pp.971-976.75
76References
Appendix ISummary of Important SPS Features<strong>System</strong>typeSub-system being a part of alarge power networkSeparate systems not synchronouslyinterconnected <strong>to</strong> othersystems or by far the largest subsystemin a power networkNetworkstructureDensely meshedsystemwith dispersedgeneration anddemandLightly meshedsystemwith localisedcentres of generationanddemandDensely meshedsystemwith dispersedgeneration anddemandLightly meshedsystemwith localisedcentres of generationanddemandPhenomenaThermaloverloadVoltageinstabilityTransientinstability(oscillations)FrequencyinstabilityIndica<strong>to</strong>rsLocal:-<strong>Power</strong> flowson lines-Genera<strong>to</strong>routput-Temperatureof networkelementsLocal:-Voltage.-Reactive reserves/losses-MW/MVArdemand-Tap-changerposition-Field/armaturecurrentlimitersLocal:-<strong>Power</strong>/Voltgeswings-Large powerflows-Genera<strong>to</strong>routputWide area:-ExcessivephasedisplacementLocal:-Frequency-Rate ofchange offrequency-Loss of loadcentre-Loss ofsupply-Tie-linepower flowControlactionsLocal orRemote:-Genera<strong>to</strong>rrescheduling-Genera<strong>to</strong>r/load sheddingLocal orRemote:-Shunt switch.-HVDC-Reduce Voltageset-point-Unit start-up-LTC blocking-Load sheddingLocal orRemote:-Gen./Loadshedding-Fast valving-HVDC-Shunt switch.-<strong>System</strong> separationLocal orRemote:-Gen./Loadshedding-Fast valving-HVDC-Shunt switch.-<strong>System</strong> separation77
Paper AAn adaptive scheme <strong>to</strong> prevent undesirabledistance protection operation during voltageinstabilityM. Jonsson, J. DaalderAccepted for IEEE Transactions on <strong>Power</strong> Delivery
An Adaptive Scheme <strong>to</strong> Prevent Undesirable Distance<strong>Protection</strong> Operation During Voltage InstabilityMattias Jonsson, Student member, IEEE, and Jaap DaalderAbstract: An adaptive algorithm <strong>to</strong> prevent undesirable distance protectionoperations during voltage instability is proposed. The algorithmis based on mathematical logic blocks and uses the rate ofchange of voltage as an additional relay criteria <strong>to</strong> increase the relaysecurity with respect <strong>to</strong> voltage instability.Studies are based on simulations using two different test systems;a fifteen bus system developed by the authors and the Nordic32 system.The investigation shows that undesirable zone 3 distance relayoperations can be the difference between a blackout and a recoveringsystem during voltage instability. However simulations have shownthat the adaptive algorithm may save the system from a collapse.Although the algorithm prevents mal-trips due <strong>to</strong> voltage instabilitythe reach of the distance relay will not be restricted.Keywords: Adaptive relaying, Distance protection, Remote back-up,Voltage stability.I. INTRODUCTIONThis work was financially supported by Svenska Kraftnät.Mattias Jonsson and Jaap Daalder are both with Department of Electric<strong>Power</strong> Engineering, Chalmers University of Technology, 412 96 Gothenburg,Sweden. Their e-mail addresses are mattias.jonsson@elteknik.chalmers.seand jaap.daalder@elteknik.chalmers.se.Undesirable (zone 3) distance relay operations have contributed<strong>to</strong> voltage collapses world wide. The most well knownincident is perhaps the July 2, 1996 outage in the WSCCsystem [1] where zone 3 mal-trips occurred which gave rise <strong>to</strong>the collapse. Other examples are Brazil 1999 [2] and Sweden1983 [3].Zone 3 distance relays are mainly used <strong>to</strong> provide remoteback-up protection for adjacent sections of transmission circuits.In the ideal case the entire length of all adjacent circuitsare back-up protected. However long lines, infeed and loadencroachment may cause difficulties <strong>to</strong> obtain that result in asecure manner. It is the opinion of the authors that uncontrolleddisconnection of power lines should be avoided duringvoltage instability. For example distance relays should not triptransmission lines prior <strong>to</strong> the disconnection of genera<strong>to</strong>rs bytheir own protection equipment as this possibly will causecascading outages when all of the remaining generationcapacity is further used. Thus where transmission lines areprovided with duplicate main protection and/or where difficultieswith settings exist there may be reason for not applyingzone 3 distance element at all, as the zone 3 protectionwill offer little improvement in fault clearance but may form aconsiderable threat <strong>to</strong> system security. However many utilitiesrely on non-duplicated line protection systems using remoteback-up as their standard solution. Furthermore, for systemsapplying duplicated line protection and no remote back-up,maintenance of one of the protection groups will lead <strong>to</strong> atemporary absence of back-up protection. The algorithm proposedhere facilitates these situations as it is a cost-effectiveand plain way of improving the relay security with respect <strong>to</strong>voltage instability.Adaptive relaying is a suitable <strong>to</strong>ol in case of stressedpower system conditions. In [4] a scheme is described wheredependability is provided during normal system conditionsbut security is emphasized during abnormal conditions. Thesame approach is used for the algorithm proposed here <strong>to</strong>avoid load encroachment during voltage instability.Modern numerical relays give a wide range of relay inputs<strong>to</strong> choose between and thus unique protection schemes caneasily be developed. The algorithm proposed here utilizesthese new possibilities by using the derivative of the voltageas relay input. Additionally the algorithm is based on mathematicallogic blocks which makes it easy <strong>to</strong> realize for numericalrelays where the relay scheme is developed in a userfriendly computer software.The type of events addressed in this paper are rare occasions.However, when they occur usually a major part of thesystem load is affected. Hence these disturbances may beextremely costly and can cause much social inconvenience. Itis likely that the frequency of these occasions will increase inthe future as power systems are operated closer <strong>to</strong> their stabilitylimits due <strong>to</strong> environmental constraints and deregulation.II. DISTANCE RELAYS MAY CONTRIBUTE TO VOLT-AGE INSTABILITYVoltage instability is a phase symmetrical phenomenon.Hence no zero sequence component is present and the phasevoltages and currents are symmetrical. Thus the apparentimpedance Z r as seen by a distance relay during voltage insta-
ility corresponds <strong>to</strong> (1). Here U is the line <strong>to</strong> line voltage andP and Q are the injected active and reactive power at the locationof the relay.U 2 ⋅ ( P + jQ)Z r = ----------------------------------P 2 + Q 2In case Z r remains within the area of one of the pre-definedzones of operation during a time exceeding the setting of thetimer associated <strong>to</strong> the zone, the relay will operate. Lowsystem voltages and high (reactive) power flows are typicalfeatures of voltage instability events. It follows from (1) thatthese events may cause distance relays <strong>to</strong> mal-trip. Thisbehaviour is undesirable since it will aggravate the status ofthe power system in an already severe situation.Undesirable relay operations due <strong>to</strong> voltage instability willmainly be initiated by the zone with the longest reach. Normallythis is the zone used for remote back-up protectionwhich usually is zone 3. Accordingly the algorithm proposedhere is presented with respect <strong>to</strong> zone 3 but can obviously beapplied on any zone.III. AN ADAPTIVE ALGORITHM TO PREVENT MAL-TRIPS DUE TO VOLTAGE INSTABILITYFor numerical relays it is usually possible <strong>to</strong> choose betweendifferent setting groups; i.e choose different settings of thezones of operation depending on the prevailing power systemstate. This could be done by the relay itself; e.g. based on avoltage criterion or manually by the opera<strong>to</strong>r.The adaptive part of the algorithm proposed here is basedon the same principle but instead of solely changing the reachof the zones of operation the whole relay algorithm is changedaccording <strong>to</strong> Fig. 1. During normal operation the conventionaldistance protection algorithm is used but when a stressedoperation condition occurs, where security is more of an issue,the relay switches <strong>to</strong> the algorithm in Fig. 2. The criterionused <strong>to</strong> decide which algorithm <strong>to</strong> be applied may be based onthe voltage level, the reactive power or the impedance methodproposed in [5].The algorithm in Fig. 2 may also be used as a non-adaptivealgorithm where it is applied as the exclusive distance relayalgorithm.(1)Normal operationYesConventionaldistance protectionalgorithmFig. 1. Adaptive distance relay.The algorithm proposed in Fig. 2 is based on simple mathematicallogic blocks where the dependability is decreased andthe security is increased as compared <strong>to</strong> traditional distancerelaying. The idea is not only <strong>to</strong> consider the relation betweenthe apparent impedance and the zones of operation but alsothe different events which occur in the system when the zone3 is entered. These events can be determined from changes inthe voltage.When a short circuit fault occurs the change of the voltageis substantial in the faulted phases in the area close <strong>to</strong> thelocation of the fault [6]. In case of voltage instability the voltagechanges are mostly low <strong>to</strong> moderate until close <strong>to</strong> the finalcollapse. Hence the derivative of the voltage may be used <strong>to</strong>distinguish between short circuit faults and voltage changesdue <strong>to</strong> stressed system conditions. In the algorithm of Fig. 2the voltage is measured continuously and used as an input.The main challenge in the algorithm is <strong>to</strong> determine the differenttypes of events based only on information from the derivativeof voltage, and this with a high degree of reliability.However simulations and measurements have shown thatthere is a considerable difference between a short circuit fault,a fault clearance and other power system events.It is important that the relay will operate as planned when ashort circuit fault occurs at the same time as voltage instabilityis present. Therefore when the apparent impedance hasentered the zone 3 the derivative of the voltage is continuouslyanalysed and thus used <strong>to</strong> detect short circuit faults. InFig. 2 the quantities with a subscript (except t start which isassociated <strong>to</strong> the start of the timer) are given a fixed value bythe relay opera<strong>to</strong>r. The remaining quantities are continuouslyupdated by the relay during operation. Throughout operationthe pre-set values are compared with the real-time updatedvalues <strong>to</strong> obtain correct relay activity.NoThe algorithmin Fig.2
Block 5: Waits for the fault <strong>to</strong> be cleared by primaryprotection.t 3delay = time delay associated <strong>to</strong> zone 3.Withinzone 31YESNONOBlocks 6 <strong>to</strong> 9 may be implemented in the algorithm when distanceprotection is used <strong>to</strong> protect overhead lines due <strong>to</strong> thermaloverload etc.∆V∆t≤3∆V∆t2t start =tfaultmaximumYESNOT ≥ T max6YES7 t T,start =tBlock 6 & 8: Checks if the line temperature T exceeds thepre-set maximum limit.T max = maximum allowed temperature in thecircuit.YESNO∆V∆t≥∆V∆t4NOfault clearminimumt-t start ≥ t 3delay5YESt-t T,start ≥ t T,delaySend a tripsignal <strong>to</strong>the circuit breakerFig. 2. Relay algorithm used during voltage instability.The following is a description of the block functions.Block 1: Checks if the apparent impedance is within zone 3.Block 2: Decides if a short circuit fault has occurred.When a fault occurs ∆V/∆t will have a negativevalue with a large magnitude.∆V ∆V------ ≤ ------ faultmaximum∆t ∆t∆V------∆tBlock 3: The timer associated <strong>to</strong> zone 3 is started.t start = time when zone 3 is entered.Block 4: Decides if the fault is cleared by primary protection.When the fault is cleared ∆V/∆t will have apositive value with a large magnitude.∆V------∆tNOT ≥ T max89YESYESNOA fault has occured.∆V> ------ faultmaximum No fault has occured.∆t≥∆V------∆tfault clearminimumThe fault has been cleared.∆V ∆V------ < ------ fault clear The fault has not been cleared.minimum∆t ∆tBlock 7: Timer is started for the thermal overload protection.t T, start = time when the maximum allowedtemperature is reached.Block 9: Regulates temporary overload.t T,delay = time delay associated <strong>to</strong> the thermaloverload protection.Most cases are handled well by the algorithm. However a fewcases may cause the algorithm difficulties <strong>to</strong> operate asplanned. The reason for this is that unexpected values of thederivative of the voltage may occur for some events in combinationwith tight or wrong settings of the parameters. Themost dangerous case is when a voltage step increasing actionoccurs between a short circuit fault and a fault clearance.Block 4 may apprehend the positive voltage step as faultclearance by primary protection. Thus the algorithm will notclear the fault. During voltage instability scenarios load sheddingand manually or au<strong>to</strong>matic capaci<strong>to</strong>r switching may bethe source of this type of problem. Shunt capaci<strong>to</strong>r switchingwill not have a significant impact during the time when a faultis present as the voltage will be extremely low and therefore acapaci<strong>to</strong>r will not increase the voltage much when it is connected.When load shedding is performed some communicationdevice can be used in combination with logic blocks <strong>to</strong>set the output from block 4 <strong>to</strong> NO during the moment ofaction. In this way the security will be increased.Most likely current limiters will be activated and genera<strong>to</strong>rstripped during a severe voltage instability. This will causevoltage decays of a more or less outspoken nature. Close <strong>to</strong> acollapse the negative derivative of the voltage may be difficult<strong>to</strong> distinguish from the one caused by a short circuit fault. Stillit is undesirable that these negative derivatives are treated asfaults. These inadequacies can be avoided by using communicationdevices. When a genera<strong>to</strong>r is tripped or a current limiteractivated a notifying signal can be sent <strong>to</strong> the relayswithin the affected region. Hence the output from block 2 canbe set <strong>to</strong> NO for a few cycles and the event will not be treatedas a fault.
To find suitable values of the settings, events such as shuntcapaci<strong>to</strong>r switching, line tripping, load shedding and short circuitfaults must be considered for each relay bus at differen<strong>to</strong>peration modes. Modern communication technology has createdthe possibility for centralised calculation of settings andlocal in-service adjustment and therefore suits the purposewell. A computer based network model may be used for onlinecalculations. Hence the relay settings can continuously beupdated <strong>to</strong> the prevailing power system condition. Todaythese type of calculations are usually done manually.One may ask oneself, why not use the derivative of themeasured impedance as a criterion in the algorithm? Simulationshave shown that the derivative of the impedance doesnot act logically stringent for similar power system occurrences;especially when long and heavily loaded lines are considered.Also the fault location versus relay bus location has astrong influence on the apparent impedance in the R-X diagram;e.g if a fault occurs on an adjacent or a parallel line.The derivative of the resistance and reactance has similar disadvantagescompared <strong>to</strong> the derivative of the impedance.Another disadvantage is that the derivative of the impedanceis more complicated <strong>to</strong> obtain as compared <strong>to</strong> the derivative ofthe voltage.The discussion in this paper is <strong>to</strong> demonstrate the principlesof a new adaptive algorithm. In case of actual implementationattention has <strong>to</strong> be paid <strong>to</strong> practical issues such as communicationdevices, data memory, window size, noise in measurementsetc. Also when the algorithm is programmed somefunctions have <strong>to</strong> be added. For instance in case of a short circuitfault occurring at the same time as the line is overloaded,block 2 has <strong>to</strong> be activated in parallel with the alternatingblocks 8 and 9. Depending on how t T,delay is chosen in relationwith t 3delay a timer coordination may be necessary <strong>to</strong> determinewhether the trip signal will be sent due <strong>to</strong> the short circuitfault or due <strong>to</strong> the overload.IV. TEST SYSTEMSTwo different test systems have been used for simulations.The first one is a 15 bus system representative for the Swedishtransmission grid; the second is the more extensive Nordic32system [7]. The 15 bus system is mainly used <strong>to</strong> illustrate theperformance of the adaptive algorithm while the Nordic32system is used <strong>to</strong> compare results of the 15 bus system withresults of a more comprehensive grid.Fig. 3 shows the 15 bus system. Two voltage levels areused, where the main part of the equipment is connected <strong>to</strong> the400 kV level. However, the loads and a few shunt devices areconnected <strong>to</strong> the 130 kV level.5x400 MVA1x400 MVAbus 34bus 22x500 MVAbus 35x500 MVAbus 4bus 1~~ ~NORTH~ ~MIDDLEF 2bus 342SOUTHP 342Q 3422x1000 MVA, 1x500 MVA5x400 MVA800 Ω500 Ω2x500 MVA1x400 MVA350 Ω180 Ω350 Ω500 ΩFig. 3. The fifteen bus system representative for the Swedish system.The generation in the system is a mixture of hydro- and nuclearpower. All genera<strong>to</strong>r units are equipped with field current limiters,in addition the nuclear units have sta<strong>to</strong>r current limiters. Inthe NORTH area, all genera<strong>to</strong>rs are hydro units which areresponsible for the frequency control; in the MIDDLE andSOUTH areas the nuclear power units have a fixed active output.The loads in the MIDDLE and SOUTH areas dominate the<strong>to</strong>tal consumption in the system. Thus a large amount of powerwill be transported from NORTH <strong>to</strong> MIDDLE and also fromMIDDLE <strong>to</strong>wards SOUTH. The transmission lines betweenbus 2 and bus 3 are equipped with serie capaci<strong>to</strong>rs giving a linecompensation of 50 %. Observe that the electrical parallel circuitsin the system are not considered <strong>to</strong> be geographically parallel.The load models used in the system are based on theexperimental work of le Dous et al. [8] and all the other modelsare identical <strong>to</strong> the ones applied in the Nordic32 system [7].When the reach of the zone 3 element is determined infeed isconsidered and the idea is that the whole length of all adjacentlines should be protected.V. SIMULATIONS IN THE 15 BUS SYSTEMThe simulations have been performed in SIMPOW [9] and theimprovement due <strong>to</strong> the adaptive algorithm is demonstrated. For~350 km250 km 250 km250 km200 kmbus 12bus 22bus 32bus 42F 1P 12Q 12P 32Q 32P 42Q 42P 22Q 22180 Ω100 Ω
illustration both the mho and quadrilateral relay characteristicsare used.At the pre-fault state the system is heavily loaded in theSOUTH area. The power transfer from bus 3 <strong>to</strong>wards bus 34 isabout 2200 MW and from bus 34 <strong>to</strong> bus 4 around 1200 MW. Theinitial disturbance F 1 is a permanent three phase short circuit faulthaving zero fault resistance and located in the middle of one ofthe transmission lines between bus 34 and bus 4. The fault iscleared by the primary protection. To further demonstrate the performanceof the algorithm in Fig. 2 an additional fault F 2 isapplied. This fault is a busbar fault at bus 342 and occurs whenthe apparent impedance already has entered the zone 3.Fig. 4 shows the voltages at bus 3 and bus 34 before and afterthe faults. When conventional zone 3 distance relaying is appliedwith settings based on the criteria mentioned earlier the systemwill collapse approximately 83 seconds after the initial fault independen<strong>to</strong>f the shape of the operating zone used. In the case ofmho relays the collapse will be initiated by the zone 3 elements atbus 3 protecting the lines between bus 3 and bus 34; Fig. 5. Whenquadrilateral relays are used the collapse will be initiated by thezone 3 element located at bus 34 protecting the remaining linebetween bus 34 and bus 4. This should be compared with the situationthat either the reach of the conventional relays is decreasedor the algorithm in Fig. 2 is applied. In these cases the system willrecover <strong>to</strong> a stable operating point. Without the adaptive algorithmthe reach of the mho relays at bus 3 protecting the linesbetween bus 3 and bus 34 must be decreased <strong>to</strong> avoid a voltagecollapse. If this approach is applied only 60 % or less of the adjacentlines will be remote back-up protected. When quadrilateralrelays are in operation their reach at bus 34 must be decreased inresistive direction from 105 Ω <strong>to</strong> about 85 Ω <strong>to</strong> avoid a collapse.The collapse plotted in Fig. 4 is valid for the case of mho relays.1: Pre fault state.1-2: At t=5 s a permanent three phase fault (F 1 ) occurson one of the lines between bus 34 and bus 4.2-3: At t=5.09 s the fault is cleared.3-4: At t=5.5 s the shunt capaci<strong>to</strong>r at bus 32 is connectedand the reac<strong>to</strong>rs at bus 1 and bus 2 are disconnected.4-5: At t=5.8 s au<strong>to</strong> reclosing.5-6: At t=5.89 s the faulted line is permanently disconnected.6-8: The impedance as seen by the relays is slowlydecreasing due <strong>to</strong> decreasing voltages and increasing(reactive) power flows.7: At t=87.2 s the zone 3 of the mho relays located atbus 3 protecting the lines between bus 3 and bus 34are entered. About the same time zone 3 of thequadrilateral relay located at bus 34 protecting theremaining line between bus 34 and bus 4 is alsoentered.8-9: At t=250 s a bus fault (F 2 ) occurs at bus 342.9-10: At t=250.09 s the bus fault is cleared.11: The system starts <strong>to</strong> recover and will attain a stableoperating mode.Voltage [pu]1.41.31.21.110.967Voltage [pu]1.21.110.90.80.70.60.515 5.2 5.4 5.6 5.8 6Time [s]The Adaptivealgorithm inoperation or thereach of zone 3is decreased.0.88Zone 3 relays withnormal settingsin operation.90.70 50 100 150 200 250 300Time [s]V bus 3V bus 34Fig. 4. Voltages at bus 3 and bus 34. In case of normal zone 3 settings collapseoccurs at indication 7 whereas using the adaptive algorithm or a decrease inelement reach the system survives.23 451011X [pu]20.09 Zone 3 elements50.080.070.060.050.040.030.020.01098, 10, 11−0.010.02 0.04 0.06 0.08 0.1 0.12 0.14R [pu]76Fig. 5. The impedance as seen by a mho and quadrilateral relay located at bus3 protecting one of the transmission line between bus 3 and bus 34.In this simulation the injected reactive power at bus 3 <strong>to</strong>wardsbus 34 increases about 100 % during the first 83 seconds after143
the initial three phase fault. The other power flows in thesystem are approximately the same. When mho relays areused it is not the relay located at the bus with the lowest voltagelevel which operates first but the relays that meet the largestincrease in power flows. This shows that it is not only lowvoltage levels which are important <strong>to</strong> consider in order <strong>to</strong>avoid mal-trips due <strong>to</strong> voltage instability but also reactivepower flows which may increase considerably.The criterion used <strong>to</strong> choose between the conventional andthe proposed relay algorithm is based on the reactive power.Basically the criterion applies the conventional distance relayalgorithm when the protected line generates reactive power.When the line consumes reactive power the proposed algorithmis activated emphasizing security. This criterion is suitablein systems where the lines generally are operated belowthe surge impedance load. For example, in the Swedish transmissionsystem. However in systems where the lines normallyare loaded above the surge impedance load the algorithm inFig. 2 can be activated when the reactive power consumed bythe protected line exceeds a certain level.One reason why the reactive power and not the voltage isused <strong>to</strong> decide which algorithm should be used is that the voltagesometimes is a bad indica<strong>to</strong>r of the system conditions. Forexample, bus 3 is located close <strong>to</strong> genera<strong>to</strong>r buses. Consequentlyand as illustrated in Fig. 4, the voltage at bus 3 will beheld at a fairly high voltage level by the voltage control of thegenera<strong>to</strong>rs until very close <strong>to</strong> a collapse. Hence if the relaywould base its adaptivity on the voltage level, then the probabilityfor a <strong>to</strong>o late change of algorithms would be significant.In this case the lines between bus 3 and bus 34 are heavilyloaded, i.e they consume reactive power prior <strong>to</strong> the initialfault. As a consequence the relays located at bus 3 havealready adjusted their relay algorithm <strong>to</strong> the one proposed inFig. 2 before the three phase fault occurs. The lines betweenbus 34 and bus 4 generate reactive power before the initialthree phase fault and thus the relays located at bus 34 areapplying the conventional distance relay algorithm. Howeveras the faulted line is disconnected the remaining line betweenbus 34 and bus 4 start <strong>to</strong> consume reactive power and thus theassociated relay adjusts its relay algorithm.Since the derivative of the voltage due <strong>to</strong> the disturbance isthe same at bus 3 and bus 34 apart from the magnitude thefundamental method of operation will be the same at thesetwo buses. Hence only the derivative of the voltage as seen bythe relays located at bus 3 is investigated.In Fig. 6 we see that there is a considerable difference in themagnitude of the negative peaks of the derivative of the voltage(which fall in between indications 6 and 8) caused by tapchangeroperations and current limiter actions as comparedwith the peaks caused by the short circuit faults. As describedearlier, this is the phenomenon used by the algorithm <strong>to</strong> distinguishshort circuit faults from other events in the system..pu[] s∆V 3∆t3020100−10−206[pus ]7∆V 3∆t13020100−10−20−3025 5.2 5.4 5.6 5.8 6Time [s][pus ]∆V 3∆t3020100−10−203 4−30249.95 250 250.05 250.1 250.15Time [s]−300 50 100 150 200 250 300Time [s]Fig. 6. The derivative of the voltage at bus 3.8 11The negative and positive peaks of the voltage derivativewhich are generated when the initial fault occurs and iscleared (between indications 1 <strong>to</strong> 6), make that the proposedalgorithm achieves the same result as conventional remoteback-up distance relaying. When the initial three phase faul<strong>to</strong>ccurs the apparent impedance enters the zone 3; Fig. 5. Atthe same time the relays see a high peak of the derivative ofthe voltage with a negative sign. Hence the criteria in blocks 1and 2 are fulfilled and the timer in block 3 is started. The algorithmstarts <strong>to</strong> alternate between blocks 4 and 5 waiting for thefault <strong>to</strong> be cleared by the main protection. This happens 90 msafter the initial fault. Consequently the relays located at bus 3see a positive peak of the derivative of the voltage and theapparent impedance leaves the zone 3 of operation. Hence thealgorithm again starts <strong>to</strong> wait for the criterion in block 1 <strong>to</strong> befulfilled. The criterion in block 1 is once again fulfilled whenthe au<strong>to</strong>-reclosing is performed. As the au<strong>to</strong>-reclosing is notsuccessful the operating sequence described is repeated forthe algorithm.When the zone 3 elements are entered at 87.2 s due <strong>to</strong> thedecreasing voltages and increasing power flows, block 2 inFig. 2 will not treat this as a fault as no large negative peak ofthe derivative of the voltage is present. Thus when the apparentimpedance as seen by the relay further moves in<strong>to</strong> zone 3the algorithm will make the relay <strong>to</strong> continue <strong>to</strong> wait for a trueshort circuit fault as the algorithm will alternate betweenblocks 1,2 and 6. This will continue until the impedanceleaves zone 3, the line is thermally overloaded or a high negativepeak of the derivative of the voltage occurs.When the bus fault at indication 8 occurs the impedance as5910
seen by the relay will be located within zone 3 at the sametime as the relay will sense a high negative peak of the derivativeof the voltage. Hence the algorithm will start <strong>to</strong> alternatebetween blocks 4 and 5 waiting for a high positive peak <strong>to</strong>arise; i.e the fault <strong>to</strong> be cleared. This process may continueuntil the time delay of zone 3 expires and a trip signal will besent <strong>to</strong> the circuit breaker. However in this case the fault iscleared by the primary protection. Thus the algorithm will bereset and continue <strong>to</strong> alternate between blocks 1,2 and 6. Theline will not be tripped and the system starts <strong>to</strong> recover.Bus 3 is a typical bus where the algorithm may be expected<strong>to</strong> work inadequately. When the initial fault is cleared thealgorithm may meet a proportionally low positive peak of thederivative of the voltage since the relay is located quite farfrom the fault. At the same time the capacity of shunt capaci<strong>to</strong>rsclose <strong>to</strong> the bus is high. This may cause trouble when thevalues of the parameters in the algorithm are selected. In Fig.6 we see that the shunt switching between indication 3 and 4causes a positive peak which is about 50 % of the derivativeof the voltage caused by the final fault clearing. If the capaci<strong>to</strong>rswitching occurs during the time when the fault is presentthe algorithm may interpret this as a fault clearance. This se<strong>to</strong>f events has been simulated where the result shows that thepositive peak of the derivative of the voltage due <strong>to</strong> the shuntswitching in this case will only be about 15 % of the peakcaused by the fault clearance. This is due <strong>to</strong> the low voltage inthe system when the fault is present.Simulations have also shown that different fault resistanceshave little impact on the magnitude of the derivative of thevoltage.the short circuit fault when one or both of these actions aretaken. However if neither the algorithm is applied nor thereach of the zone 3 element is decreased Relay A will operateabout 8 minutes after the fault and initiate a <strong>to</strong>tal blackout inthe framed region.Line 1Line 2Relay A150 MVar reac<strong>to</strong>r100 MVar reac<strong>to</strong>rVI. SIMULATION IN THE NORDIC32 TEST SYSTEMThe Nordic32 system has been simulated in ARISTO [10].The initial disturbance for this case is a permanent three phaseshort circuit fault located in the middle of the transmissionline indicated as Line 2 in Fig. 7. Thirty seconds before thefault occurs the system is weakened as Line 1 is manuallytaken out of operation. Still the power flows from the North <strong>to</strong>the Central region are fairly normal and the voltage is close <strong>to</strong>the nominal 400 kV at all system buses. In Fig. 8 the faul<strong>to</strong>ccurs at 150 seconds and is immediately cleared by primaryprotection. The voltage level starts <strong>to</strong> decrease and the reactivepower demand starts <strong>to</strong> increase, especially in the framedarea. Au<strong>to</strong>matic shunt switching is performed <strong>to</strong> halt the voltagereduction and <strong>to</strong> res<strong>to</strong>re the voltage level. In case theadaptive algorithm is used or when the reach of the zone 3element is decreased this proceeding will succeed as Relay Awill not operate when zone 3 is entered due <strong>to</strong> the voltageinstability. In Fig. 7 the system is displayed in the stable operationmode which is reached approximately 9 minutes afterFig. 7. Final system condition after a permanent three phase fault on line 2when the adaptive algorithm is applied for Relay A. The voltage at each busis displayed.The impedance relay characteristic of the distance elementapplied is of the quadrilateral type operated in combinationwith no devices such as load blinders, start relays or generalstart criteria. All zone 3 elements in the system are set <strong>to</strong>cover all adjacent lines in reactive direction. In resistive directionthe sensitivity among the relays varies but Relay A is set<strong>to</strong> operate for fault resistances of 115.2 Ω or less.From Fig. 8 we see that the peaks of the derivative of thevoltage for the three phase fault and fault clearing is <strong>to</strong>tallydominating compared <strong>to</strong> the peaks caused by the au<strong>to</strong>maticshunt switching and the disconnection of Line 1. Notice thatthe peaks of the derivative with origin in the disconnection ofLine 1 and the reac<strong>to</strong>r switching are less then 2% of the magnitudeof the derivative for the fault and fault clearing.The input voltage used for the calculation of the derivativeof the voltage is in this simulation sampled with a lower fre-
quency then used for the 15 bus system. Therefore the peaksof the derivative in Fig. 8 are not as distinct as in Fig. 6.∆V pu ∆t [] s150100500−50−100−150Line 1disconnected∆V pu∆t [] s150 Faultclearing100500−50−100−150150 MVarreac<strong>to</strong>rdisconnected0 100 200 300 400 500 600 700Time [s]Fig. 8. The derivative of the voltage at the location of Relay A.VII. CONCLUSIONSSimulations in two different test systems have shown thatundesirable zone 3 distance relay operations during voltageinstability can be the difference between a <strong>to</strong>tal blackout and arecovering system. The reasons for these mal-trips are often acombination of decreasing system voltages and increasingreactive power flows.In order <strong>to</strong> avoid these unwanted relay operations an adaptivealgorithm which prevents mal-tripping due <strong>to</strong> voltageinstability has been proposed. The algorithm not only considersthe relation between the apparent impedance and the zoneof operation but also uses the derivative of the voltage <strong>to</strong> distinguishshort circuit faults from other events in the system.Although the algorithm prevents mal-trips due <strong>to</strong> loadencroachment associated with voltage instability the reach ofthe distance relay will not be restricted.VIII. ACKNOWLEDGEMENTSThe authors would like <strong>to</strong> thank Svenska Kraftnät for theirinterest in this research area and for their financial support.The authors also would like <strong>to</strong> thank ABB <strong>Power</strong> <strong>System</strong>s forproviding Simpow.IX. REFERENCESThree phasefault on Line 2150 150.2 150.4 150.6 150.8 151Time [s]100 MVarreac<strong>to</strong>rdisconnected[1] Western <strong>System</strong>s Coordinating Council DisturbanceReport For the <strong>Power</strong> <strong>System</strong> Outages that Occurredon the Western Interconnection on July 2, 1996, 1424MAST and July 3, 1996, 1403 MAST, Approved September19, 1996, Internet URL http://www.wscc.com/distnews.htm.[2] X. Vieira et al., ”The March 11:th 1999 Blackout:Short-Term Measures <strong>to</strong> Improve <strong>System</strong> Security andOverview of the Reports Prepared by the InternationalExperts”, CIGRÉ Session, SC 39 Workshop on LargeDisturbances, Paris, August 29, 2000.[3] ”The blackout in Sweden 27-12-1983”, Vattenfall publication,February 1984.[4] Horowitz S.H, Phadke A.G, Thorp J.S, ”AdaptiveTransmission <strong>System</strong> Relaying”, IEEE Transaction on<strong>Power</strong> Delivery, Vol. 3, No. 4, Oc<strong>to</strong>ber 1988, pp. 1436- 1445.[5] Vu K, Begovic M.M, Novosel D, Saha M.M, ”Use ofLocal Measurements <strong>to</strong> Estimate Voltage-StabilityMargin”, IEEE Transaction on <strong>Power</strong> <strong>System</strong>s, Vol.14, No. 3, August 1999, pp. 1029 - 1035.[6] Rockefeller G.D et al. ”Adaptive transmission relayingconcepts for improved performance”, IEEE Transactionon <strong>Power</strong> Delivery, Vol. 3, No. 4, Oc<strong>to</strong>ber 1988,pp. 1446 - 1457.[7] CIGRÉ TF 38-02-08, ”Long Term Dynamics PhaseII”, 1995.[8] le Dous G, Daalder J, Karlsson D, ”Dynamical LoadMeasurement in a 2000 MW <strong>System</strong> in order <strong>to</strong> Operate<strong>Power</strong> <strong>System</strong>s Closer <strong>to</strong> their Limits”, CIGRÈReport 39-107, Paris, August 1998.[9] Fankhauser H.R, Aneros K, A-A Edris. and Torseng S,”Advanced Simulation Techniques for the Analysis of<strong>Power</strong> <strong>System</strong> Dynamics”, IEEE Computer Applicationsin <strong>Power</strong>, Vol. 3, No. 4, Oc<strong>to</strong>ber 1990, pp. 31 -36.[10] Edström A, Walve K, ”A Highly Interactive Fast Simula<strong>to</strong>rCovering Transients Stability and Long TermDynamics in Large <strong>Power</strong> <strong>System</strong>s”, CIGRÉ Report38-204, Paris, august 28-September 3, 1994.X. BIOGRAPHIESMattias Jonsson received his M. Sc. from Chalmers University of Technologyin 1998. His interest lies in power system stability and power system protection.At present he works <strong>to</strong>wards a Ph.D. thesis.Jaap E. Daalder obtained his Ph.D in power engineering from the EindhovenUniversity of Technology, The Netherlands. He worked there as anAssociate Professor until 1984 when he left for Norway <strong>to</strong> become a Direc<strong>to</strong>rof Technology and Member of the Board of a subsidiary of the Brown BoveriCompany, nowadays ABB. In 1993 he was appointed as full Professor atChalmers University of Technology. Since 1997 he is heading the Departmen<strong>to</strong>f Electric <strong>Power</strong> Engineering. His areas of interest are power systems andenvironmental issues related <strong>to</strong> power engineering.
Paper BA new protection scheme <strong>to</strong> prevent mal-tripsdue <strong>to</strong> power swingsM. Jonsson, J. DaalderPresented atIEEE/PES Transmission and Distribution Conference and Exposition,Oc<strong>to</strong>ber 28 - November 2, 2001, Atlanta, USA.
A new protection scheme <strong>to</strong> prevent mal-trips due <strong>to</strong> power swingsMattias Jonssonmattias.jonsson@elteknik.chalmers.seJaap Daalderjaap.daalder@elteknik.chalmers.seAbstract: New distance protection algorithms based on mathematicallogic blocks are introduced in this paper. The algorithms preventmal-trips due <strong>to</strong> power oscillations using additional criteria in combinationwith traditional distance relaying. These additional criteria arebased on symmetrical components and the derivative of the phaseangle associated with the current as seen by the relay.A simulation is performed in a eighteen bus system developed bythe authors where the performance of the algorithms is analysed.No timer settings as is necessary for conventional <strong>Power</strong> SwingDetec<strong>to</strong>rs are needed. Thus different cycle times of the power oscillationswill not affect the performance of the algorithms. Neither anarea in the RX-diagram has <strong>to</strong> be pre-defined which may causeextraordinary difficulties for applications serving long distance transmissionlines.Keywords: Distance protection, Transient stability, <strong>Power</strong> swings,Numerical relays, <strong>Power</strong> Swing Detec<strong>to</strong>r.I. INTRODUCTIONTransient instability in power systems generate power oscillations.These oscillations may cause unwanted tripping of distancerelays. To prevent these mal-trips the distance relay isoften combined with a <strong>Power</strong> Swing Detec<strong>to</strong>r (PSD). ConventionalPSD’s usually measure the time it takes for the apparentimpedance <strong>to</strong> travel through a pre-defined impedance area inthe RX-diagram which is located outside the area of the zonesof operation. Due <strong>to</strong> the varying cycle times of the poweroscillations a satisfac<strong>to</strong>ry setting of the timer associated withthe PSD may be difficult <strong>to</strong> obtain. In an yet unpublishedCIGRÉ WG34.09 investigation several cases of incorrectPSD behaviour due <strong>to</strong> this phenomenon are reported. For longtransmission lines difficulties may occur when the location ofthe pre-defined PSD impedance area is chosen. As the operationpoint at peak load may be close <strong>to</strong> the boundary of thefault detec<strong>to</strong>r zone there may not be enough place for theimpedance area of the PSD [1]. Hence a PSD which is notsensitive <strong>to</strong> the cycle time of power swings or the line lengthwould be desirable. In particular the limitations of the PSDassociated with the line length are undesirable as power oscillationsmainly occur on tie-lines and long transmission lines.From a technical point of view correct operating relaysDepartment of Electric <strong>Power</strong> EngineeringChalmers University of TechnologyGothenburg, S-41296 Sweden,www.elteknik.chalmers.sehave obviously been an important issue throughout the years.However the issue grow even more important in a deregulatedmarket. An incorrect outage of a transmission line may lead <strong>to</strong>advantages for competi<strong>to</strong>rs, penalty fees and an (unnecessary)absence of income. Unreliable relays may lead <strong>to</strong> situationswhere grid owners give their protection equipment narrowsettings <strong>to</strong> avoid unwanted relay operations due <strong>to</strong> powerswings. In some cases the settings may be <strong>to</strong>o narrow and therelays will not operate for all possible fault conditions. In abroader perspective this behaviour may be a threat <strong>to</strong> systemsecurity.Many relay solutions applied <strong>to</strong>day have their origin informer technical hardware limitations and thus the possibilitiesgiven by new numerical and communication technologiesare not always utilized <strong>to</strong> their maximum capacity. An exampleis the PSD based on the transition time through a blockingimpedance area. As already mentioned the solution have no<strong>to</strong>perated as desired several times throughout the years. Neverthelessit is still the main method used in numerical distancerelays <strong>to</strong> prevent mal-trips due <strong>to</strong> power oscillations. Asnumerical and signal processing technologies develop, newelectrical quantities may become attractive as relay inputs.For example, as the sampling frequency increases the derivativeof electrical quantities may become a widely used relaycriterion. Additionally the fast development of informationtechnology in power system applications may lead <strong>to</strong> thelaunch of economically and reliable protection strategiesbased <strong>to</strong> a great extent on communication devices.In modern numerical relays a computer software is used <strong>to</strong>create the operation scheme of the relay based on mathematicallogic blocks. Hence unique solutions suitable for each usercan easily be obtained. The PSD suggested here is based onthis new user friendly relay approach and is incorporated inthe relay algorithm. The algorithm is based on traditional distancerelaying in combination with additional criteria. To initiaterelay operation not only the apparent impedance has <strong>to</strong> bewithin the zone of operation during a pre-defined time but atleast one additional criterion has also <strong>to</strong> be fulfilled.
II. ADDITIONAL CRITERIA FOR A DISTANCE RELAYALGORITHMThe criteria which may be combined with the conventionaldistance relay methods vary for different types of distance elements.For phase <strong>to</strong> ground elements the residual current maybe used. During unsymmetrical phase <strong>to</strong> phase faults a negative-sequencecurrent will arise in the system and may thereforebe a suitable criterion. However phase <strong>to</strong> phase elementsmust also be able <strong>to</strong> distinguish symmetrical three phasefaults. A criterion associated with a negative- or zerosequencecurrent will not achieve this demand and thereforeanother method is introduced below.The fundamental behaviour of the phase angles of the voltageand current at the sending end of a transmission lineimmediately before and after a three phase short circuit faultis briefly studied using the small power system in figure 1.During normal operation the voltage V and current I are givenas in (1) and (2).Immediately before and after the fault the phase angle ofthe internal genera<strong>to</strong>r voltage may considered <strong>to</strong> be the same.Accordingly (1) and (3) show that the phase angle associatedwith the voltage V will not change significantly. When thefault occurs the system impedance as seen at P instantaneouslychanges from a primarily resistive <strong>to</strong> a primarily reactiveimpedance. Hence the phase angle associated with thecurrent will make a substantial change as can be seen from (2)and (4).Observe, that these assumptions are not always applicable.The fault impedance will never be zero for a real short circuitfault although the approximation is often applied in EHVstudies. Additionally the assumptions made in (1) and (2) arenot true for all line configurations and load conditions.Reactance [Ω]Line impedanceApparent impedanceafter the faultZsPIFR faultEGenera<strong>to</strong>rVZf = R f + jX fZload=R load +jX loadϕApparent impedancebefore the faultResistance [Ω]VIFig. 1. A small transmission system during normal operation.Z f+ Z load= ----------------------------------- ⋅ E ≈ EZ s + Z f + Z loadV V= ----------------------- ≈ ------------+Z fZ loadR load⎧∀⎨⎩⎧∀⎨⎩R loadZ loadZ load» Z f» Z s ⎭ ⎬⎫» X loadR load» X f» R f ⎭ ⎬⎫When a three phase fault occurs at node F the voltage andcurrent can be written as in (3) and (4). The voltage at thefault location is assumed <strong>to</strong> be zero when the fault is present.VIZ sZ f= --------------- ⋅ E ∼ E+Z f⎧∀⎨⎩V V= ---- ≈ ------ ∀{ XjX f» R f}fZ fX fX s» R f» R s ⎭ ⎬⎫(1)(2)(3)(4)Fig. 2. Possible behaviour of the characteristic angle ϕ of the apparent impedanceas seen by a distance relay during a three phase short circuit fault.In case of some specific relations between the pre-fault operatingpoint, the fault location and the fault impedance thecharacteristic angle ϕ of the apparent impedance as seen by adistance relay may not change during a fault; see figure 2.Hence the phase angle associated with the current will neitherchange. However as the fault impedance is usually formed bya resistance of a few ohms this behaviour will mainly occurfor fault locations close <strong>to</strong> the relay. Fortunately the closer thefault occurs <strong>to</strong> the line terminal the greater fault current willbe arising from nearby genera<strong>to</strong>rs. Hence the fault impedancewill also for this application be negligible in many cases andthus the phase angle associated with the current will changesubstantially for nearby faults as well.For relays located at the receiving end of a transmissionline the current usually will switch direction when the faul<strong>to</strong>ccurs and thus the phase angle will change approximately180 degrees.<strong>Power</strong> swings are phase symmetrical events with fairlylong cycle times. Accordingly the derivative of the phaseangle of the current can be used as an additional criterion in a
distance relay algorithm <strong>to</strong> distinguish symmetrical threephase faults from power swings. However, as shown in figure2 the criterion performs better the greater the fault distance.Hence the criterion is particularly suitable for zones 2 and 3distance protection. To cope with nearby faults in zone 1,when the fault impedance is not negligible, the criterion maybe used in combination with pilot relaying. Alternatively thecriterion is only applied for the time delayed zones as powerswings are rarely a major concern for zone 1 elements. In factif power swings are so severe that the zone 1 is entered it maybe advisable <strong>to</strong> trip the circuit breaker and thus split the system.When a three phase fault occurs in case of an open line situationor a pure reactive load, the phase angle of the current willnot change significantly. However for these operating conditionspower oscillations are not a major concern. Therefore theconventional distance relay method can be applied <strong>to</strong> thesecases whereas a method based on the derivative of the phaseangle of the current is used for operating conditions associated<strong>to</strong> power oscillations. The appropriate choice of the correctmethod can easily be determined by adaptive relaying.III. A MOMENTARY DISTANCE RELAY ALGORITHMIn figure 3 an algorithm for a zone 1 phase <strong>to</strong> phase relay isproposed. To initiate a trip signal not only the apparent impedancehas <strong>to</strong> be within the zone 1 of operation of the traditionaldistance element, but at least one of two additional criteriahave <strong>to</strong> be fulfilled.The quantities marked with the subscript set are assigned afixed value by the relay opera<strong>to</strong>r. The remaining quantities arecontinuously updated by the relay during operation.swing is the reason for the YES signal out from block 1. Verificationis carried out by comparing the fixed values of thequantities with the values continuously updated. When theupdated value in a block exceeds the fixed value the tripsignal is initiated. By studying the negative-sequence currentblock 2 examines if an unsymmetrical fault is the reason forthe activation of block 1. If not, a final check is made in block3 <strong>to</strong> validate if a symmetrical three phase fault has occurredusing the criterion based on the derivative of the phase angleof the current.In the case of a phase <strong>to</strong> ground element the criterion inblock 2 is replaced by one based on the residual current andblock 3 may be eliminated.IV. TIME DELAYED DISTANCE RELAY ALGORITHMSFOR SINGLE AND PARALLEL LINESFor the introduction of the time delayed algorithms zone 3 isstudied where the traditional zone 3 blocks are considered <strong>to</strong>cover the whole length of all adjacent sections. However theoperation characteristics are similar for the zone 2 algorithms,except for the reach of the traditional distance elements andthe timer settings.First consider a case where the circuit between relay C andrelay D in figure 4 is removed. Thus a system consisting oftwo subsequent single transmission lines is studied where thealgorithm in figure 5 is applied on relay A.E1ACIAP 2IDBDIEE2EFWithinzone 1I -≥12YESI -,SetYESNONOSend a tripsignal <strong>to</strong>the circuit breaker∂φ i≥∂φ i∂t ∂tSetFig. 3. Zone 1 algorithm for a phase <strong>to</strong> phase distance relay.Block 1 consists of the traditional zone 1 distance protectionfunction. When block 1 signals a fault blocks 2 and 3 areapplied <strong>to</strong> verify that a short circuit fault and not a power3NOYESFig. 4. A system including remote back-up protection.When a phase <strong>to</strong> phase fault occurs at P 1 the traditionaldistance element of both the main protection at E and theremote back-up protection at A will be entered. Additionallythe relays will experience at least one of the following events:a high peak of the derivative of the current or a negativesequencecurrent. Hence the timer in block 4 will be startedand the algorithm will begin <strong>to</strong> alternate between blocks 5 and6, waiting for the main protection E <strong>to</strong> clear the fault. Howeverif the main protection fails the algorithm will send a tripsignal when the criterion in block 6 is fulfilled.In case the fault is cleared by the main protection theapparent impedance will leave zone 3 for relay A. Assumethat a power swing occurs as a consequence of the grid weakeningand the apparent impedance again enters zone 3. ThisP 1
time no high peak of the derivative associated with the curren<strong>to</strong>r negative-sequence current will arise and accordingly theout signal from blocks 2 and 3 will be NO. Thus the timer inblock 4 is not started and the algorithm will continue <strong>to</strong> waitfor a true short circuit fault.necessary requirements, also the area of communication willbe restricted <strong>to</strong> the substation.Withinzone 3NO1Withinzone 3NOYESNO1YESNOI -≥2I -,SetNO∂φ i≥∂φ i∂t ∂tSetNOfault signalrelay C4I -≥I -,SetNO∂φ i ∂φ≥ i∂t ∂tSetYES3YES2YESt start =t3YESYESt start =t54NOWithinzone 35YESNOWithinzone 36YESNOt-t start ≥t 3,Set6NOt-t start ≥t 3,delay7YESYESSend a tripsignal <strong>to</strong>the circuit breakerSend a tripsignal <strong>to</strong>the circuit breakerFig. 5. Zone 3 algorithm for a phase <strong>to</strong> phase distance relay protecting twosubsequent single lines.In the case of parallel lines the algorithm in figure 5 needssome modification in order <strong>to</strong> operate properly. The mainreason for this is that the derivative of the phase angle of thecurrent as seen by relay A is strongly dependent on the locationof the fault P 2 .Simulations were performed for the grid configuration offigure 4, varying the fault location along the line between therelays C and D. It appeared that for a fault close <strong>to</strong> relay C therelay A experienced a positive derivative of the phase angle,whereas the derivative was negative in case of a fault close <strong>to</strong>relay D. A mathematical analysis confirmed that both thevalue and the sign of the derivative of the phase angle of thecurrent as seen by relay A varies along the line. This meansthat for a particular fault location no change in the phase angleof the current will be observed. To overcome this problem anextra logic block is added <strong>to</strong> the algorithm of figure 5.The suggested algorithm in figure 6 relies <strong>to</strong> a certaindegree on communication devices. However conventional”tripping” or ”blocking” communication techniques fulfil allFig. 6. Zone 3 algorithm for a phase <strong>to</strong> phase distance relay serving parallellines.For faults located on the line between relay E and relay Fthe operation principle is identical for the algorithm in figure6 as for the algorithm in figure 5. However as discussed abovea high peak of the derivative associated with the current willnecessarily not be present when a fault occurs on the linebetween relay C and relay D. Therefore a signal used as aninput in block 4 goes active when the timer in the zone 2 algorithmat relay C is started. Additionally for cases where thefault impedance for nearby faults can not be neglected thesignal may also be activated when the zone 1 protection atrelay C sees a fault. Hence a symmetrical three phase fault onthe line between relay C and relay D where no high peak ofthe derivative is observed by relay A, will instead be distinguishedin block 4.When directional forward reaching distance elements areused the fault P 2 is not always instantaneously seen by relay Aas the apparent impedance is dependent on the location of P 2and the system configuration around the faulted line. In caseswhen the fault current is injected at relay A this phenomenon
will not arise. However if the initial fault current is extractedat relay A its traditional zone 3 element may not be entereduntil relay C has operated. As the current switches directionand consequently the phase angle shifts approximately 180degrees both the traditional zone 3 will be entered and a highpeak of the derivative of the phase angle associated with thecurrent will occur. Thus the algorithm in figure 6 will copewith this phenomenon.V. SIMULATIONSimulations have been performed using SIMPOW and the testsystem used is based on the grid introduced in [2]. To this grida small system consisting of a large hydro genera<strong>to</strong>r and asmall load is connected via two transmission lines. The algorithmsintroduced above are implemented in Relays A and Cwhere the traditional zone 3 elements are of the offset mhotype, set <strong>to</strong> cover 185% of the line length.Line 2; see figure 9. Hence the output signal from blocks 1and 3 will be YES and a trip signal will be sent <strong>to</strong> the circuitbreaker. The fault is cleared in 90 ms which is the <strong>to</strong>tal operationtime for the relay and the circuit breaker.ACTIVE POWER [pu]2220181614121086420 5 10 15 20 25 30 35 40 45 50TIME [s]Fig. 8. Active power injected at Relay A.1x3000 MVA~Bus 1Relay ARelay CFSMALLSYSTEMLine 1250 kmLine 22x500 MVA 2x500 MVA1x400 MVA 1x400 MVA~ ~Relay DLARGESYSTEM350 Ω180 Ω500 Ω250 km250 km450 km180 Ω∂φ i rad--------∂t s0.5 x 104 TIME [s]0−0.5−1−1.5−2−2.5−3−3.5Fig. 7. Test system.Initially about 1800 MW is transported from the smallsystem <strong>to</strong>wards the large system. Five seconds after the simulationis started a symmetrical three phase fault with zero faultresistance is applied on Line 2, 50 km from Bus 1. The faultedline is disconnected by the main protection. Figure 8 showsthe damped power oscillations occurring after the disconnectionwhere the system eventually will return <strong>to</strong> a stable operatingstate. However if traditional distance relays without PSD’sare used Line 1 will incorrectly be tripped by Relay A as theapparent impedance will stay within zone 3 for more than 1.2seconds during the first swing after the fault clearance; seefigure 10. Consequently the whole system will collapseapproximately five seconds after the fault has occurred.First we examine the operation of Relay C by studying thealgorithm shown in figure 3. Immediately after the fault hasoccurred the apparent impedance will enter the traditionalzone 1 element. At the same time the relay will see a highpeak of the derivative associated with the current injected in<strong>to</strong>−4−4.5−54.95 5 5.05 5.1Fig. 9. The derivative of the phase angle associated with the current injectedin<strong>to</strong> Line 2 at Relay C.In figure 10 the apparent impedance as seen by Relay A isdisplayed. During the short circuit fault the traditional zone 3mho element will not be entered. However some time after thedisconnection of Line 2, zone 3 will be entered by the firstpower swing. Hence the output from Block 1 in figure 6 willbe YES. The power swing is a phase symmetrical event, nohigh peak of the derivative associated with the currentinjected in<strong>to</strong> Line 1 is present at 5.26 s in figure 11 and nofault signal is received from Relay C. Therefore the outputsignals from blocks 2,3 and 4 will be NO. Thus the algorithmwill not start the timer and no trip signal will be sent <strong>to</strong> the circuitbreaker. Line 1 will not be tripped and thus the systemrecovers <strong>to</strong> a stable state.
REACTANCE [pu]0.030.020.010−0.01−0.02−0.03Zone 3t in =5.26t out =6.49t=+5.09t=-5t=-5.09t=+50.02 0.04 0.06 0.08 0.1 0.12RESISTANCE [pu]Fig. 10. RX- diagram for traditional zone 3 element at Relay A.have difficulties <strong>to</strong> distinguish a power swing caused by loadshedding or genera<strong>to</strong>r tripping from a long distance fault. Thereasons why these events affect the phase angle of the currentare as follows: during load shedding or genera<strong>to</strong>r tripping thephase angle of the current will not be so much affected by theactual load or generation tripped as about the same relativeamount of active and reactive power is removed. However as anew load condition may occur the phase angle of the current asseen by the relay may be altered due <strong>to</strong> the change in reactivepower generated or consumed by the transmission line and/oradjacent shunt devices.Events such as shunt and transformer switching may alsoaffect the phase angle of the current. However such changes areusually less then in case of a short circuit fault and will mostlikely not occur in combination with an entrance of zone 3 due<strong>to</strong> a power swing.∂φ i rad--------∂t s21.512.5 x 104 10.50−0.5−1−1.5−2−2.54.9 5 5.1 5.2 5.3 5.40.5TIME [s]0−0.5−1−1.5−2∂φ i rad--------∂t s21.5x 10 4−2.50 5 10 15 20 25 30 35 40 45 50TIME [s]Fig. 11. The derivative of the phase angle associated with the current injectedin<strong>to</strong> Line 1 at Relay A.VI. DISCUSSIONA question which may arise is: why not only use the criterionbased on the derivative of the phase angle of the current in thealgorithms? Simulations have shown that the peak of the derivativeassociated with the phase angle of the current is considerablylarger for a three phase fault as compared <strong>to</strong> faultsinvolving two phases or one phase <strong>to</strong> ground. In order <strong>to</strong> obtaina high security the settings in the blocks associated with the criterionare made with respect <strong>to</strong> three phase faults. Apart fromshort circuit faults, there exist a few additional power systemevents associated with power oscillations that may have someinfluence on the phase angle of the current. For example if thesettings are done with respect <strong>to</strong> other faults involving less thanthree phases there might be a few cases where the algorithmsVII. CONCLUSIONSNew distance protection algorithms which prevent mal-tripsdue <strong>to</strong> power oscillations have been proposed. Both momentaryand time delayed algorithms are introduced where the dependabilityis decreased and security is increased with respect <strong>to</strong> traditionaldistance relaying. This is achieved by requiringadditional criteria <strong>to</strong> be fulfilled at the same time as the apparentimpedance enters the traditional distance element <strong>to</strong> initiatea relay operation. These additional criteria are based on symmetricalcomponents and the derivative of the phase angle associatedwith the current.The line length or the cycle time of the power swing will notaffect the performance and availability of the algorithms as maybe the case with conventional <strong>Power</strong> Swing Detec<strong>to</strong>rs.Applications for single and parallel lines have been presented.The solution for parallel line require some internal communicationbetween the relays at the terminal.The algorithms are based on mathematical logics blocks.Thus numerical relays applying a user friendly computer software<strong>to</strong> create the operation scheme of the relay make it easyfor relay engineers <strong>to</strong> develop the algorithms.VIII. ACKNOWLEDGEMENTSThe authors would like <strong>to</strong> thank Svenska Kraftnät for theirinterest in this research area and for their financial support. Theauthors also would like <strong>to</strong> thank ABB <strong>Power</strong> <strong>System</strong>s for providingSimpow.IX. REFERENCES[1] Machowski J, Nelles D, ”New <strong>Power</strong> Swing Blocking Method”, IEE Developmentsin <strong>Power</strong> <strong>System</strong> <strong>Protection</strong>, Conference Publication No. 434, March25-27 1997, pp 218 - 221.[2] Jonsson M, Daalder J, ”Distance <strong>Protection</strong> and Voltage Stability”, <strong>Power</strong>Con2000, December 4-7, 2000, Perth, Australia. Proceeding Vol. 2, pp. 971-976.
Paper CA distance protection scheme <strong>to</strong> prevent maltripsduring abnormal power systemconditionsM. Jonsson, J. DaalderPresented atCigré Study Committee 34 Colloquium and Meeting,September 10 - 14, 2001, Sibiu, Romania.
A distance protection scheme <strong>to</strong> prevent mal-trips during abnormal power systemconditionsMattias Jonssonmattias.jonsson@elteknik.chalmers.seJaap Daalderjaap.daalder@elteknik.chalmers.seDepartment of Electric <strong>Power</strong> EngineeringChalmers University of TechnologyGothenburg, S-41296 Swedenwww.elteknik.chalmers.seAbstract: A new distance protection scheme is proposed <strong>to</strong> avoidmal-trips due <strong>to</strong> voltage instability and power oscillations. Thescheme is based on mathematical logic blocks and uses traditionaldistance relaying in combination with certain additional criteria.These additional criteria are based on symmetrical components, thederivative of the phase angle of the current and the derivative of thevoltage.The performance of the scheme is analysed by simulations in aeighteen bus system developed by the authors.The performance and availability of the scheme is not affected bythe line length, different cycle times of the power oscillations and/orfaults with a slowly decreasing impedance, which may be the casewith conventional <strong>Power</strong> Swing Detec<strong>to</strong>rs. Although the scheme preventmal-trips due <strong>to</strong> load encroachment associated with voltageinstability the reach of the distance relay will not be restricted.Keywords: Distance protection, <strong>Power</strong> oscillations, Voltage stability,Transient stability, Zone 3 element, Numerical relays.I. INTRODUCTIONUndesirable distance relay operation during abnormal powersystem conditions have contributed <strong>to</strong> blackouts worldwide[1,2,3]. If such mal-operations had been avoided these blackoutscould have been mitigated and in a few cases most likelycompletely avoided.Throughout the years much effort has been used <strong>to</strong> designrelays which function properly and have a high level of security.Nowadays when power systems are deregulated an incorrec<strong>to</strong>utage of a transmission line may lead <strong>to</strong> advantages forcompeti<strong>to</strong>rs, penalty fees and an (unnecessary) absence ofincome. Unreliable relays may lead <strong>to</strong> situations where gridowners choose narrow settings for their protection equipment<strong>to</strong> avoid unwanted relay operations due <strong>to</strong> abnormal powersystem conditions. In some cases the settings may be such thatrelays will not operate for all possible fault conditions. In abroader perspective this behaviour may be a threat <strong>to</strong> systemsecurity.Important events which may be initiated or aggravated bymal-operating distance relays are voltage instability andpower oscillations. Typical of these abnormal operating conditionsis that until the very ultimate phase of collapse theelectrical quantities in the system will change moderately andrather slow as compared <strong>to</strong> a short circuit fault. Another featureis that voltage instability and power oscillations are phasesymmetrical events.In [4] and [5] new distance relay operation schemes havebeen proposed based on these characteristic features. Theschemes use traditional distance relaying in combination withadditional criteria. These criteria are used <strong>to</strong> distinguishencroachments of the fault detec<strong>to</strong>r zone caused by voltageinstability and power oscillations from encroachment causedby short circuit faults.Many relay solutions applied <strong>to</strong>day have their origin informer technical hardware limitations and thus the possibilitiesgiven by new numerical and communication technologiesare not always utilized <strong>to</strong> their maximum capacity. An exampleis the <strong>Power</strong> Swing Detec<strong>to</strong>r (PSD) based on the transitiontime through a blocking impedance area. Often it may be difficult<strong>to</strong> give the PSD proper settings because of long linelengths, the varying cycle time of the power oscillations andslowly decreasing fault impedances. Consequently this solutionhas caused several mal-trips throughout the years [5].Nevertheless it is still the main method used in numerical distancerelays <strong>to</strong> prevent mal-trips due <strong>to</strong> power oscillations. Asnumerical and signal processing technologies develop, newelectrical quantities may become relevant as relay inputs. Forexample, as the sampling frequency increases the derivativeof electrical quantities may become an attractive relay criterion.In modern numerical relays a computer software is used <strong>to</strong>create the operation scheme of the relay based on mathematicallogic blocks. Additionally the relay opera<strong>to</strong>r can choosebetween a wide range of relay inputs. Accordingly uniqueprotection schemes suitable for each user can be obtained.The distance protection scheme proposed here utilizes thepossibilities given by this new user friendly relay approachand is a further development of the algorithms introduced in[4] and [5].
II. NEW CRITERIA FOR A DISTANCE RELAY SCHEMEThe criteria which may be combined with conventional distancerelay methods vary for different types of distance elements.For phase <strong>to</strong> ground elements the residual current maybe used. During unsymmetrical phase <strong>to</strong> phase faults a negative-sequencecurrent will arise in the system and may thereforebe a suitable criterion. However phase <strong>to</strong> phase elementsmust also be able <strong>to</strong> distinguish symmetrical three phasefaults. A criterion associated with a negative- or zerosequencecurrent will not achieve this demand and thereforeanother method is introduced below.The fundamental behaviour of the phase angles of the voltageand current [6] at the sending end of a transmission lineimmediately before and after a three phase short circuit faultis here briefly studied using the small power system in figure1. During normal operation the voltage V and current I aregiven as in (1) and (2).Z sPIFoccurs the system impedance as seen at P changes instantaneouslyfrom a primarily resistive <strong>to</strong> a primarily reactive impedance.Hence the phase angle associated with the current willmake a substantial change as can be seen from (2) and (4).Observe, that these assumptions are not always applicable.The fault impedance will never be zero for a real short circuitfault although the approximation is often applied in EHV studies.Additionally the assumptions made in (1) and (2) are nottrue for all line configurations and load conditions.Reactance [Ω]ϕR faultLine impedanceApparent impedanceafter the faultApparent impedancebefore the faultResistance [Ω]EGenera<strong>to</strong>rVZ f = R f + jX fZ load =R load +jX loadFig. 2. Possible behaviour of the characteristic angle ϕ of the apparent impedanceas seen by a distance relay during a three phase short circuit fault.VIFig. 1. A small transmission system during normal operation.Z f+ Z load= ----------------------------------- ⋅ E ≈ EZ s + Z f + Z loadV V= ----------------------- ≈ ------------+Z fZ loadR load⎧∀⎨⎩⎧∀⎨⎩R loadZ loadZ load» Z f» Z s ⎭ ⎬⎫» X loadR load» X f» R f ⎭ ⎬⎫When a three phase fault occurs at node F the voltage andcurrent can be written as in (3) and (4). The voltage at thefault location is assumed <strong>to</strong> be zero when the fault is present.VIZ sZ f= --------------- ⋅ E ∼ E+Z f⎧∀⎨⎩V V= ---- ≈ ------ ∀{ XjX f» R f}fZ fX fX s» R f» R s ⎭ ⎬⎫Immediately before and after the fault the phase angle of theinternal genera<strong>to</strong>r voltage may considered <strong>to</strong> be the same.Accordingly (1) and (3) show that the phase angle associatedwith the voltage V will not change significantly. When the fault(1)(2)(3)(4)In case of some specific relations between the pre-fault operatingpoint, the fault location and the fault impedance the characteristicangle ϕ of the apparent impedance as seen by adistance relay may not change during a fault; see figure 2.Hence the phase angle associated with the current will neitherchange. However as the fault impedance usually is formed by aresistance of a few ohms this behaviour will mainly occur forfault locations close <strong>to</strong> the relay. Fortunately the closer the faul<strong>to</strong>ccurs <strong>to</strong> the line terminal the greater fault current will be arisingfrom nearby genera<strong>to</strong>rs. As a result the fault impedance willalso in this case be negligible in many instances [7] and thus thephase angle associated with the current will change substantiallyfor nearby faults as well.For relays located at the receiving end of a transmission linethe current usually will switch direction when the fault occursand thus the phase angle will change approximately 180degrees.<strong>Power</strong> oscillations and voltage instability are phase symmetricalevents with fairly long time constants. Accordingly thederivative of the phase angle of the current can be used as anadditional criterion in a distance relay algorithm <strong>to</strong> distinguishsymmetrical three phase faults from these abnormal operationconditions. However, as shown in figure 2 the criterion performsbetter for increasing fault distances. This means that thecriterion is particularly suitable for zones 2 and 3 distance protection.To cope with nearby faults in zone 1 when the faultimpedance is not negligible, the criterion may be used in com-
ination with pilot relaying. Alternatively the criterion may beapplied for the time delayed zones only as power swings andvoltage instability are rarely a major concern for zone 1 elements.In fact if power swings are so severe that the zone 1 isentered it may be advisable <strong>to</strong> trip the circuit breaker and thussplit up the system.When a three phase fault occurs in case of an open line situationor a pure reactive load, the phase angle of the current willnot change significantly. However for these operating conditionspower oscillations or voltage instability are not a majorconcern. Therefore the conventional distance relay method canbe applied <strong>to</strong> these cases whereas a method based on the derivativeof the phase angle of the current is used for operating conditionsassociated <strong>to</strong> power oscillations and voltage instability.The appropriate choice of the correct method can easily bedetermined by adaptive relaying.Apart from short circuit faults there are other events whichmay lead <strong>to</strong> sudden changes of the phase angle of the current[5]. Examples of events which may be associated <strong>to</strong> voltageinstability and power oscillations are load shedding and genera<strong>to</strong>rtripping. Usually the peak value of the derivative of thephase angle of the current caused by genera<strong>to</strong>r tripping and loadshedding are not as large as for three phase faults. However inorder <strong>to</strong> obtain a high relay security and <strong>to</strong> assure that the relaywill not mal-operate due <strong>to</strong> such events some additional criteriamay be used as a supplement <strong>to</strong> the derivative of the phaseangle of the current. For example, <strong>to</strong> distinguish load sheddingfrom three phase short circuit faults the derivative of the voltageis a good indica<strong>to</strong>r. Whereas a three phase short circuit faultwill decrease the voltage the opposite is true in case of loadshedding. To avoid any mal-operation due <strong>to</strong> genera<strong>to</strong>r trippingsome communication device may be used <strong>to</strong> inform the relaythat genera<strong>to</strong>r tripping has been performed. Hence when theoperation scheme of the relay is programmed the signalreceived from the genera<strong>to</strong>r may be used <strong>to</strong> block undesirablerelay operation. For example; for the scheme in figure 3 whichis introduced in the next section the output from block 3 can beset <strong>to</strong> NO for a short time when the relay receives the signalannouncing genera<strong>to</strong>r tripping.Our intention is <strong>to</strong> introduce a new method <strong>to</strong> distinguishsymmetrical three phase faults from abnormal operation conditionsand explain its fundamental behaviour. Therefore we willassume zero or negligible fault impedance from now on.III. A ZONE 3 DISTANCE PROTECTION SCHEMEIn figure 3 a scheme for a zone 3 phase <strong>to</strong> phase relay is proposed.To initiate a trip signal not only the apparent impedancehas <strong>to</strong> be within the zone 3 of the traditional distance element,but at least one of three additional criteria has <strong>to</strong> be fulfilled.The quantities marked with the subscript Set are assigned afixed value by the relay opera<strong>to</strong>r. The remaining quantities arecontinuously updated by the relay during operation.Block 1 consists of the conventional zone 3 distance protectionfunction. When block 1 signals a fault blocks 2, 3 and 4 areapplied <strong>to</strong> verify that a short circuit fault and not power oscillationsor voltage instability is the reason for the YES signal outfrom block 1. Verification is carried out by comparing the fixedvalues of the quantities with the values continuously updated.By studying the negative-sequence current block 2 examinesif an unsymmetrical fault is the reason for the activation ofblock 1. If not, final checks are made in blocks 3 and 4 <strong>to</strong> validateif a symmetrical three phase fault has occurred using thecriteria based on the derivative of the phase angle of the currentand the derivative of the voltage. When the real time value inblock 2 exceeds the fixed value or the real time value in block 3exceeds the fixed value at the same time as the real time valuein block 4 falls below the fixed value the timer in block 5 isstarted.Withinzone 31I - ≥ I -,Set2YESYESNONONONOt start =tWithinzone 3t-t start ≥t 3,Set∂φ i ∂φ≥ i∂t ∂tSetFig. 3. Zone 3 scheme for a phase <strong>to</strong> phase distance element.567YESYESSend a tripsignal <strong>to</strong>the circuit breaker34NOYES∂V ∂V≤∂t ∂t SetYESNO
When a phase <strong>to</strong> phase fault occurs in the protected areathe traditional distance element will be entered. Additionallythe relay will experience at least one of the following events:a negative-sequence current or a high peak of the derivative ofthe current combined with a substantial voltage reduction.Hence the timer in block 5 will be started and the scheme willbegin <strong>to</strong> alternate between blocks 6 and 7, waiting for themain protection <strong>to</strong> clear the fault. However if the main protectionfails the scheme will send a trip signal when the criterionin block 7 is fulfilled.In case the fault is cleared by the main protection theapparent impedance will leave zone 3. Assume that a powerswing occurs as a consequence of the grid weakening and theapparent impedance again enters zone 3. This time no highpeak of the derivative associated with the current or negativesequencecurrent will arise and accordingly the out signalfrom blocks 2 and 3 will be NO. Thus the timer in block 5 isnot started and the scheme will continue <strong>to</strong> wait for a trueshort circuit fault.When zone 3 is entered by a slowly decreasing apparentimpedance due <strong>to</strong> voltage instability the criterion in block 1will be fulfilled. However the criteria in blocks 2 and 3 willnot be fulfilled as there is no negative sequence currentpresent in the system. Neither will the derivative of the phaseangle associated with the current possess a value whichexceeds the pre-set value in block 3. The apparent impedancestays within zone 3 as the scheme continues <strong>to</strong> wait for a trueshort circuit fault. If the voltage instability aggravates loadshedding might be performed as a remedial action. Supposethat the load shedding generates an unexpected high absolutepeak value of the derivative of the phase angle of the currentso that the criterion in block 3 is fulfilled. Consequently theout signal from block 3 is YES. However block 4 will preventan incorrect start of the timer in block 5 as the peak value ofthe derivative caused by the load shedding will have a positivesign and thus the criterion in block 5 is not fulfilled. As aresult also for this sequence of events the relay scheme willmaintain a high security.Conventional <strong>Power</strong> Swing Detec<strong>to</strong>rs usually interpret afault with a slowly decreasing impedance as a power oscillationand thus the fault is not cleared. The scheme proposed infigure 3 will only clear all unsymmetrical faults of this type.However pure symmetrical faults with a slowly decreasingimpedance are very unlikely <strong>to</strong> occur.For applications serving parallel lines further improvementsare required for the scheme in figure 3 in order <strong>to</strong> guaranteereliable operation. The main reason for this is that thederivative of the phase angle of the current as seen by therelay is strongly dependent on the fault location when a faul<strong>to</strong>ccurs on the parallel line. This phenomenon and its solutionis described in detail in [5].In the case of a phase <strong>to</strong> ground element the criterion inblock 2 is replaced by one based on the residual current andblocks 3 and 4 may be eliminated.IV. SIMULATIONSimulations have been performed using SIMPOW [8] and atest system introduced in [5]. The protection scheme in figure3 is implemented in relays A and B where the traditional distanceelements are of the conventional mho type and zone 3 isset <strong>to</strong> cover 230% of the line length. A global low voltageload shedding scheme is in operation. When the voltage at abus in the EHV system decreases <strong>to</strong> 0.7 pu approximately50% of the load at the closest load bus is disconnected. Theperformance of the scheme in figure 3 is examined withrespect <strong>to</strong> voltage instability.1x3000 MVA~Bus 1SMALLSYSTEM250 km2x500 MVA 2x500 MVA1x400 MVA 1x400 MVA~ ~MIDDLEbus 4bus 34bus 3425x500 MVA~SOUTHFig. 4. Test system.350 Ω180 Ω2x350 Ω500 Ω180 ΩInitially the MIDDLE and SOUTH areas are heavily loadedwith large power transports from the MIDDLE area <strong>to</strong>wardsthe SOUTH area. In the pre-fault state the power transfer frombus 3 <strong>to</strong>wards bus 34 is about 2200 MW and from bus 34 <strong>to</strong>bus 4 1200 MW. Five seconds after the simulation has starteda permanent symmetrical three phase fault with zero faultresistance occurs 150 km from bus 34 on Line 1. After 90 msthe main protection disconnects the faulted line. Consequentlythe voltage starts <strong>to</strong> decrease at bus 3 and bus 34 although theshunt capaci<strong>to</strong>r at bus 34 is taken in<strong>to</strong> operation 500 ms afterthe initiation of the fault; figure 5. About 81 seconds after thefault occurrence the apparent impedance enters the zone 3 ofthe relays A and B; figure 6. In case of traditional distancerelays undesirable operation will occur and consequently theAB250 km 250 kmLine 1450 kmbus 3100 Ω
whole system will collapse almost instantaneously. Howeverwhen the scheme in figure 3 is used the relays will not maloperatebut the voltage at bus 3 and bus 34 will continue <strong>to</strong>decrease. At 95.5 seconds the voltage at bus 34 has reached0.7 pu and thus 50% of the load at bus 342 is disconnected.Instantaneously the voltages in the system increase and thesystem recovers <strong>to</strong> a stable operating point.and 7, waiting for the main protection <strong>to</strong> clear the fault. Whenthe main protection clears the fault the apparent impedanceleaves zone 3. However as the voltages decrease and the reactivepower demand increases the zone 3 is again entered at85.9 seconds. The criterion in block 1 is again fulfilled butthis is not the case for blocks 2 and 3. Hence the relays willnot start their timers but continue <strong>to</strong> wait for a true short circuitfault.1.1s1.5 x 104 TIME [s]2 x 10⁴ 4.9 5 5.1 5.2 5.3 5.4 5.5 5.61.05110.95-----sV bus 31.51∂ϕ i rad--------∂t0.50−0.5−1VOLTAGE [pu]0.90.850.80.75V bus 34∂ϕ i rad--------∂t s0.50−0.5−1−1.5−2Time [s]0.70.650 50 100 150TIME [s]−1.5−20 50 100 150Fig. 5. The voltages at bus 3 and bus 34.Fig. 7. The derivative of the phase angle of the current as seen by relays Aand B.0.12REACTANCE [pu]0.10.080.060.04t=+5.....-5.09t=-95.5t=85.9t=+95.5t=-5.5t=+5.09pu-----s∂V∂t150010005000∂V pu∂t150010005000−500−1000−15004.9 5 5.1 5.2 5.3 5.4 5.5 5.6Time [s]0.02−5000t=-5t=+5.5−10000.03 0.04 0.05 0.06 0.07 0.08 0.09 0.1 0.11 0.12RESISTANCE [pu]Fig. 6. RX-diagram for relays A and B.If the performance of the scheme is further analysed we cansee that when the initial 3 phase fault occurs the zone 3 ofrelays A and B is entered; figure 6. At the same time figure 7shows that the derivative of the phase angle of the current hasa negative peak with a large magnitude. In addition the derivativeof the voltage shows a negative peak; figure 8. Thus thecriteria in blocks 1, 3 and 4 are fulfilled and the timer in block5 is started. The scheme starts <strong>to</strong> alternate between blocks 6−15000 50 100 150TIME [s]Fig. 8. The derivative of the voltage at bus 3.An increased relay security is achieved by adding block 4.Assume that a <strong>to</strong>o narrow setting is given <strong>to</strong> the fixed parameterin block 3. Consequently the peak of the derivative infigure 7 caused by the load shedding may be treated as a shortcircuit fault (output YES from block 3). However block 4 willprevent a mal-operation as the peak of the derivative of the
voltage at the time for the load shedding has a positive value;figure 8.The load shedding in this case is performed at a very lowvoltage level leading <strong>to</strong> particularly large changes of the electricalquantities. However there is still a significant differencebetween the absolute value of the peaks of the derivative ofthe phase angle of the current caused by the three phase faultand by the load shedding respectively. This should be kept inmind when the reliability aspect of the derivative of the phaseangle of the current as a relay criterion is discussed.V. CONCLUSIONSA new distance protection scheme is proposed where the relaysecurity is increased with respect <strong>to</strong> traditional distance relaying.The prime reason for increasing the security is <strong>to</strong> avoidmal-trips due <strong>to</strong> voltage instability and power oscillations.This is achieved by applying certain criteria in combinationwith the conventional distance protection function. Unsymmetricalfaults are discriminated from other system disturbancesby criteria based on symmetrical components.Symmetrical three phase faults are detected by a combinationof criteria based on the derivative of the phase angle of thecurrent and the derivative of the voltage. The derivative of thevoltage is used as an extra safety measure <strong>to</strong> secure correctrelay operation in case of load shedding as a remedial actionduring voltage instability.The line length, different cycle times of the power oscillationsand faults having a slowly decreasing impedance willnot affect the performance and availability of the scheme asmay be the case with conventional <strong>Power</strong> Swing Detec<strong>to</strong>rs.The scheme also prevents mal-trips due <strong>to</strong> load encroachmentassociated with voltage instability whereas the reach of thedistance relay is not restricted.The distance protection scheme is based on mathematicallogics blocks. Thus numerical relays applying a user friendlycomputer software <strong>to</strong> create the relay algorithm make it easyfor relay engineers <strong>to</strong> develop the scheme.MAST and July 3, 1996, 1403 MAST, Approved September19, 1996, Internet URL http://www.wscc.com/distnews.htm.[2] X. Vieira et. al, ”The March 11:th 1999 Blackout:Short-Term Measures <strong>to</strong> Improve <strong>System</strong> Security andOverview of the Reports Prepared by the InternationalExperts” , 1999, Brazil.[3] Taylor C.W, ”<strong>Power</strong> <strong>System</strong> Voltage Stability”, ISBN0-07-113708-4, McGraw-Hill, 1994, pp. 263.[4] Jonsson M, Daalder J, ”Distance <strong>Protection</strong> and VoltageStability”, <strong>Power</strong>Con 2000, December 4-7, 2000,Perth, Australia. Proceeding Vol. 2, pp. 971-976.[5] Jonsson M, Daalder J, ”A new protection scheme <strong>to</strong>prevent mal-trips due <strong>to</strong> power swings”, Submitted <strong>to</strong>IEEE/PES Transmission and Distribution Conferenceand Exposition, Oc<strong>to</strong>ber 28 - November 2, 2001,Atlanta, Georgia Usa.[6] Elmore W.A, ”Protective Relaying Theory and Applications”,ISBN 0-8247-9152-5, Marcel Dekker Inc,1994, pp. 16.[7] Warring<strong>to</strong>n A.R, Van C, ”Reactance Relays NegligiblyAffected by Arc Impedance”, Electrical World, Vol.98, No. 12, September 1931, pp. 502 - 505.[8] Fankhauser H.R, Aneros K, A-A Edris. and Torseng S,”Advanced Simulation Techniques for the Analysis of<strong>Power</strong> <strong>System</strong> Dynamics”, IEEE Computer Applicationsin <strong>Power</strong>, Vol. 3, No. 4, Oc<strong>to</strong>ber 1990, pp. 31 -36.VI. ACKNOWLEDGEMENTSThe authors would like <strong>to</strong> thank Svenska Kraftnät for theirinterest in this research area and for their financial and intellectualsupport. The authors also would like <strong>to</strong> thank ABB<strong>Power</strong> <strong>System</strong>s for providing Simpow.VII. REFERENCES[1] Western <strong>System</strong>s Coordinating Council DisturbanceReport For the <strong>Power</strong> <strong>System</strong> Outages that Occurredon the Western Interconnection on July 2, 1996, 1424
Paper DA new method suitable for real time genera<strong>to</strong>rcoherency determinationM. Jonsson, M. Begovic, J. DaalderSubmitted <strong>to</strong> IEEE Transactions on <strong>Power</strong> <strong>System</strong>s
A NEW METHOD SUITABLE FOR REAL TIMEGENERATOR COHERENCY DETERMINATIONMattias Jonsson, Student member, IEEE, Miroslav Begovic, Senior member, IEEE and Jaap DaalderAbstract— The aim of this paper is <strong>to</strong> illustrate thatwide area genera<strong>to</strong>r speed measurements combined withFourier analysis can be used <strong>to</strong> determine coherent genera<strong>to</strong>rgroups.Studies are based on simulations in a 68 bus test system.Three test cases are investigated where the new method iscompared <strong>to</strong> conventional methods based on the genera<strong>to</strong>rspeed, modal analysis and phasor angle measurement.The method introduced in this paper has proven <strong>to</strong> be aninteresting alternative for genera<strong>to</strong>r coherency determination.It gives almost identical results <strong>to</strong> the off-line methodsbased on the genera<strong>to</strong>r speed or modal analysis. Based ontheir trustworthiness the test cases indicate that the methodreflects a more accurate coherency than the conventional onlinemethod based on phasor angle measurement. Moreover,compared with on-line applications using modal analysis themethod supports real time applications better according <strong>to</strong>its less extensive computational requirements.Keywords— Fourier analysis, Inter-area oscillations, <strong>Power</strong>system oscillations, Transient instability, Wide area protection.I. IntroductionIT is well established that unstable or lightly dampedinter-area oscillations in the power system are highlyundesirable as it will give additional stress <strong>to</strong> equipmentand reduce the power quality. In the Swedish transmissionsystem the number of inter-area oscillation events has increasedsignificantly during recent years. One reason maybe the deregulation which was initiated in 1996. In a deregulatedsystem, power flows are decided by the complex marketarrangements between suppliers and demand and thesystem may operate under conditions for which the systemwas not originally designed. Consequently the systemmay become more sensitive <strong>to</strong> power oscillations. This isespecially true for deregulated systems which consist of afew originally regulated sub-systems. In the Scandinavianpower system larger power flow variations have been observedafter deregulation. In 1996 the annual number ofrecorded inter-area oscillation events amounted <strong>to</strong> about15 while in 2000 this number had increased <strong>to</strong> more than300 [1]! In fact, in a few cases, operating conditions haveoccurred where the system was close <strong>to</strong> its limits and onthe brink of a severe disturbance. Note that about 30 %of the events recorded in 2000 were related <strong>to</strong> a specificmaintenance job during a limited period of three weeks.This trend represents a strong incentive for precise andreliable on-line methods <strong>to</strong> ensure fast detection and ef-This work was financially supported by Svenska Kraftnät. M. Jonssonand J. Daalder are both with Chalmers University of Technology,Gothenburg, Sweden. E-mail: mattias.jonsson@elteknik.chalmers.se,jaap.daalder@elteknik.chalmers.se. M. Begovic is withGeorgia Institute of Technology, Atlanta, USA. E-mail:miroslav.begovic@ece.gatech.edufective counteraction of events involving inter-area modes.Furthermore, the fundamental presumption <strong>to</strong> assure themost effective corrective actions in case of inter-area eventsmost often involves a well established genera<strong>to</strong>r coherency.To detect inter-area modes, many different indica<strong>to</strong>rshave been proposed and realized. The most common areprobably the active power and frequency [2] but also thevoltage has been used quite frequently. Moreover differentapproaches <strong>to</strong> determine genera<strong>to</strong>r coherency have beenproposed [3] and [4], although most of them address off-linestudies. In [5], [6] and [7] Fourier analysis of the genera<strong>to</strong>rangle and kinetic energy respectively has been used foroff-line studies of power system dynamics. Here a similarapproach is adopted, although we use the speed deviation ofthe genera<strong>to</strong>rs for inter-area detection and genera<strong>to</strong>r grouping.The speed deviation reflects the energy absorbed ordelivered by the genera<strong>to</strong>r and can be used <strong>to</strong> distinguishpower oscillations, as their fundamental nature is associatedwith the energy interaction in the system.Usually genera<strong>to</strong>r coherency methods require fairly extensivecalculations. The method introduced here is simpleand suits applications based on communication andGPS technology very well. Furthermore the method is exclusivelybased on the genera<strong>to</strong>r speed variation which isstraightforward and has a well established accessibility atthe genera<strong>to</strong>r shaft. The method can be used directly asthe main <strong>to</strong>ol <strong>to</strong> determine genera<strong>to</strong>r coherency and for examplecontrol system separation. Alternatively, it can beused as a more extensive <strong>to</strong>ol <strong>to</strong> provide control parametersfor system stabilization equipment such as FACTS or PSSdevices.In this paper, network simulations which represent illustrativeexamples of inter-area events, are used <strong>to</strong> demonstrateand verify the proposed coherency method. To restrictthe size of the paper three representative cases wereselected. These cases illustrate well all observations frommultiple simulation run. In the paper, the coherency establishedby the proposed method is obtained from timeevolution of the genera<strong>to</strong>r speed spectral phase responses,which reveal grouping patterns by visual inspection. Themethod has good potential for quantitative application incomputerized <strong>System</strong> <strong>Protection</strong> Schemes.The work is a continuation of the method briefly introducedin [8].II. GROUPING OF GENERATORS BY SPEEDMEASUREMENT AND FOURIER ANALYSISIn (1) δ l corresponds <strong>to</strong> the angle between the genera<strong>to</strong>rsta<strong>to</strong>r and ro<strong>to</strong>r flux. Apart from negligible deflections resultingfrom small load variations the speed deviation ω l
will be zero during normal operation. In case of a disturbancethe present value of δ l will be altered in order <strong>to</strong> meetthe new system conditions. The transition from the pre<strong>to</strong>the post-disturbance operating point appears as more orless developed oscillations resulting from the electrical andmechanical <strong>to</strong>rque deviation. Hence ω l is obviously an authenticreflection of the oscillations present in the system.˙δ l = ω l (1)By moni<strong>to</strong>ring the genera<strong>to</strong>r speed and applying Fourieranalysis the fundamental speed will be reflected by the zerofrequency spectral component while the speed deviationcan be obtained from the non-zero frequency components.Moreover by determining the phase of the dominant nonzerofrequency component in time (i.e the dominant oscillationmode present in the system) the swing characteristicfor the machine can be obtained. Furthermore, by comparingthe phase of the dominant component for all machinesthe genera<strong>to</strong>r coherency can then be acquired. The procedureis given by (2) <strong>to</strong> (7).The Discrete Fourier Transform (DFT) of the genera<strong>to</strong>rspeed in time C is obtained according <strong>to</strong> (2) [9] where k andi are integers such that −∞ ≤ k ≤ ∞ and 0 ≤ i ≤ n − 1.The parameter ω represents the sampled genera<strong>to</strong>r speedsignal and h the window function, where h controls theextension of the part of the speed signal used <strong>to</strong> calculatethe frequency spectrum associated with the current timeof interest k. In this paper, a rectangular window functionis defined as h[m] = 1 for 0 ≤ m ≤ l − 1 and otherwiseh[m] = 0. The rectangular window shape was selected becausethe equal weighting preserves the phase informationof the sustained oscillation modes consistent with interareaoscillations. Furthermore, n are the number of equallyspaced spectral components.C[k, i] =∑l−1m=02πim −jω[k + m]h[m]e n (2)The oscillation modes present in the system are reflectedby the peaks given by the spectra including all non-zero frequencycomponents. Based on (2) we can determine a vec<strong>to</strong>rc k for each time value k (3) which contains the Fouriercoefficients c k,1 . . . c k,i . . . c k,n−1 separated by the spectralfrequency resolution decided by n. These coefficients arecomplex and denote both the magnitude and phase of eachoscillation mode. Note that the zero frequency componentis excluded in (3) as it corresponds <strong>to</strong> the fundamentalspeed. Theoretically the spectra are limited <strong>to</strong> a domaingiven by the Nyquist criterium [9]. However, in case ofshort sampling intervals the investigated frequency rangeshould be further restricted <strong>to</strong> the domain relevant <strong>to</strong> interareamodes.c k = (c k,1 , . . . , c k,i , . . . , c k,n−1 ) (3)In order <strong>to</strong> determine the dominant inter-area mode theFourier coefficient with the largest amplitude A k,dom isidentified as given in (4). The index dom denotes the positionin c k for the coefficient representing the largest magnitude.As indicated above the theoretical pick-up value foran inter-area mode is immediately above zero. However, <strong>to</strong>exclude measurement dis<strong>to</strong>rtion and frequency deviationsdue <strong>to</strong> load variations a minimum value for an acceptable(dominant) Fourier coefficient is required. Thus the finalestablishment of a dominant inter-area mode is carried outaccording <strong>to</strong> (5) where A pick−up is a pre-defined pick-upvalue outside the range of these phenomena. Note that thedominant mode may change its frequency as a function oftime and can therefore be of a temporary nature.A k,dom = max{| c k,1 |, . . . , | c k,i |, . . . , | c k,n−1 |} (4)c k,dom = c k [dom] ↔ A k,dom ≥ A pick−up (5)Once a dominant inter-area mode has been identified thephase of that mode arg{c k,dom } is determined for the involvedsystem genera<strong>to</strong>rs 1 . . . l . . . p and a vec<strong>to</strong>r is organizedincluding all these phases (6).ϕ k,dom = (arg{c k,dom,1 }, . . . ,arg{c k,dom,l }, . . . , arg{c k,dom,p }) (6)Finally, a phase comparison is performed (7) where oneof the genera<strong>to</strong>rs’ phase angle is used as the reference angleϕ ref . The genera<strong>to</strong>r coherency is then defined by ∆ϕ k,domwhere genera<strong>to</strong>rs having (approximately) the same phasedifference with respect <strong>to</strong> ϕ ref represent a coherent group.Here E is a unit vec<strong>to</strong>r of length p.∆ϕ k,dom = ϕ ref · E − ϕ k,dom (7)For the case studies in Section IV, parameters l and nwere given values corresponding <strong>to</strong> a window length of 100s and a spectral frequency resolution of 0.01 Hz. Furthermore,the sampling frequency 20 Hz was used. Note thatbefore the simulations were started the complete data windowfor each machine was initiated with values corresponding<strong>to</strong> the initial speed value.III. TEST SYSTEMThe test system used in this paper is the 68 bus NPCCsystem which is a reduced order model of the New England/NewYork interconnection about 30 years ago. Thesystem involves 16 genera<strong>to</strong>rs where genera<strong>to</strong>rs G13 <strong>to</strong>G16 represent large genera<strong>to</strong>r group equivalents. The frequencycontrol is maintained by G1 <strong>to</strong> G9 while G10 <strong>to</strong> G16are operated at a constant mechanical <strong>to</strong>rque. In Fig. 1the dashed lines indicate the coherent groups as given byRogers [10] and the thick lines indicate the weak tie-linesinterconnecting the different regions. <strong>System</strong> parametersused for the simulations are based on data given in [10].Machine data are provided in Appendix I. Furthermore, adetailed modal analysis for the base case when all systemcomponents are in service, is given in Appendix 2 (Table V,Base case).
G146641A40 48 471G1532G86025 26 282427G92961B4267G15C31 30362 G1163G1046383233 9D493483545 3651744 64 3750G1265524339G1368G1618 1716154 14125206 11135410G255G3211956G457G5E2258G62359G7SPEED [pu]1.0041.00210.99816141210GENERATOR [NUMB]86421520253035TIME [s]4045Fig. 1.Test system.Fig. 2.The speed of all machines.IV. TEST CASESBelow three test cases are given. The new method based onFourier analysis is applied on each case and in addition eachcase is investigated by three conventional methods basedon genera<strong>to</strong>r speed comparison, genera<strong>to</strong>r terminal voltageangle and modal analysis. Furthermore, modal analysis includingall relevant inter-machine and inter-area modes forthe pre- and post-disturbance systems is given in Appendix2. All simulations were performed using the power systemsimulation software SIMPOW [11], [12].A. CASE IThis case is probably the most obvious scenario. Beforethe disturbance the system is weakened as the electricaldistance between region E and the remaining system is increaseddue <strong>to</strong> the removal of line 8-9. The disturbance consistsof a permanent three phase fault located immediatelyoutside bus 1 on the line between bus 1 and bus 2 whichleads <strong>to</strong> a permanent disconnection of the faulted line. Thefault occurs after 15 seconds and is cleared within 90 ms.As the faulted line is tripped region E becomes weakly interconnected<strong>to</strong> the remaining regions via the line betweenbuses 1 and 27. As this is by far the longest line present inthe system permanent inter-area oscillations result involvingall genera<strong>to</strong>rs in the system; Fig. 2.For this case the behavior of G1 <strong>to</strong> G9 is quite similar.The same is true for G10 <strong>to</strong> G16 although the oscillationsare small for G13-G16 as they are extremely large machinesrepresenting genera<strong>to</strong>r equivalents.Fig. 3 shows that the dominant swing frequency arisingin the system is located in the range of 0.19 Hz. Furthermore,Fig. 4 gives an overview of how the genera<strong>to</strong>rsseparate in<strong>to</strong> groups based on the phase angle of the dominantFourier coefficient. By grouping of the angle graphs,the figure illustrates that G1-G9 swing against G10-G16.In case of protection applications the genera<strong>to</strong>r separationmust be determined fast and reliable. Fig. 4 confirms thatthe separation can be seen within about 3 seconds eventhough the case involves relatively slow oscillations (0.19Hz). Both genera<strong>to</strong>rs G10 and G11 stabilize at a phaseangle of around -2π (Fig. 4, lower graph). The genera<strong>to</strong>rgroup G12 <strong>to</strong> G16 stabilize at phase angle 0 (Fig. 4, uppermostgraph). As the difference is 2π (360 ◦ ) these genera<strong>to</strong>rswill swing <strong>to</strong>gether as a coherent group. For G2 <strong>to</strong> G9 thebehavior of the time-frequency spectrum is similar <strong>to</strong> theone given for G1 in Fig. 3 and for G11 <strong>to</strong> G16 the behavioris similar <strong>to</strong> Fig. 5.Fig. 3. The magnitude of the Fourier coefficients for G1 within thefrequency range of inter-area oscillations.For G1 <strong>to</strong> G9 the dominant swing frequency can clearlybe distinguished shortly after the initial disturbance. However,a low magnitude of the speed deviation of the dominantinter-area mode, in combination with damped transientswings may complicate the discrimination. An exampleis given in Fig. 5 where more time is needed in order<strong>to</strong> make a reliable discrimination as compared <strong>to</strong> Fig. 3.The magnitude of the damped frequency component in the
20are shown when the inter-machine modes are completelydamped out. Grouping of the genera<strong>to</strong>rs’ speed trajec<strong>to</strong>riesconfirms the genera<strong>to</strong>r separation as given in Fig. 4.ANGLE [rad]−2−4−6−8−1015 20 25 30 35 40 45TIME [s]SPEED [pu]1.0011.00081.00061.00041.000210.99980.99960.9994Fig. 4. The phase angles of the 0.19 Hz Fourier coefficients for allgenera<strong>to</strong>rs. The <strong>to</strong>pmost group involves G12 <strong>to</strong> G16, the middlegroup G1 <strong>to</strong> G9 and the lowest group G10 and G11.0.99920.99975.5 76 76.5 77 77.5 78 78.5 79 79.5 80 80.5 81TIME [s]vicinity of 0.45 Hz is in the same range as the magnitude ofthe unstable 0.19 Hz mode for some time after the initialdisturbance (note, the complete attenuation of the 0.45 Hzmode takes place outside the time range of Fig. 5). In additiona more or less pronounced damped 0.06 Hz componentis present (outside the frequency range of Fig. 5) for G10<strong>to</strong> G16 for some time after the three phase fault. As the0.06 Hz and 0.45 Hz components have damped characteristics,we exclude them in the coherency analysis. However,for determination of the corrective measures these modesshould also be considered as they may aggravate if inappropriatecontrol actions are deployed. The low frequencymode (0.06 Hz) may be associated with frequency control.There are also some inter-machine modes present immediatelyafter the short circuit fault.MAGNITUDE [pu]0.080.070.060.050.040.030.020.010 0.60.50.40.3FREQUENCY [Hz]0.20.1204060TIME [s]80Fig. 6. The speed of G1-G16. G1 <strong>to</strong> G9 are represented by solidlines, G10 and G11 by dotted lines and G12 <strong>to</strong> G16 by dashed lines.The detailed modal analysis for the post-disturbance networkconfiguration is given in Appendix 2, Table VI. Thereis one unstable eigenvalue corresponding <strong>to</strong> the frequency0.162 Hz. Based on modal analysis Table I shows the contribution<strong>to</strong> the eigenvec<strong>to</strong>r related <strong>to</strong> the machine speednormalized with respect <strong>to</strong> the inertia constant and thenominal power for this eigenvalue. Referring <strong>to</strong> the anglevalues, Table I indicates the same coherency as Fig. 4.The results of Fourier analysis on genera<strong>to</strong>r speed deviationagree well with the genera<strong>to</strong>r coherency methodsbased on modal analysis or speed comparison. The speedcomparison approach is a simple off-line method involvingdata trend examination. For on-line wide area measurementsthe instantaneous value of the bus angles is normallyused for coherency determination [14]. Coherency is establishedfor genera<strong>to</strong>rs occurring in a given angle interval.Fig. 7 indicates that genera<strong>to</strong>rs 1-9 swing <strong>to</strong>gether if anangle interval of (approximately) 10 degrees is accepted asa criterion for coherency. However, for genera<strong>to</strong>r 10-16 anangle difference of almost 35-40 degrees is present duringthe time interval presented in the figure. In fact, according<strong>to</strong> Fig. 7, a few among the machines G10 <strong>to</strong> G16 seem<strong>to</strong> be in close relation <strong>to</strong> G1-G9 at approximately 78.5 s.Consequently, the genera<strong>to</strong>r coherency based on the instantaneousgenera<strong>to</strong>r voltage angles gives an inferior result ascompared <strong>to</strong> the results obtained from Fourier analysis ongenera<strong>to</strong>r speed deviation (which we propose), modal analysisand speed comparison.Fig. 5. The magnitude of the Fourier coefficients for G10 within thefrequency range of inter-area oscillations.Fig. 6 illustrates the speed of the genera<strong>to</strong>rs after theline has been removed. For clarity the machine speeds
TABLE IThe contribution <strong>to</strong> the eigenvec<strong>to</strong>r related <strong>to</strong> the machine speed andnormalized with respect <strong>to</strong> the inertia constant and the nominal powerfor the 0.162 Hz mode.Genera<strong>to</strong>r Magnitude [pu] Angle [DEGREES]G1 3.24 158G2 3.30 158G3 3.26 158G4 3.28 158G5 3.22 158G6 3.26 158G7 3.26 158G8 3.12 161G9 3.12 159G10 0.784 -1.47G11 0.865 -3.10G12 0.844 -0,822G13 0.861 1.00G14 1.00 0.401G15 1.04 -0.126G16 1.00 0.00Similar <strong>to</strong> the previous case multiple inter-machine andinter-area modes are present immediately after the disturbance.Fig. 9 shows the magnitude of the Fourier coefficientsfor G15. The figure indicates that there is a modein the range of 0.42 Hz present with a magnitude similar<strong>to</strong> the undamped 0.61 Hz mode. Although the 0.42Hz component will attenuate the magnitude of that modeis in fact larger than the magnitude of the 0.61 Hz modeimmediately after the disturbance. This may delay a discriminationof the most important mode based on localdata exclusively. The frequency-time spectra look similarfor G10, G11, G14, G15 and G16. However, the influencefrom the 0.42 Hz mode is by far most significant for G15.Thus by comparing the magnitudes in Fig. 8 and Fig. 9the observation can again be made that the discriminationof the dominant mode is dependent on the extent of thegenera<strong>to</strong>r involvement in the dominant inter-area mode.9080700.5GENERATOR ANGLES [DEG]605040302010MAGNITUDE [pu]0.40.30.20.100.80.6500−1075 76 77 78 79 80 81 82TIME [s]0.4FREQUENCY [Hz]0.20102030TIME [s]40Fig. 7. The angles of the terminal voltages for G1-G16. G1 <strong>to</strong> G9are represented by solid lines and G10 <strong>to</strong> G16 by dotted lines.Fig. 8. The magnitude of the Fourier coefficients for G2 within thefrequency range of inter-area oscillations.B. CASE IIIn this case G2 and G3 becomes weakly connected <strong>to</strong> thesurrounding system which in turn leads <strong>to</strong> inter-area oscillations.Before the time-domain simulation is started,the line between bus 5 and bus 6 is taken out of service.Although a stable loadflow solution is found the system isunstable already at this point according <strong>to</strong> the modal analysisin Appendix 2, Table V. However, <strong>to</strong> push the systemaway from its steady-state solution the system is subjected<strong>to</strong> an additional disturbance. The disturbance occurs after15 seconds and consists of a permanent three phase faultlocated immediately outside bus 14 on the line betweenbus 13 and bus 14. The three phase fault is cleared within90 ms as the faulted line is permanently removed by theline protection. Consequently, inter-area oscillations ariseinvolving all genera<strong>to</strong>rs in the system. The dominant interareamode present in this case is in the range of 0.61 Hz;Fig. 8. The frequency-time spectra for G1-G9, G12 andG13 are almost identical.MAGNITUDE [pu]0.10.080.060.040.02060500.2400.30.4300.50.6200.70.8TIME [s]FREQUENCY [Hz]Fig. 9. The magnitude of the Fourier coefficients for G15 within thefrequency range of inter-area oscillations.
By grouping the phase angles of the 0.61 Hz Fouriercoefficients associated with the genera<strong>to</strong>rs’ speed signals,Fig. 10 indicates that G1-G9 and G11-G14 represent twogenera<strong>to</strong>r groups while G10, G15-G16 follow separateswing trajec<strong>to</strong>ries. Referring <strong>to</strong> the grouping pattern ofthe speed trajec<strong>to</strong>ries and the angles associated with themodal analysis, respectively, the coherency in Fig. 10 isconfirmed by the speed plot in Fig. 11 and the modal analysisin Table II. Table II is given for the unstable eigenvaluecorresponding <strong>to</strong> the 0.607 Hz mode. Note that the angleassociated with G14 stabilizes close <strong>to</strong> 2π in Fig. 10. ThusG14 should be grouped <strong>to</strong>gether with G11 <strong>to</strong> G13 as theystabilize close <strong>to</strong> the corresponding angle 0.ANGLE [rad]8642clearly indicate that G11-G14 swing <strong>to</strong>gether. However, inFig. 12 the internal angle differences for some of machinesG11-G14 are actually larger than their angle differenceswith respect <strong>to</strong> machines G1-G9 and G15-G16.TABLE IIThe contribution <strong>to</strong> the eigenvec<strong>to</strong>r related <strong>to</strong> the machine speed andnormalized with respect <strong>to</strong> the inertia constant and the nominal powerfor the 0.607 Hz mode.Genera<strong>to</strong>r Magnitude [pu] Angle [DEGREES]G1 0.57 132G2 0.58 138G3 0.59 142G4 0.93 139G5 1.01 142G6 0.97 139G7 0.94 139G8 0.71 154G9 0.89 146G10 0.174 56.9G11 0.22 1.31G12 0.54 1.85G13 1.00 0.00G14 0.19 -3.26G15 0.05 -114G16 0.18 -1750−210−415 20 25 30 35 40 45TIME [s]Fig. 10. The phase angles of the 0.61 Hz Fourier coefficients forall genera<strong>to</strong>rs. Solid lines are used for G1-G9, dashed lines for G10,G15-G16, dotted lines for G11-G13 and the dashed dotted line forG14.GENERATOR ANGLES [DEG]0−10−20−30−401.0041.003−5075.2 75.4 75.6 75.8 76 76.2 76.4 76.6 76.8 77 77.2TIME [s]SPEED [pu]1.0021.00110.9990.9980.9970.99675.4 75.6 75.8 76 76.2 76.4 76.6 76.8 77TIME [s]Fig. 11. The speed of G1-G16. Solid lines corresponds <strong>to</strong> G1-G9,dashed lines <strong>to</strong> G10, G15-G16 and dotted lines <strong>to</strong> G11-G14.In this case <strong>to</strong>o, the genera<strong>to</strong>r voltage angle seems <strong>to</strong> be adubious indica<strong>to</strong>r of coherency. Herein, the other methodsFig. 12. The angles of the terminal voltages for G1-G16. Solid linescorrespond <strong>to</strong> G1-G9, dashed lines <strong>to</strong> G10, G15-G16 and dotted lines<strong>to</strong> G11-G14.C. CASE IIIBefore the disturbance region B is separated from the res<strong>to</strong>f the system as the lines bus 42 - bus 41 and bus 42 -bus 52 are taken out of service. Thus G16 becomes weaklyinterconnected <strong>to</strong> the remaining system. For this case thedisturbance which occurs after 15 seconds corresponds <strong>to</strong>a step load reduction at bus 52 amounting <strong>to</strong> about 4.5%of the <strong>to</strong>tal bus load. As a result power oscillations occurwhere G16 swings against the remaining system.The most significant mode is located in the vicinity of0.31 Hz. This is illustrated in Fig. 13. Outside the rangeof the figure there are some decaying inter-machine modesand a damped mode within the range of 0.05 Hz present
immediately after the load reduction. The 0.31 Hz mode ispoorly damped and in fact leads <strong>to</strong> the loss of synchronismfor G16 after about 300 seconds. Cascading outages resultleading <strong>to</strong> a <strong>to</strong>tal system blackout.10−1MAGNITUDE [pu]0.350.30.250.20.150.1ANGLE [rad]−2−3−4−5−60.0500.815 20 25 30 35 40 45TIME [s]0.60.4FREQUENCY [Hz]0.2002040TIME [s]6080Fig. 14. The phase angles of the 0.31 Hz Fourier coefficients for allgenera<strong>to</strong>rs. Solid lines are used for G1-G14 and G16 is representedby the dotted line.Fig. 13. The magnitude of the Fourier coefficients for G14 withinthe frequency range of inter area oscillations.The angle values in Table III suggest a coherency whereG1-G14 oscillate against G16. Such a grouping pattern isfurther disclosed by the phase angles of the 0.31 Hz coefficientsillustrated in Fig. 14. Note that G14 with an angleclose <strong>to</strong> -6 rad should be grouped with the genera<strong>to</strong>rs havingthe corresponding angles 0. The genera<strong>to</strong>r separationrevealed by the grouping pattern of speed trajec<strong>to</strong>ries inFig. 15 also agrees well with the separation indicated bythe previous methods. The terminal voltage angle for thegenera<strong>to</strong>rs are illustrated in Fig. 16. Disregarded parts ofG14s trajec<strong>to</strong>ry also the genera<strong>to</strong>r angles indicate a similargenera<strong>to</strong>r coherency as the other methods for this case.Observe that since G15 is separated from the main systemthe genera<strong>to</strong>r is not represented in Fig. 14, Fig. 15 andFig. 16.TABLE IIIThe contribution <strong>to</strong> the eigenvec<strong>to</strong>r related <strong>to</strong> the machinespeed and normalized with respect <strong>to</strong> the inertia constantand the nominal power for the 0.330 Hz mode.Genera<strong>to</strong>r Magnitude [pu] Angle [DEGRESS]G1 0.11 19.3G2 0.10 20.9G3 0.10 18.7G4 0.11 17.0G5 0.11 15.1G6 0.11 15.9G7 0.11 16.4G8 0.11 9.63G9 0.12 14.5G10 0.09 21.7G11 0.07 21.3G12 0.06 51.3G13 0.07 58.1G14 1.00 0.00G15 - -G16 0.35 166SPEED [pu]1.00081.00061.00041.000210.99980.99960.99940.999274.5 75 75.5 76 76.5 77 77.5 78 78.5TIME [s]Fig. 15. The speed of G1-G16. Solid lines corresponds <strong>to</strong> G1-G14and the dotted line <strong>to</strong> G16.GENERATOR ANGLES [DEG]1601501401301201101009074.5 75 75.5 76 76.5 77 77.5 78 78.5TIME [s]Fig. 16. The angles of the terminal voltages for G1-G14 and G16.G1-G13 are represented by solid lines, G14 by the dashed line andG16 by the dotted line.
In addition <strong>to</strong> the 0.330 Hz mode used for the modalanalysis in Table III, Appendix 2 gives the rest of the relevantmodes. For example, in the vicinity of 0.05 Hz is thelow frequency 0.042 Hz mode represented.V. DISCUSSIONObviously many challenges must be conquered in order <strong>to</strong>realize a <strong>System</strong> <strong>Protection</strong> Scheme (SPS) based on themethod introduced in this paper. A few of these challengesare briefly discussed below. At this early stage issues related<strong>to</strong> the practical implementation are disregarded andthus the focus aims at <strong>to</strong>pics associated with the conceptexclusively.The Digital Signal Processing (DSP) issue is probablythe most crucial part <strong>to</strong> solve in order <strong>to</strong> obtain a satisfac<strong>to</strong>ryoperating scheme. Other important issues involvethe geographical structure of the system, wide areadata processing and the counteractive measures. However,these issues can be solved by fairly conventional solutions,where for example, GPS based Phasor Measurement Units(PMUs) represent powerful <strong>to</strong>ols as they can provide timesynchronized wide area speed measurements.The Digital Signal Processing (DSP) requirements fora SPS based on the method introduced in this paper canbe divided in<strong>to</strong> three parts; first the detection and verificationof the dominant inter-area mode, then the phaseestimation associated with that mode and finally the stable/unstablenature of the mode(s). An accurate and fastdistinguishing between unstable and stable modes is of particularimportance in order <strong>to</strong> obtain successful correctiveactions. Referring <strong>to</strong> Fig. 5 and Fig. 9, in some cases andfor certain genera<strong>to</strong>rs more than one mode may initially bepresent. Obviously this behavior complicates the detectionprocess, nevertheless it is also important <strong>to</strong> successfully resolvethese cases and distinguish the dominant mode asquick as possible.For optimal performance the Fourier coefficients shouldbe continuously determined with a high frequency resolutionat the same time as they are based on data samplescorresponding <strong>to</strong> a very short time segment i.e high timeresolution. The nature of these high requirements for thefrequency-time resolution is related <strong>to</strong> the necessity of anaccurate moni<strong>to</strong>ring of the instant system status as it isessential for the detection and curative processes. This isespecially true if more than one contingency occurs in ashort time or in the case of emergency situations involvingcascading outages. However, according <strong>to</strong> the uncertaintyprinciple [13] a trade-off between frequency and time accuracymust always be accepted where the most appropriatefrequency-time relation for the given application should beselected. Parameters that will influence the selection involvethe possibility of inter-area modes close in frequencyand the likelihood for fast subsequent events. As in thecase of lower frequency resolution the ability <strong>to</strong> identifyadjacent modes will be reduced while the moni<strong>to</strong>ring ofthe instantaneous nature of the signal will be deterioratedwhen the window length is increased. The frequency-timerelation applied in Section IV denotes a high frequencyaccuracy at the expense of the time resolution. According<strong>to</strong> test simulations a reduced frequency accuracy maylead <strong>to</strong> enhanced phase fluctuations and therefore the givenfrequency-time relation was selected in order <strong>to</strong> clearly illustratethe method. However, for practical events involvingchanging system configurations the time resolution inSection IV is most likely insufficient.The most natural choice of a geographical structure forthe scheme is either the Wide Area Remote or the WideArea Central as defined in [14]. Obviously combinations ofthese two structures are also applicable. Furthermore, thecorrective measures controlled by the scheme may involveany conventional curative SPS actions.The issues discussed above are all addressed in ongoingwork.In the test cases above, direct comparison of the genera<strong>to</strong>rs’speed was used <strong>to</strong> visually investigate the genera<strong>to</strong>rcoherency. The direct speed comparison is acceptablefor simulation based coherency analysis, where the completeswing trajec<strong>to</strong>ries of the machines covering the entireevent are accessible. However, in case of real (time) applications,coherency methods based on instantaneous groupingof the pure speed signals or the rate of change of speedare less reliable. As the measured speed signal normally involvessignificant transient dis<strong>to</strong>rtion immediately after thedisturbance, which may be difficult <strong>to</strong> reliably remove byreal time filtering. This is also indicated by the three testcases where the speed plots had <strong>to</strong> be given a substantialtime after the initial contingency when the (inter-machine)transients have attenuated in order <strong>to</strong> obtain a useful illustration.The genera<strong>to</strong>r voltage angle also suffers from thesame inadequacy. Consequently, according <strong>to</strong> the investigationa reliable coherency can be established quicker bythe method introduced here as compared <strong>to</strong> methods basedon pure speed, rate of change of speed or genera<strong>to</strong>r voltagephasor comparison.In some test cases there are small variations between theinter-area modes obtained from the Fourier based methodand the modal analysis. For example, in Case I the Fourierbased method indicates that the dominant mode corresponds<strong>to</strong> 0.19 Hz while the dominant mode obtained fromthe modal analysis is 0.162 Hz. These small deviations aremainly an effect of the difference between the non-linearsimulation model and the linearized modal analysis model.VI. CONCLUSIONSA method suitable for on-line determination of genera<strong>to</strong>rcoherency has been introduced. The method is basedon wide area genera<strong>to</strong>r speed measurements and Fourieranalysis. Three test cases have been used <strong>to</strong> illustratethe performance, where the new concept is compared <strong>to</strong>conventional methods based on genera<strong>to</strong>r speed comparison,modal analysis and phasor angle measurements. Ina broader perspective, the method may be regarded as a<strong>to</strong>ol <strong>to</strong> interpret the nature of power system oscillationsfollowing events for which the system was not planned.For the test cases the method shows promising results asa <strong>to</strong>ol for genera<strong>to</strong>r coherency determination. It gives al-
most identical results if compared with the off-line methodsbased on the genera<strong>to</strong>r speed and modal analysis. Basedon the confidence in those methods the test cases indicatethat the new concept reflects a more accurate coherencythan the conventional method using the genera<strong>to</strong>r voltageangle. This is especially interesting as the genera<strong>to</strong>r angleprobably is <strong>to</strong>days most common on-line indica<strong>to</strong>r for genera<strong>to</strong>rcoherency determination. Taking the transient dis<strong>to</strong>rtionimmediately after a disturbance in<strong>to</strong> account, theinvestigation indicates that the method introduced here,generates a reliable coherency considerably quicker thanthe methods based on pure speed or genera<strong>to</strong>r voltage anglemeasurements. Finally, compared <strong>to</strong> on-line methodsbased on modal analysis the method supports real timeapplications better according <strong>to</strong> its less extensive computationalrequirements.AcknowledgmentsThe authors would like <strong>to</strong> thank Svenska Kraftnät for theirinterest in this research area and for their financial support.The authors also would like <strong>to</strong> thank ABB <strong>Power</strong> <strong>System</strong>sfor providing Simpow. Graham Rogers is acknowledged forhis help related <strong>to</strong> the test system.Mattias Jonsson would like <strong>to</strong> express his sincere gratitude<strong>to</strong> Professor Miroslav Begovic for accepting him as avisiting scholar in his group during the spring and summerof the year 2002.[14] Jonsson M, Present Status of <strong>System</strong> <strong>Protection</strong> Schemes, Tech.Report 23R, Chalmers University of Technology, Gothenburg,Sweden, 2002. pp. 30.Mattias Jonsson received his M. Sc. and Lic.Eng from ChalmersUniversity of Technology in 1998 and 2001, respectively. His interestlies in power system stability and power system protection. At presenthe works <strong>to</strong>wards a Ph.D. thesis.Miroslav Begovic (S’87, M’89, SM’92) is Associate Professor in theSchool of ECE, Georgia Institute of Technology in Atlanta, Georgia.His interests are in the general area of computer applications in powersystem moni<strong>to</strong>ring, protection and control, and design and analysisof renewable energy sources. Dr. Begovic chairs the Working Group”Wide Area <strong>Protection</strong> and Emergency Control” in the <strong>Power</strong> <strong>System</strong>sRelaying Committee of the IEEE <strong>Power</strong> Engineering Society.Dr. Begovic’s work on distributed generation and pho<strong>to</strong>voltaic (PV)systems has resulted in design of the 340 kW PV system on the roofof the Georgia Tech Aquatic Center, which was the largest of its kindat the time of initial deployment. Dr. Begovic is a Senior Memberof IEEE’s <strong>Power</strong> Engineering, Circuits and <strong>System</strong>s, and ComputerSocieties, and a member of Sigma Xi, Tau Beta Pi, Eta Kappa Nu,and Phi Kappa Phi.Jaap Daalder obtained his Ph.D in power engineering from theEindhoven University of Technology, The Netherlands. He workedthere as an Associate Professor until 1984 when he left for Norway<strong>to</strong> become a Direc<strong>to</strong>r of Technology and Member of the Board of asubsidiary of the Brown Boveri Company, nowadays ABB. In 1993 hewas appointed as full Professor at Chalmers University of Technology.Since 1997 he is heading the Department of Electric <strong>Power</strong> Engineering.His areas of interest are power systems and environmental issuesrelated <strong>to</strong> power engineering.References[1] Wide Area <strong>Protection</strong> seminar, Real-Time Moni<strong>to</strong>ring of FastDynamic in the Swedish National Grid (Fast RTMS), Presentationby Svenska Kraftnät, Västerås, Sweden, April 2, 2001.[2] Murphy R.J, Disturbance Recorders Trigger Detection and <strong>Protection</strong>,IEEE Computer Applications in <strong>Power</strong>, Vol. 9, Issue. 1,January 1996, pp. 24 -28.[3] Ramaswamy G.N et al., Multi-dimensional synchrony and dynamicequivalencing, Proceedings of the 4th IEEE Conferenceon Control Applications, Albany, NY, USA, September 28 - 29,1995, pp.605 - 610.[4] Ramaswamy G.N et al., Synchrony, Aggregation, and Multi-AreaEigenanalysis, IEEE Transactions on <strong>Power</strong> <strong>System</strong>s, Vol. 10,No. 4, November 1995, pp. 1986 - 1993.[5] Os<strong>to</strong>jic D.R, Heydt G.T, Transient Stability Assessment by PatternRecognition in the Frequency Domain, IEEE Transactionson <strong>Power</strong> <strong>System</strong>s, Vol. 6, No. 1, February 1991, pp. 231 - 237.[6] Os<strong>to</strong>jic D.R, Spectral Moni<strong>to</strong>ring of <strong>Power</strong> <strong>System</strong> Dynamic Perormances,IEEE Transactions on <strong>Power</strong> <strong>System</strong>s, Vol. 8, No. 2,May 1993, pp. 445 - 451.[7] Kamwa I, Grondin R, Loud L, Time-Varying ContingencyScreening for Dynamic Security Assessment Using Intelligent-<strong>System</strong>s Techniques, IEEE Transactions on <strong>Power</strong> <strong>System</strong>s, Vol.16, No. 3, August 2001, pp. 526 - 536.[8] Begovic M.M, Milisavljevic M, Moni<strong>to</strong>ring and Control of InterareaOscillations Via Real-Time Measurements and TCSC Control,Proceedings of the Bulk <strong>Power</strong> <strong>System</strong> Dynamics and ControlIV - Restructuring, San<strong>to</strong>rini, Greece, August 24 - 28, 1997.[9] Oppenheim A.V, Schafer R.W, Discrete-Time Signal Processing,2nd ed, ISBN: 0-13-216292-X, Prentice Hall, 1989.[10] Rogers G, <strong>Power</strong> <strong>System</strong> Oscillations, ISBN: 0-7923-7712-5,Kluwer Academic Publisher, 2000.[11] Fankhauser H.R, Aneros K, A-A Edris. and Torseng S, AdvancedSimulation Techniques for the Analysis of <strong>Power</strong> <strong>System</strong>Dynamics, IEEE Computer Applications in <strong>Power</strong>, Vol. 3, No. 4,Oc<strong>to</strong>ber 1990, pp. 31 - 36.[12] Internet Address, www.abb.com/simpow, 2003.[13] Qian S, Chen D, Joint time-frequency analysis - methods andapplications, ISBN: 0-13-254384-2, Prentice-Hall, 1996.
Appendix ITABLE IVNominal power and inertia constant for the genera<strong>to</strong>rs in the test system.Genera<strong>to</strong>r Nominal power [MVA] H [MWs/MVA]G1 1800 2.33G2 610 4.95G3 721 4.96G4 687 4.16G5 545 4.77G6 709 4.91G7 610 4.33G8 621 3.92G9 855 4.04G10 1065 2.91G11 1406 2.00G12 1782 5.18G13 12162 4.08G14 10000 3.00G15 10000 3.00G16 10112 4.45Appendix IITABLE VOscillation frequency f, real part of the eigenvalue σ and damping ratio ζ extracted from the relevant eigenvalues for the base case and thepre-fault systems. The <strong>to</strong>tal number of states is 82.Base case Case I Case II Case IIIf [Hz] σ [s −1 ] ζ [pu] f [Hz] σ [s −1 ] ζ [pu] f [Hz] σ [s −1 ] ζ [pu] f [Hz] σ [s −1 ] ζ [pu]0.050 -0.0486 0.1535 0.050 -0.0482 0.1528 0.051 -0.0533 0.1655 0.053 -0.0519 0.15500.418 -0.1792 0.0681 0.405 -0.1370 0.0538 0.415 -0.1471 0.0564 0.332 -0.0116 0.00560.555 -0.0923 0.265 0.522 -0.1269 0.0386 0.554 -0.0787 0.0226 0.441 -0.1193 0.04300.627 -0.0311 0.0079 0.573 -0.1100 0.0305 0.603 0.0584 -0.0154 0.636 -0.0695 0.01740.716 -0.0972 0.0216 0.715 -0.0967 0.0215 0.715 -0.0965 0.0215 0.972 -0.1083 0.01770.972 -0.1083 0.0177 0.962 -0.0795 0.0131 0.971 -0.1041 0.0170 0.982 -0.0799 0.01300.978 -0.0731 0.0119 0.976 -0.0673 0.0110 0.974 -0.0661 0.0108 1.061 -0.2368 0.03551.062 -0.2312 0.0346 1.040 -0.2590 0.0396 1.036 -0.2319 0.0356 1.092 -0.1252 0.01821.092 -0.1313 0.0191 1.085 -0.1008 0.0148 1.090 -0.1066 0.0156 1.115 -0.0293 0.00421.115 -0.0330 0.0047 1.114 -0.0300 0.0042 1.115 -0.0316 0.0045 1.161 -0.3156 0.04321.120 -0.2873 0.0382 1.161 -0.3156 0.0432 1.161 -0.3154 0.0432 1.191 -0.2934 0.03921.161 -0.3157 0.0432 1.203 -0.2825 0.0374 1.193 -0.3111 0.0415 1.335 -0.0617 0.00741.347 -0.0828 0.0098 1.346 -0.0786 0.0093 1.333 -0.0551 0.0066 1.376 -0.4003 0.04631.376 -0.4003 0.0463 1.376 -0.4003 0.0463 1.377 -0.4025 0.0465 1.409 -0.3257 0.03681.409 -0.3251 0.0367 1.409 -0.3246 0.0366 1.409 -0.3259 0.0368 1.718 -0.4635 0.04291.720 -0.4620 0.0427 1.710 -0.4528 0.0421 1.716 -0.4621 0.0428 - - -TABLE VIOscillation frequency f, real part of the eigenvalue σ and damping ratio ζ extracted from the relevant eigenvalues for the post-fault systems. The<strong>to</strong>tal number of states is 82.Case I Case II Case IIIf [Hz] σ [s −1 ] ζ [pu] f [Hz] σ [s −1 ] ζ [pu] f [Hz] σ [s −1 ] ζ [pu]0.057 -0.0905 0.2449 0.050 -0.0519 0.1624 0.042 -0.0302 0.11450.162 0.0617 -0.0606 0.415 -0.1513 0.0579 0.330 -0.0072 0.00350.457 -0.2254 0.0783 0.554 -0.0830 0.0238 0.440 -0.1194 0.04310.563 -0.1028 0.0290 0.607 0.0400 -0.0105 0.636 -0.0695 0.01740.715 -0.0957 0.0213 0.715 -0.0967 0.0215 0.972 -0.1083 0.01770.963 -0.1063 0.0176 0.871 -0.0990 0.0181 0.982 -0.0799 0.01300.968 -0.0522 0.0086 0.973 -0.1177 0.0192 1.061 -0.2368 0.03551.038 -0.2546 0.0390 0.981 -0.0631 0.0102 1.092 -0.1252 0.01821.088 -0.0863 0.0126 1.086 -0.0951 0.0139 1.115 -0.0293 0.00421.124 -0.0945 0.0134 1.110 -0.0296 0.0042 1.161 -0.3156 0.04321.160 -0.3070 0.0421 1.159 -0.3068 0.0421 1.191 -0.2934 0.03921.201 -0.2818 0.0373 1.198 -0.2792 0.0371 1.335 -0.0617 0.00741.337 -0.0460 0.0055 1.341 -0.0527 0.0063 1.376 -0.4003 0.04631.377 -0.4025 0.0465 1.375 -0.4011 0.0464 1.409 -0.3257 0.03681.414 -0.3082 0.0347 1.414 -0.3066 0.0345 1.718 -0.4635 0.04291.682 -0.4430 0.0419 1.716 -0.4622 0.0428 - - -
Paper EA system protection scheme concept <strong>to</strong>counter inter-area oscillationsM. Jonsson, J. Daalder, M. BegovicSubmitted <strong>to</strong> IEEE Transactions on <strong>Power</strong> Delivery
A SYSTEM PROTECTION SCHEME CONCEPTTO COUNTER INTER-AREA OSCILLATIONSMattias Jonsson, Student member IEEE, Jaap Daalder and Miroslav Begovic, Senior member IEEEAbstract— This paper introduces a concept of a genera<strong>to</strong>rcoherency based <strong>System</strong> <strong>Protection</strong> Scheme, addressinginter-area oscillation events. The scheme uses wide area genera<strong>to</strong>rspeed measurements combined with DFT analysis <strong>to</strong>determine coherency.A test case simulated in the NPCC 68 bus system is used<strong>to</strong> introduce the scheme’s operating principle. The test caseis also used <strong>to</strong> investigate the scheme suitability for differentwell established DSP methods. Further aspects as evolving-/sliding window functions, window size and frequency resolutionare analyzed.For the detection of inter-area modes, parametric DSPmethods turned out <strong>to</strong> be the most feasible. In generalevolving windows are faster than sliding windows. However,evolving windows require a trigger and were thereforerejected for the design proposed here. A lower frequencyresolution may shorten the response time at the expense ofthe quality of the estimates of the instantaneous speed deviationand the genera<strong>to</strong>r coherency. The design proposedhere is based on a high frequency resolution at the cost of alower respond time.Keywords— Coherency determination, DFT analysis, DSP,Inter-area oscillations, <strong>System</strong> <strong>Protection</strong> Scheme, Transientinstability, Wide Area <strong>Protection</strong>.I. IntroductionOPERATING limits of electrical bulk power systemsare continuously stretched due <strong>to</strong> environmental constraintsand deregulation. Different types of power systeminstability are the immediate threat <strong>to</strong> power systems. Inearly years transient stability was the main issue while voltagestability has become important during the last 20 years.Many applications have been developed in order <strong>to</strong> mastervoltage stability and <strong>to</strong> some extent it may be argued thattransient stability was given less priority. However, in theSwedish transmission system and likely due <strong>to</strong> deregulation,the annual number of inter-area events has increasedsignificantly during recent years. In 1996 the annual rate ofrecorded inter-area oscillation events was about 15 while in2000 the rate had increased <strong>to</strong> more than 300 [1]! In fact, ina few cases, operating conditions have occurred where thesystem was close <strong>to</strong> its limits (it should be noted that about30 % of the events recorded in 2000 were related <strong>to</strong> one specificmaintenance job lasting three weeks). As an example,a very serious condition occurred during the evening of NewYears Day in 1997. An earth fault on a 400 kV busbar inthe South-West part of Sweden combined with an unusualpre-fault loading condition resulted in serious power oscillations(maximum 1100 MW peak <strong>to</strong> peak) which in its turnThis work was financially supported by Svenska Kraftnät. M. Jonssonand J. Daalder are both with Chalmers University of Technology,Gothenburg, Sweden. E-mail: mattias.jonsson@elteknik.chalmers.se,jaap.daalder@elteknik.chalmers.se. M. Begovic is withGeorgia Institute of Technology, Atlanta, USA. E-mail:miroslav.begovic@ece.gatech.eduled <strong>to</strong> the loss of a nuclear plant (1700 MW). The systemwas on the brink of a blackout [2]. The increasing numberof power oscillations encourage strong incentives for preciseand reliable on-line methods <strong>to</strong> ensure fast detectionand effective counteraction of events involving inter-areamodes. Moreover, the fundamental presumption <strong>to</strong> ensurethe most effective corrective actions in case of inter-areaevents is a well established genera<strong>to</strong>r coherency.<strong>System</strong> <strong>Protection</strong> Schemes (SPS) are attractive candidates<strong>to</strong> improve system performance due <strong>to</strong> their environmentallyfriendly character and relatively low costcompared <strong>to</strong> building new power plants and transmissionlines. Recently developed communication and computerbased technologies have significantly enhanced the potentialsgiven by SPS.In [3] a new method for genera<strong>to</strong>r coherency determinationwas introduced which supports SPS applicationsvery well. According <strong>to</strong> the investigation carried out in[3] the new method defines a more reliable coherency thanfor example genera<strong>to</strong>r angle moni<strong>to</strong>ring. In addition, theinvestigation indicated that the new method establishes thecoherency faster than conventional angle moni<strong>to</strong>ring as itis less sensitive <strong>to</strong> transient dis<strong>to</strong>rtion. In this paper someconceptional solutions for this method are introduced. TheDigital Signal Processing (DSP) issue is probably the mostcrucial part in order <strong>to</strong> obtain a reliable scheme based onthe new method. Another important aspect is the techniqueused for the instantaneous speed (frequency) measurement.Extensive work has been reported in this area,where any opportune technique processing reliable low frequencyestimates can be used for the scheme. Examples ofmethods used for frequency estimation in power networksare polynomial DFT and tracking of zero crossings. Theseand additional methods are further described in [4] and [5].Further important issues involve the geographical structureof the scheme, wide area data processing and the counteractivemeasures. These issues can be solved by fairly conventionalsolutions, where for example, GPS based PhasorMeasurement Units (PMUs) are powerful <strong>to</strong>ols as they area good example of the equipment that can provide timesynchronized wide area speed measurements. In additionthey posses the capability <strong>to</strong> perform extended data processingwhich make them attractive for this application.However, the main focus in this paper is on the DSP partas it represents the main issue for a practical realization ofthe scheme.
II. GROUPING OF GENERATORS BY SPEEDMEASUREMENT AND DFT ANALYSISIn (1) δ l corresponds <strong>to</strong> the angle between the genera<strong>to</strong>rsta<strong>to</strong>r and ro<strong>to</strong>r flux. Apart from negligible deflections resultingfrom small load variations the speed deviation ω lwill be zero during normal operation. In case of a disturbancethe present value of δ l will be altered in order <strong>to</strong> meetthe new system conditions. The transition from the pre<strong>to</strong>the post-disturbance operating point appears as more orless developed oscillations resulting from the electrical andmechanical <strong>to</strong>rque deviation. Hence ω l is obviously an authenticreflection of the oscillations present in the system.˙δ l = ω l (1)By moni<strong>to</strong>ring the genera<strong>to</strong>r speed and applying DiscreteFourier Transform (DFT) analysis the fundamentalspeed will be reflected by the zero frequency spectral componentwhile the speed deviation can be obtained from thenon-zero frequency components. Moreover by determiningthe phase of the dominant non-zero frequency componentin time (i.e the dominant oscillation mode present in thesystem) the swing characteristic for the machine can be obtained.Furthermore, by comparing the phase of the dominantcomponent for all machines the genera<strong>to</strong>r coherencycan then be acquired. The procedure is given by (2) <strong>to</strong> (7).The DFT of the genera<strong>to</strong>r speed in time C is obtainedaccording <strong>to</strong> (2) [6] where k and i are integers such that−∞ ≤ k ≤ ∞ and 0 ≤ i ≤ n − 1. The parameter ωrepresents the sampled genera<strong>to</strong>r speed signal and h thewindow function, where h controls the extension of the par<strong>to</strong>f the speed signal used <strong>to</strong> calculate the frequency spectrumassociated with the current time of interest k. In this papera rectangular window function is adopted defined as h[m] =1 for 0 ≤ m ≤ l − 1 and otherwise h[m] = 0. Furthermore,n are the number of equally spaced spectral components.C[k, i] =∑l−1m=02πim −jω[k + m]h[m]e n (2)The oscillation modes present in the system are reflectedby the peaks given by the spectra including all non-zerofrequency components. Based on (2) we can determine avec<strong>to</strong>r c k for each time value k (3) which contains the DFTcoefficients c k,1 . . . c k,i . . . c k,n−1 separated by the spectralfrequency resolution decided by n. These coefficients arecomplex and denote both the magnitude and phase of eachoscillation mode. Note that the zero frequency componentis excluded in (3) as it corresponds <strong>to</strong> the fundamentalspeed. Theoretically the spectra are limited <strong>to</strong> a domaingiven by the Nyquist criterium [6]. However, in case ofshort sampling intervals the investigated frequency rangeshould be further restricted <strong>to</strong> the domain relevant <strong>to</strong> interareamodes.c k = (c k,1 , . . . , c k,i , . . . , c k,n−1 ) (3)In order <strong>to</strong> determine the dominant inter-area mode theDFT coefficient with the largest amplitude A k,dom is identifiedas given in (4). The index dom corresponds <strong>to</strong> theposition in c k for the DFT coefficient representing thelargest magnitude. As indicated above the theoretical pickupvalue for an inter-area mode is immediately above zero.However, <strong>to</strong> exclude measurement dis<strong>to</strong>rtion and frequencydeviations due <strong>to</strong> load variations a minimum value for anacceptable (dominant) DFT coefficient is required. Thusthe final establishment of a dominant inter-area mode iscarried out according <strong>to</strong> (5) where A pick−up is a pre-definedpick-up value outside the range of these phenomena. Notethat the dominant mode may change its frequency as afunction of time and can therefore be of a temporary nature.A k,dom = max{| c k,1 |, . . . , | c k,i |, . . . , | c k,n−1 |} (4)c k,dom = c k [dom] ↔ A k,dom ≥ A pick−up (5)Once a dominant inter-area mode has been identified thephase of that mode arg{c k,dom } is determined for the involvedsystem genera<strong>to</strong>rs 1 . . . l . . . p and a vec<strong>to</strong>r is organizedincluding all these phases (6).ϕ k,dom = (arg{c k,dom,1 }, . . . ,arg{c k,dom,l }, . . . , arg{c k,dom,p }) (6)Finally, a phase comparison is performed (7) where oneof the genera<strong>to</strong>rs’ phase angle is used as the reference angleϕ ref . The genera<strong>to</strong>r coherency is then defined by ∆ϕ k,domwhere genera<strong>to</strong>rs having (approximately) the same phasedifference with respect <strong>to</strong> ϕ ref represent a coherent group.Here E is a unit vec<strong>to</strong>r of length p.∆ϕ k,dom = ϕ ref · E − ϕ k,dom (7)III. STRUCTURE OF THE ON-LINEGENERATOR COHERENCY GROUPINGSCHEMEIn this section some structural aspects of the practical realizationof the on-line scheme are discussed. However, thescheme is still at an early stage of development, and thereforeit should be noted that the case study presented inthe next sections is based on post-processing following adisturbance applied on a network simulation.The most natural choice of structure for the scheme iseither the Wide Area Remote or Wide Area Central asdefined in [7] and illustrated in Fig.1. Obviously combinationsof these two structures are also applicable, althoughin this report we will address the Wide Area Central structure.In order <strong>to</strong> obtain the desired performance for anytype of high performing wide area protection or moni<strong>to</strong>ringsystem, GPS based PMUs represent powerful <strong>to</strong>ols asthey are a good example of equipment that can providetime synchronized wide area speed (frequency) measurements.In addition they can easily be extended <strong>to</strong> provide
Wide Area CentralREMOTELOCATIONREMOTELOCATIONDataacquisitionCENTRALLOCATIONREMOTELOCATIONOrders forcorrectiveactionsREMOTELOCATIONWide Area RemoteREMOTELOCATIONREMOTELOCATIONCENTRALLOCATIONDataacquisitionREMOTELOCATIONOrders forcorrectiveactionsREMOTELOCATIONFig. 1. Wide Area Central and Wide Area Remote structures. In caseof the Wide Area Central structure data acquisition, data processingand orders for corrective actions are all carried out centrally. For theWide Area Remote structure all these actions involve a number ofremote stations exclusively.DFT calculations. Obviously also other equipment providingsynchronized speed measurement and data processingmay be used for the scheme.The choice of genera<strong>to</strong>rs used as sensor locations for thistype of scheme is obviously much dependent on the architectureof the power system. However, for any systemconfiguration it may be suitable <strong>to</strong> locate the data acquisitionunits at a few ”pilot genera<strong>to</strong>rs” in order <strong>to</strong> obtainthe overall system behavior at minimum cost and an appropriatelevel of reliability. For lightly meshed systemswith localised centres of generation and demand an opportunelocation of the units is most often straightforward.However, in case of densely meshed systems with dispersedgeneration and demand an optimal localization may requireextensive contemplation. In [8] and [9] methods have beendeveloped <strong>to</strong> secure optimal sensor/PMU location.For the Wide Area Central design illustrated in Fig.2,synchronized speed measurement is performed at the pilotgenera<strong>to</strong>rs. Based on the speed measurement the DFT coefficientsare calculated locally and continuously sent <strong>to</strong> thecentral location. A vital aspect for the practical implementationis that the speed measurements must be obtained usingidentical algorithms for all remote measurement units.This is <strong>to</strong> ensure consistent real-time synchronized speedmeasurement response during transients. At the central locationthe DFT coefficients are used <strong>to</strong> identify any dominantmode (4)-(5). In case the central data processingdetects an inter-area mode, the genera<strong>to</strong>r coherency (7)for that mode is determined and the appropriate orders forcorrective measures are sent <strong>to</strong> the relevant remote locations.Typically the curative measures initiated by the schememay involve load shedding, genera<strong>to</strong>r rejection, system separationand activation of different FACTS devices. Loadshedding, genera<strong>to</strong>r shedding and system separation arefast and extensive actions which typically are used as (ultimate)measures <strong>to</strong> prevent loss of synchronism. Actionsinvolving FACTS devices are mainly used <strong>to</strong> accelerate thedamping of stable modes but obviously they also contribute<strong>to</strong> the avoidance of loss of synchronism.NOTime synchronizedspeed measurementat pilot genera<strong>to</strong>rsCalculate DFTcoefficients (2)for each genera<strong>to</strong>rSend the timetaggedDFT coefficients (3)<strong>to</strong> the central locationAny dominantinter area modepresent?Eq. (4)-(5)CENTRAL LOCATIONYESREMOTELOCATIONSLaunch thecorrective actionsSend orders for thecorrective actions<strong>to</strong> involved locationsDetermine theappropriatecorrective measuresDetermine thegenera<strong>to</strong>rcoherencybased onthe dominantmode (6)-(7)Fig. 2. The block diagram of the scheme paradigm for the Wide AreaCentral structure. Note that the large box denoted ”Remote Locations”in practise represent multiple remote locations as illustratedin Fig.1.IV. TEST SYSTEMThe test system used here is the 68 bus NPCC networkwhich represents a reduced order model of the New England/NewYork interconnection about 30 years ago. Thesystem involves 16 genera<strong>to</strong>rs where genera<strong>to</strong>rs G13 <strong>to</strong> G16represent large genera<strong>to</strong>r group equivalents. The frequencycontrol is maintained by G1 <strong>to</strong> G9 while G10 <strong>to</strong> G16 are operatedat a constant mechanical <strong>to</strong>rque. In Fig.3 the dashedlines indicate the coherent groups as given by Rogers [10]and the thick lines indicate the weak tie-lines interconnectingthe different regions. <strong>System</strong> parameters used for thesimulations are based on data given in [10].FAULTBG15CG14G16ADG10G11Fig. 3.G12G13G1G2G8Test system <strong>to</strong>pology.G3G5EG4G9G6G7
V. TEST CASEPrior <strong>to</strong> the disturbance all system devices are in operation.Fifteen seconds after the simulation is started apermanent three phase fault occurs on the line indicatedin Fig.3. The line is permanently removed and undampedinter-area oscillations in the range of 0.23 Hz arise as regionA becomes weakly interconnected <strong>to</strong> the remaining regions(Fig.4, Fig.5 and Fig.6).MAGNITUDE [pu]0.30.250.20.150.10.0501.0031.0020.70.60.50.4FREQUENCY [Hz]0.30.20.115202530TIME [s]354045SPEED [pu]1.00110.999Fig. 6. The magnitude of the DFT coefficients for G14 within thefrequency range of inter-area oscillations.0.998161412108GENERATOR [NUMB]64215202530TIME [s]354045unstable 0.23 Hz mode may require some additional timeas compared <strong>to</strong> the example given in Fig.6. Neverthelesswhen the damped modes have attenuated the dominantunstable mode can easily be discriminated.Fig. 4.The speed of all machines.1.002SPEED [pu]1.00110.9990.9980 20 40 60 80 100 120 140 160 180 200TIME [s]1.002SPEED [pu]1.00110.9990.99815 20 25 30 35 40 45TIME [s]Fig. 7. The magnitude of the DFT coefficients for G5 within thefrequency range of inter-area oscillations.Fig. 5. The speed of G14.In addition <strong>to</strong> the undamped inter-area mode twodamped modes are present for some time after the disturbance.For genera<strong>to</strong>rs (e.g G14) which are stronglyinvolved in the undamped mode these additional swingfrequencies will have a minor effect on the detection ofthe dominant mode. However, for genera<strong>to</strong>rs less involvedthese additional inter-area frequencies may slightly complicatethe distinction between the damped and undampedmodes. An example is given in Fig.7 where the magnitudeof the DFT coefficients for G5 is illustrated. As can beobserved from the figure a reliable discrimination of theBy grouping of the angle graphs Fig.8 illustrates thatG14 swings against all other genera<strong>to</strong>rs. Fig.6, Fig.7 andFig.8 are all based on a sampling frequency of 20 Hz and asliding window function corresponding <strong>to</strong> a time segmen<strong>to</strong>f 100 s.VI. DIGITAL SIGNAL PROCESSING METHODSFOR THE GENERATOR COHERENCYDETERMINATIONThe Digital Signal Processing (DSP) requirements for thegenera<strong>to</strong>r grouping scheme introduced in this paper can bedivided in<strong>to</strong> three parts; first the detection and verificationof the dominant inter-area mode, then the phase estimation
ANGLE [rad]10.50−0.5−1−1.5−2−2.5−3−3.515 20 25 30 35 40 45TIME [s]Fig. 8. The phase angles of the 0.23 Hz DFT coefficients for allgenera<strong>to</strong>rs in the case of frequency resolution 0.01 Hz. The dashedline corresponds <strong>to</strong> G14 while solid lines are used for the remaininggenera<strong>to</strong>rs.associated with that mode and finally the stable/unstablenature of the mode(s). An accurate and fast distinctionbetween unstable and stable modes is of particular importancein order <strong>to</strong> obtain successful corrective actions. Insome cases and for certain genera<strong>to</strong>rs more than one modemay initially be present as Fig.7 demonstrates. Obviouslythis behavior complicates the detection process, neverthelessit is important <strong>to</strong> successfully resolve these cases anddistinguish the dominant mode as quick as possible.For optimal performance the DFT coefficients should becontinuously determined with a high frequency resolutionbased on data samples corresponding <strong>to</strong> a very short timesegment i.e a high time resolution. The nature of these highrequirements for the frequency-time resolution is related <strong>to</strong>the necessity of an accurate moni<strong>to</strong>ring of the instant systemstatus as this is essential for the detection and thecurative process. However, according <strong>to</strong> the uncertaintyprinciple [12] a trade-off between frequency and time resolutionmust always be accepted.The simulation in Section V indicates that a long slidingwindow function (i.e each window corresponds <strong>to</strong> a datasegment involving a long time period) with its detailed frequencyresolution is appropriate for the phase calculationand also for the visual discrimination of a dominant frequencymode. However in order <strong>to</strong> track mode shifts andobtain the stable/unstable nature of the modes (or in casethe frequency estimates are used as control parameters) thetime resolution engendered by a long window function maybe insufficient. Still for discernment of adjacent multiplemodes a high frequency resolution is required, as a poor frequencyresolution may lead <strong>to</strong> a shift of the resulting spectralpeak(s). A number of conventional methods providedin the MATLAB SIGNAL PROCESSING TOOLBOX havebeen tested for the detection of the dominant inter-areamode using different window functions. The methods involveclassical FFT, non-parametric, parametric and subspacebased methods. Additionally a couple of adaptivefilter algorithms have also been examined. Apart from Esprit[13] and Pisarenko [13] all other methods are describedin MATLAB HELP [14] where further references also areprovided.For the evaluation of the different methods the speedsignal of G14 was chosen; Fig.5. The signal contains featuresthat the speed signal typically may involve in caseof inter-area modes. For example, damped low frequencytransients associated with the frequency control and theobvious undamped inter-area oscillations.In accordance with realized Wide Area <strong>Protection</strong> applications[7] 20 Hz was used as the sampling frequency.Different sampling frequencies have been tested, showingnegligible improvement of the performance. Two maintypes of rectangular window functions were used for theinvestigation; the sliding function, where a fixed numberof time samples are windowed and supplied <strong>to</strong> the DSPalgorithm and the evolving function, where an increasingnumber of time samples are supplied <strong>to</strong> the DSP algorithm.The sliding window function is continuously in operationindependently of the present power system status while theevolving window function is started in the case of a possibledisturbance only. Furthermore the sliding window functionswere shifted two samples at the time and thus thefrequency components were updated every 100 ms whilethe evolving functions were updated for each sample.The definition of detection is here that the dominant frequencycomponent must posses a value at least 5% abovethe second largest component in order <strong>to</strong> be detectable.However cases where there are two or three adjacent componentswhich are closely tied <strong>to</strong>gether and strongly deviatingfrom the remaining modes have also been treatedas detectable at the point where all the immediate modesposses a value larger than 105% of the mode with the nextlargest magnitude. Moreover and in order <strong>to</strong> obtain a reliabledetection the pick-up value must maintain the 5%margin with respect <strong>to</strong> the other modes for a time delaycorresponding <strong>to</strong> 300 ms. Initially a time delay of 100 mswas applied, however occasional peaks for some methods inthe initial transient stage led <strong>to</strong> an unreliable detection processfor this time delay. In case the margin is lost before thetime delay has expired, the timer associated with the pickupvalue is reset. Initially a frequency resolution of 0.01 Hzwas adopted for all methods. The detection times for thedifferent methods are summarized in Table.I. Also a slidingwindow function corresponding <strong>to</strong> a data segment of 1 swas applied on each method, without useful results though.The most encouraging results were obtained for the parametricmethods where the covariance method showed thebest performance.The main concern in the case of parametric methods isthe requirement of appropriate system modelling. Here anextensive number of model orders were tested involving ordersof 1 <strong>to</strong> 200. The same test range was also used for subspacebased methods. The values presented in Table.I allcorrespond <strong>to</strong> the model order or subspace dimension givingthe best performance for the associated method. Unex-
pectedly many methods worked best for fairly large ordersand dimensions.Sliding window functions using a short data segmentproved <strong>to</strong> be less reliable according <strong>to</strong> their ”peaky” character,although they sometimes provide faster detection.In case of sliding window functions the computational requirementsfor the subspace based methods were in generalmore extensive than for the remaining methods.TABLE IDetection times, t data segment , in the case of frequency resolution 0.01Hz for window functions corresponding <strong>to</strong> data segments of 100 s, 50 s,10 s and 5 s, respectively. In addition the detection times, t evol , forevolving functions are also presented. Note that the detection timecorresponds <strong>to</strong> the simulation running time at the moment of detection.For ”-” no successful detection was obtained.Method t 100 t 50 t 10 t 5 t evol[s] [s] [s] [s] [s]FFT 36.6 36.6 - - 36.2Chirp 37.1 37.1 - - 36.7Periodogram 32.3 32.3 - - 29.9Welch 32.5 34.2 - - 33.1Multitaper 32.4 32.4 - - -Yule-Walker 26.0 26.0 25.9 - 25.6Burg 25.3 25.3 23.0 - 23.9Covariance 23.5 23.5 23.9 22.9 20.4Modified Covariance 24.8 24.8 24.6 22.0 21.3Peig 23.8 23.8 23.4 - 22.3MUSIC 42.5 35.4 - - 22.4Pisarenko - - - - -Steiglitz-McBride 27.2 25.3 23.6 - 22.6Prony 105.8 55.8 23.4 - 23.0Esprit 42.5 42.8 45.0 - 42.7Adaptive filters are self-learning applications whose filtercoefficients adjust themselves in order <strong>to</strong> obtain optimalperformance. Here the linear prediction sample bysample method was applied and the adaptive filters examinedinvolve a Kalman algorithm, a Recursive Least Square(RLS) algorithm and several Least Mean Squares (LMS)algorithms [14]. To obtain the foremost filter performanceextensive parameter tuning was performed in order <strong>to</strong> encirclethe appropriate parameter values. One observationmade indicated that the adaptive filters generated verybroad spectra in case of high sampling frequency. Thus<strong>to</strong> facilitate the detection process the sampling frequencywas reduced from 20 Hz <strong>to</strong> 2 Hz.The shortest detection times obtained for the frequencyresolutions 0.01 Hz and 0.1 Hz are presented in Table.II(the 0.1 Hz resolution is further discussed in section IX).Generally the adaptive filters perform worse than parametricmethods but similar or slightly worse than nonparametricmethods. In general the foremost performanceis obtained for a certain model order and is unimprovedalthough the model order is increased. Thus the modelorders given in Table.II correspond <strong>to</strong> the lowest possiblemodel order supporting the presented detection times.In the case of the RLS method and frequency resolution0.01 Hz the forgetting fac<strong>to</strong>r 0.9 gave the best performancewhile the forgetting fac<strong>to</strong>r value 1 (infinite memory)turned out <strong>to</strong> be best for the 0.1 Hz resolution. Moreoverthe results given for the Kalman filter is obtained for themeasurement noise variance 0.2 and the process noise covariance0.01.TABLE IIDetection times, t det , in case of frequency resolutions 0.1 Hz and 0.01Hz for adaptive filter algorithms. For the 0.01 Hz resolution only thepick-up of the 0.23 Hz mode is given while the pick-ups for both the 0.2Hz and 0.3 Hz (within brackets) modes are given for the 0.1 Hzresolution. Note that the detection time corresponds <strong>to</strong> the simulationrunning time at the moment of the detection and that ”-” corresponds<strong>to</strong> no pick-up or absence of associated parameter use.Method Model Step t det t de<strong>to</strong>rder size [s] [s]0.1 Hz res./ 0.1 Hz 0.01 Hz0.01 Hz res. res. res.LMS 15/53 0.05 21.5(18.5) 44.5NormalizedLMS8/78 5 · 10 −5 -(20.0) 55.5Sign-dataLMS11/41 0.05 21.0(18.0) 36.0Sign-errorLMS10/40 0.005 21.5(18.5) 38.0Sign-signLMS10/48 5 · 10 −5 21.0(18.0) 41.0RLS 15/40 - 21.5(18.5) 38.0Kalman 13/53 - 21.5(18.5) 42.5VII. OPERATING SCHEME FOR GENERATORCOHERENCY DETERMINATIONReferring <strong>to</strong> the investigation above no method alone succeeded<strong>to</strong> provide a satisfac<strong>to</strong>ry time-frequency resolution.The adopted frequency resolution was adequate while theresulting time resolution was insufficient. The most promisingphase estimations were obtained for long sliding windowfunctions; compare Fig.8, Fig.11, Fig.12 and Fig.13.However by using the long window function the instantaneousbehavior of the speed deviation is unrevealed. Thisis unacceptable both for the verification of the dominantmode and also for the understanding of its unstable/stablenature. Thus an approach involving three different windowfunctions is proposed. First the window function associatedwith the detection and verification of the dominant mode,then the long window function used for the coherency determinationand finally the sliding Fast Fourier Transform(FFT) window with a length corresponding <strong>to</strong> the dominantmode and used <strong>to</strong> track the instantaneous natureof the dominant mode. The proposed algorithm for theDSP process at the central location in Fig.2 is illustratedin Fig.9. Apart from the framed sections which involve datafrom all genera<strong>to</strong>rs the algorithm should be continuouslyexecuted for all genera<strong>to</strong>rs in parallel.The algorithm is continuously supplied with the mostrecent updates of the coefficients c k,1 , . . . , c k,i , . . . , c k,n−1reflecting the speed deviation. First the algorithmdistinguishes any dominant mode in the sectionSEARCH FOR DOMINANT MODE. This task is carriedout by identifying the mode with the largest magnitudec k,dom and then evaluating if c k,dom has a magnitude whichis K pick−up times larger than the mode occupying the secondlargest magnitude. In Fig.9 the magnitude of c k,dom
Fig. 9. The generic code for the DSP process at the Central locationin Fig.2.is denoted A k,dom . To avoid pick-up due <strong>to</strong> measurementdis<strong>to</strong>rtion or load variations an additional verificationof A k,dom is carried out with respect <strong>to</strong> A pick−up whereA pick−up is defined in Section II. When the criteria are fulfilledthe pick-up timer is started at the instant t start,upand in case A k,dom remains above the pick-up values duringa time period of t delay,up the algorithm concludes thata dominant mode is present for the addressed genera<strong>to</strong>r(see CONFIRM DOMINANT MODE). In case a dominantmode is detected for one genera<strong>to</strong>r a verification is requiredwith respect <strong>to</strong> the remaining genera<strong>to</strong>rs, i.e the mode mustbe present for a minimum number of machines before thedominant mode can be completely established (and the algorithmcan proceed <strong>to</strong> DOMINANT MODE PRESENT).Typically a short sliding window <strong>to</strong>gether with a parametricmethod can be used for the detection of the dominantmode. The parameter t k corresponds <strong>to</strong> the current runningtime. Note that all quantities with the subscript kare continuously updated as the real-time data reach thealgorithm.When the dominant mode has been identified threeparallel processes must be carried out as given in thesection DOMINANT MODE PRESENT. Those processesembrace the coherency determination based on the dominantmode (6)-(7), the knowledge of the instantaneous behaviorof the dominant mode (the FFT window) and thelong term verification of the dominant mode (controlled bythe while statement and the DROP DOWN TIMER).In order <strong>to</strong> obtain the instantaneous nature of the magnitudeof the inter-area mode the speed deviation is bandpassfiltered and then a sliding FFT window applying thedominant mode c k,dom as its fundamental is started. Obviouslythis window cannot be started until the dominantmode is distinguished. However, once this is accomplishedthe most recent data segment corresponding <strong>to</strong> that fundamentalmode is used <strong>to</strong> obtain the instantaneous behavior.To establish the stable/unstable nature of the currentmode the rate of change of the fundamental modeof the FFT window d|c F UNDAMENT AL,F F T W INDOW |/dtis determined. In case the rate of change is positive themagnitude of the mode is of an increasing nature and themode is unstable while for a negative rate of change themode is damped. Strictly theoretical the approach basedon the FFT window <strong>to</strong> obtain the instantaneous behaviorof the mode is dubious as by definition the FFT method isvalid for stationary signals only. However, the method hasproven <strong>to</strong> be applicable also here and was therefore cus<strong>to</strong>mized.Alternatively, in the case of limited confidencein the FFT method, the method can be replaced by anintegra<strong>to</strong>r determining the RMS value based on the datasegment corresponding <strong>to</strong> the cycle time of the dominantmode c k,dom .In case the speed deviation is unfiltered the low frequencymodes will affect the determination associated with the instantaneousbehavior of the signal. This is true both for theFFT and the RMS methods. For example, for the speed deviationof G14 the frequency components below 0.1 Hz willsignificantly reduce the availability of the methods while inthe case of the filtered signal the performance is completelysatisfac<strong>to</strong>ry. Fig.10 illustrates the instantaneous behaviorof the test signal generated by the adapted FFT windowfunction and the RMS computation, respectively. Here aChebyshev Infinite Impulse Response filter of order 10 wasused for the bandpass filtering.Based on data from all genera<strong>to</strong>rs the coherency determinationis performed in the lower box in Fig.9. Firstthe phase estimation (6) is carried out for each genera<strong>to</strong>r’sspeed signal based on a long sliding window functionapplying conventional Fast Fourier Transform. Then thecoherency is established according <strong>to</strong> (7) and as a nextstep the curative actions are determined based on both thecoherency and the stable/unstable nature of the mode.In addition <strong>to</strong> the two processes described above a continuousverification of the dominant mode must be performedin order <strong>to</strong> assure the appropriate input modes <strong>to</strong>the two other processes. The verification is based on thesame window function as the detection. In Fig.9 this verificationis accomplished by the logic while statement andthe DROP DOWN TIMER. The dominant mode is continuouslymoni<strong>to</strong>red <strong>to</strong> confirm its superior status. In order<strong>to</strong> give up its supervising function the mode must re-
main below any of the levels K pick−up times the secondlargest mode or A pick−up during a time period of at leastt delay,down . In addition a continuous mode verification withrespect <strong>to</strong> the other genera<strong>to</strong>rs is executed which also candismiss the dominant mode.Here we have chosen separate timers for the pick-up anddrop down of the dominate mode. The background for thisapproach is <strong>to</strong> ensure the drop down of the present modebefore the pick-up of the new mode in case of gradual modeshifts. However, only one timer may be applied for this process;i.e immediately after the drop down of one dominantmode and in case of a new mode that is K pick−up largerthan the second largest mode, the new dominant mode isimmediately established as a dominant mode. The newdominant mode will then immediately be used <strong>to</strong> establishgenera<strong>to</strong>r coherency and corrective actions. Practically thisis a matter of design where the most appropriate approachfor the given implementation should be adopted.For the evaluation of the different DSP methods in SectionVI, K pick−up and t delay,up were given the values 1.05and 300 ms, respectively. Furthermore, for the generic codegiven in Fig.9 strictly one mode must contain a value largerthan K pick−up times the magnitude of all the remainingmodes during the whole process. Alternatively, at leas<strong>to</strong>ne but up <strong>to</strong> two or three adjacent modes which all clearlydeviate from the other remaining modes may also be an appropriateindica<strong>to</strong>r of a dominant mode as the oscillationmay arise as multiple adjacent modes due <strong>to</strong> leakage. Simulationshave indicated that the phase of the adjacent modesare similar and thus any of the adjacent modes is feasiblefor the genera<strong>to</strong>r grouping. Thus in case of an approachaccepting two adjacent modes, any mode may be used forthe phase calculation where the mode occupying the largestmagnitude is probably the most immediate choice, while forthe three mode approach the most natural concept is <strong>to</strong> determinethe phase for the mode in the middle. Obviouslythis is a design option where the single mode approach hasbeen adopted in Fig.9 while the three mode approach wasapplied for the evaluation of the different DSP methodsabove.VIII. THE PERFORMANCE OF THE SCHEMEHere the SPS concept in Fig.2 is illustrated based on thetest case given in Section V. A central computer is continuouslysupplied with the spectral coefficients reflectingthe speed signals of all system genera<strong>to</strong>rs. The genera<strong>to</strong>rs’coefficients are all processed in parallel on identical replicasof the algorithm in Fig.9. When the algorithm in Fig.9 hasidentified a dominant mode the three parallel processes belowDOMINANT MODE PRESENT are started. In casewe use the 5 s sliding window function <strong>to</strong>gether with thecovariance method for the identification of the dominantmode, the three parallel processes are started about 8.0seconds after the initial three phase fault. In fact G14 isthe first genera<strong>to</strong>r <strong>to</strong> pick-up up and consequently the detectiontime is 7.9 s (Table.I) plus approximately 0.1 s <strong>to</strong>verify that the 0.23 Hz mode is present for all machines.The verification with respect <strong>to</strong> the remaining genera<strong>to</strong>rsMAGNITUDE [pu]10.90.80.70.60.50.40.30.20.1015 20 25 30 35 40 45TIME [s]Fig. 10. The magnitude of the fundamental Fourier coefficient 0.23Hz. Also the ”running” RMS value for time segments corresponding<strong>to</strong> the cycle time of the Fourier coefficient 0.23 Hz is presented. Bothgraphs are determined from the filtered speed deviation of G14. The0.23 Hz mode is illustrated by the plain line while the RMS value isgiven by the dotted line.is based on spectra showing that the mode is present forall units. Note that the mode is present for most machines,but has not yet picked-up with respect <strong>to</strong> the given timeandpick-up levels.When the dominant mode has been established thescheme immediately determines the instantaneous behaviorof the oscillation and the genera<strong>to</strong>r coherency. Fig.8 indicatesthat the coherency is well established by this time.Thus based on these data the appropriate corrective measurescan be carried out.Fig.10 shows that the mode is undamped and Fig.8 indicatesthat G14 is oscillating against the rest of the system.Based on that information genera<strong>to</strong>r rescheduling is performedfor G14 in order <strong>to</strong> reduce the power flow on theremaining line between areas A and D. Consequently theoscillations are attenuated. Throughout the whole processthe while statement in Fig.9 moni<strong>to</strong>rs the superior of the0.23 Hz mode.IX. DISCUSSIONSo far a frequency resolution 0.01 Hz has been appliedthroughout this paper. However, with respect <strong>to</strong> the detectiontime of the dominant mode it may be beneficial <strong>to</strong>use a lower frequency resolution. The same range of modelorders and subspace levels were examined for the 0.1 Hz frequencyresolution (Table.III) as for the 0.01 Hz resolution(Table. I). Furthermore, both the pick-up times for the 0.2Hz and 0.3 Hz modes are given in Table.III as the 0.23 Hzmode is located in between. For all cases the 0.2 Hz modemore or less becomes the dominant mode, although the0.3 Hz components often give the fastest pick-up times. Ingeneral more spurious pick-ups were registered in the caseof reduced frequency resolution.Reduced frequency resolution results in an obstacle, asa less reliable value is obtained for the length of the FFT
window in Fig.9 determining the instantaneous behaviorof the speed deviation. Moreover, when Fig.8 is collated<strong>to</strong> Fig.11, Fig.12 and Fig.13 the relation between reducedfrequency resolution and the phase estimation can easily beobserved. In case of the reduced resolution the angles of theDFT coefficients vary substantially more, in contrast <strong>to</strong> thecase for the better resolution. Obviously, more pronouncedangle variation will lead <strong>to</strong> less reliable genera<strong>to</strong>r coherencydetermination.TABLE IIIDetection times, t data segment , in case of frequency resolution 0.1 Hzfor window functions corresponding <strong>to</strong> data segments of 10 s, 5 s and 1s, respectively. In addition the detection times, t evol , for evolvingfunctions are also presented. Note that the detection time corresponds<strong>to</strong> the simulation running time at the moment of detection and that thefirst number corresponds <strong>to</strong> the pick-up time of the 0.2 Hz mode whilethe number in brackets is the pick-up time for the 0.3 Hz mode. For ”-”no successful detection was obtained.ANGLE [rad]10−1−2−3−4−515 20 25 30 35 40 45TIME [s]Fig. 12. The phase of the 0.3 Hz mode for frequency resolution 0.1Hz. The phase of G14 is indicated by the thick dashed line.Method t 10 t 5 t 1 t evol[s] [s] [s] [s]FFT 21.6(18.8) 21.4(18.8) -(-) 21.2(18.4)Chirp 21.9(19.0) 21.8(19.0) -(-) 21.6(18.6)Periodogram 21.5(18.6) 21.2(18.6) -(-) 21.1(17.1)Welch 22.8(19.0) -(-) -(-) 21.6(18.3)Multitaper 21.6(18.8) 21.1(-) -(-) 20.7(24.6)Yule-Walker 19.1(20.0) 20.8(-) -(-) 20.7(17.5)Burg 18.7(19.5) 18.8(19.6) -(-) 20.1(-)Covariance 20.7(19.8) 20.4(18.5) 20.1(16.8) 18.3(18.7)ModifiedCovariance20.7(-) 20.7(18.6) 18.3(17.1) 20.3(-)Peig 21.0(19.6) 20.6(18.7) -(-) 20.0(16.4)MUSIC 21.6(19.0) -(-) -(-) 19.9(16.1)Pisarenko -(-) -(-) -(-) 18.3(-)Steiglitz-McBride21.6(18.8) 21.1(30.5) 20.1(16.7) 21.1(16.0)Prony 21.6(18.8) 20.5(25.7) -(-) 20.1(16.3)However, as mentioned above and as indicated in Fig.13this approach will obviously suffer from the reduced frequencyresolution and consequently generate a less reliablegenera<strong>to</strong>r coherency.ANGLE [rad]10−1−2−31−4ANGLE [rad]0−1−2−3−4−515 20 25 30 35 40 45TIME [s]Fig. 11. The phase of the 0.2 Hz mode in the case of frequencyresolution 0.1 Hz. The phase of G14 is indicated by the thick dashedline.In order <strong>to</strong> reduce the design complexity, the same FFTwindow as is used for the computation of the instantaneousbehavior of the signal can be used for the phase estimation.15 20 25 30 35 40 45TIME [s]Fig. 13. The phase of the 0.23 Hz mode for all genera<strong>to</strong>rs in the caseof frequency resolution 0.23 Hz. The phase of G14 is indicated by thedashed line.Here both sliding and evolving window functions havebeen investigated. There are advantages and disadvantagesassociated <strong>to</strong> both approaches. For example, immediatelyafter the disturbance, the sliding window function will besubject <strong>to</strong> obsolete data. The same is true for an evolvingfunction some time after the initial disturbance in the caseof contingencies involving altering system conditions. Obviouslythe phenomenon may impair the distinction processof the dominant mode. The main obstacle for the evolvingwindow function is the trigger required <strong>to</strong> (re)start thewindow at the appropriate moment in order <strong>to</strong> include therelevant data only. Conventionally, the trigger could bebased on a pick-up level associated <strong>to</strong> any power quantity
or the voltage. However, cases involving altering systemconditions cannot be resolved easily by this approach.Obviously, the ultimate challenge for the scheme introducedhere involves changing system conditions at analready critical operating point. For example, a disturbanceoccurs and an associated group coherency is obtained.Next a subsequent disturbance again leads <strong>to</strong> amodified grid configuration which in turn may correspond<strong>to</strong> a new genera<strong>to</strong>r coherency. In order <strong>to</strong> handle this situation,a DSP method with a high frequency- and timeresolution is required. Similarly, in the case of emergencysituations involving cascading outages, the same requirementsare true for the DSP applications. The conceptproposed here should support these scenarios. The mostcrucial part may be the phase estimation based on a longsliding window as obsolete data will affect the current determinationof the DFT coefficients. However, as the dominantmode transits from one oscillation frequency <strong>to</strong> another,only the most recent data will define the phase forthe new mode as no previous data can be associated withthat new mode. Thus, the long sliding window will alsoprovide a reliable <strong>to</strong>ol for the phase estimation in the caseof inter-area mode transitions. A transition from one mode<strong>to</strong> another and then back <strong>to</strong> the original mode may lead <strong>to</strong>difficulties generating the appropriate genera<strong>to</strong>r coherency,as data related <strong>to</strong> the first appearance of the mode willalso affect the phase estimation the second time the modearises. However, the likelihood for such a scenario is verylow, in particular that the same mode would occur twiceand involve different phase compositions.According <strong>to</strong> [3] pronounced multiple modes appear onlyfor genera<strong>to</strong>rs which are involved in the oscillations <strong>to</strong> avery limited extent. For the scheme proposed here, the centralgenera<strong>to</strong>r coherency determination based on the phaseof the dominant mode is exclusively carried out for themode involving all the genera<strong>to</strong>rs affected by inter-area oscillations.By that approach examination of the relevantmode is guaranteed. Genera<strong>to</strong>rs which are uninvolved inthe crucial inter-area mode are left out of the coherencyinvestigation as their grouping affiliation must be postdeterminedin order <strong>to</strong> avoid subsequent inter-area modesresulting from corrective measures changing the networkconfiguration. Referring <strong>to</strong> Fig.7 the leakage is especiallycrucial for cases were multiple modes are involved. However,when the approach given above is applied for multiplemodes the associated leakage can be ignored as the mode isanyhow present, with a less developed magnitude though.X. CONCLUSIONSThis paper introduces a new concept for a <strong>System</strong> <strong>Protection</strong>Scheme addressing inter-area oscillation events. Todetermine genera<strong>to</strong>r coherency a method is used based onspeed measurements combined with DFT analysis. A numberof well established Digital Signal Processing methodshave been investigated in order <strong>to</strong> evaluate their schemesuitability. For the detection of inter-area modes, parametricmethods turned out <strong>to</strong> be the most feasible. Bothevolving and sliding window functions have been investigated.Evolving functions generally detect the dominantmode somewhat faster than sliding functions. However,evolving windows require a trigger activated by the presenceof an inter-area mode. This trigger may complicatethe design of the scheme and thus the design proposed hereis based on a sliding window.The scheme proposed here must be fast. To shorten thedetection time of the dominant mode, a reduced frequencyresolution can be applied. However, a lower frequency resolutioncontributes <strong>to</strong> spectral mode shifts and reduces thequality of the estimate of the instantaneous speed deviation.As a result the discrimination of the unstable/stablenature of the modes is of a lower quality. Also the phaseestimation deteriorates which in turn leads <strong>to</strong> a less reliablegenera<strong>to</strong>r coherency determination. The design proposedhere is therefore based on a high frequency resolution, acceptinga somewhat slower response.The scheme is still at an early stage of development,where the case study used for the analysis in this paper isbased on post-processing following a disturbance appliedon a network simulation. The next step for implementationshould address practical issues supporting real-timeoperation.AcknowledgmentsThe authors would like <strong>to</strong> thank Svenska Kraftnät for theirinterest in this research area and for their financial support.The authors also would like <strong>to</strong> thank ABB <strong>Power</strong> <strong>System</strong>sfor providing Simpow. Graham Rogers is acknowledgedfor his help related <strong>to</strong> the test system. Professor James H.McClellan, Professor Mats Viberg and Associate ProfessorIrene Gu are all acknowledged for their help associated <strong>to</strong>the DSP part. Mattias Jonsson would like <strong>to</strong> express hissincere gratitude <strong>to</strong> Professor Miroslav Begovic for acceptinghim as a visiting scholar in his group during the springand summer of the year 2002.References[1] Wide Area <strong>Protection</strong> seminar, Real-Time Moni<strong>to</strong>ring of FastDynamic in the Swedish National Grid (Fast RTMS), Presentationby Svenska Kraftnät, Västerås, Sweden, April 2, 2001.[2] Hiskens I.A, Akke M, Analysis of the Nordel <strong>Power</strong> Grid Disturbanceof January 1, 1997 Using Trajec<strong>to</strong>ry Sensitivities, IEEETransactions on <strong>Power</strong> <strong>System</strong>s, Vol. 14, No. 3, August 1999, pp.987 - 993.[3] Jonsson M, Begovic M, Daalder J, A new method suitable forreal time genera<strong>to</strong>r coherency determination, Submitted <strong>to</strong> IEEETransactions on <strong>Power</strong> <strong>System</strong>s.[4] Begovic M, Djuric P, Dunlap S, Phadke A, Frequency Trackingin <strong>Power</strong> Networks in the Presence of Harmonics, IEEE Transactionson <strong>Power</strong> Delivery, Vol. 8, No. 2, April 1993, pp. 480 -486.[5] Djuric P, Begovic M, Adaptive Estimation of Frequency in <strong>Power</strong>Networks, Proceedings of 1992 International Symposium on Circuitsand <strong>System</strong>s (ISCAS), San Diego, CA, USA, May 1992, pp.1024 - 1027.[6] Oppenheim A.V, Schafer R.W, Discrete-Time Signal Processing,2nd ed, ISBN: 0-13-216292-X, Prentice Hall, 1989.[7] Jonsson M, Present Status of <strong>System</strong> <strong>Protection</strong> Schemes, Tech.Report 23R, ISSN 1401-6176, Chalmers University of Technology,Gothenburg, Sweden, 2002.[8] Sadegh P, Spall J.C, Optimal sensor configuration for complexsystems, Proceedings of the 1998 American Control Conference,Philadelphia, PA, USA, June 23 - 26, 1998, pp. 3575 - 3579.
[9] Milosovic B, Begovic M, Nondominated Sorting Genetic Algorithmfor Optimal Phasor Measurement Placement, IEEE Transactionson <strong>Power</strong> <strong>System</strong>s, Vol. 18, No. 1, Feb. 2003, pp. 69 - 75.[10] Graham Rogers, <strong>Power</strong> <strong>System</strong> Oscillations, ISBN: 0-7923-7712-5, Kluwer Academic Publisher, 2000.[11] Fankhauser H.R, Aneros K, A-A Edris. and Torseng S, AdvancedSimulation Techniques for the Analysis of <strong>Power</strong> <strong>System</strong>Dynamics, IEEE Computer Applications in <strong>Power</strong>, Vol. 3, No. 4,Oc<strong>to</strong>ber 1990, pp. 31 - 36.[12] Qian S, Chen D, Joint time-frequency analysis - methods andapplications, ISBN: 0-13-254384-2, Prentice-Hall, 1996.[13] Proakis J.G, Manolakis D.G, Digital signal processing - principles,algorithms, and applications, third edition, ISBN: 0-13-394338-9, Prentice-Hall, 1996.[14] Matlab Help, Version 6.1.0.450, Release 12.1 , The MathWorksInc , 2001.Mattias Jonsson received his M. Sc. and Lic.Eng from ChalmersUniversity of Technology in 1998 and 2001, respectively. His interestlies in power system stability and power system protection. At presenthe works <strong>to</strong>wards a Ph.D. thesis.Jaap Daalder obtained his Ph.D in power engineering from theEindhoven University of Technology, The Netherlands. He workedthere as an Associate Professor until 1984 when he left for Norway<strong>to</strong> become a Direc<strong>to</strong>r of Technology and Member of the Board of asubsidiary of the Brown Boveri Company, nowadays ABB. In 1993 hewas appointed as full Professor at Chalmers University of Technology.Since 1997 he is heading the Department of Electric <strong>Power</strong> Engineering.His areas of interest are power systems and environmental issuesrelated <strong>to</strong> power engineering.Miroslav Begovic (S’87, M’89, SM’92) is Associate Professor in theSchool of ECE, Georgia Institute of Technology in Atlanta, Georgia.His interests are in the general area of computer applications in powersystem moni<strong>to</strong>ring, protection and control, and design and analysisof renewable energy sources. Dr. Begovic chairs the Working Group”Wide Area <strong>Protection</strong> and Emergency Control” in the <strong>Power</strong> <strong>System</strong>sRelaying Committee of the IEEE <strong>Power</strong> Engineering Society.Dr. Begovic’s work on distributed generation and pho<strong>to</strong>voltaic (PV)systems has resulted in design of the 340 kW PV system on the roofof the Georgia Tech Aquatic Center, which was the largest of its kindat the time of initial deployment. Dr. Begovic is a Senior Memberof IEEE’s <strong>Power</strong> Engineering, Circuits and <strong>System</strong>s, and ComputerSocieties, and a member of Sigma Xi, Tau Beta Pi, Eta Kappa Nu,and Phi Kappa Phi.
Paper FAn emergency strategy scheme based onconventional distance protection <strong>to</strong> avoidcomplete system collapseM. Jonsson, J. Daalder, K. WalveAccepted forIEEE/PES Transmission and Distribution Conference and Exposition,September 7 - 12, 2003, Dallas, USA.
An Emergency Strategy Scheme Based onConventional Distance <strong>Protection</strong> <strong>to</strong> Avoid Complete<strong>System</strong> CollapseMattias Jonsson, Student member, IEEE, Jaap Daalder and Kenneth WalveAbstract: An emergency protection scheme which prevents a systemcollapse in the case of extreme voltage instability is proposed. Thescheme is based on conventional distance protection.The performance of the scheme was analysed using theNORDIC32 test system. The test case confirms that complete systemcollapse can be prevented when the relevant distance relays aregiven settings according <strong>to</strong> the proposed method. As a result the res<strong>to</strong>rationtime after a power system breakdown can be significantlyreduced.Keywords: Distance protection, Emergency scheme, Voltage collapse,Wide Area <strong>Protection</strong>.I. INTRODUCTIONIn the Swedish electrical power system the main load centresare located in the south region while a significant part of thegeneration is located in the north. The regions are separatedby hundreds of miles and thus the Swedish bulk power systeminvolves large power transfers over long distances. Deregulationresulting in the decommission of (small) power plants inthe south part of Sweden has further enhanced the radialsystem characteristic of the system. The possibilities for localgenera<strong>to</strong>r support in the case of power system instability haveobviously been reduced and local reactive supply in the caseof voltage instability has deteriorated. In addition anincreased variation of power flow directions has been experiencedduring recent years. Experience has shown that voltagecollapse is restricted <strong>to</strong> the southern regions. However, withrespect <strong>to</strong> the new situation, there is an enhanced risk that acontingency in the southern part will propagate further northaffecting an increasing portion of the system. The main concernassociated with this scenario obviously is a completesystem collapse following an extensive res<strong>to</strong>ration time.Much time can be saved by maintaining the voltage in somepart(s) of the system and thereby keeping some genera<strong>to</strong>rsThis work was financially supported by Svenska Kraftnät.Mattias Jonsson and Jaap Daalder are both with the Department of Electric<strong>Power</strong> Engineering, Chalmers University of Technology, 412 96 Gothenburg,Sweden. Their e-mail addresses are mattias.jonsson@elteknik.chalmers.seand jaap.daalder@elteknik.chalmers.se. Kenneth Walve is with SvenskaKraftnät and his e-mail address is kenneth.walve@svk.sesynchronized. Here we introduce an emergency schemeavoiding complete system collapse as a result of voltageinstability. The scheme represents the ultimate “last callaction“ and should exclusively be activated when system stabilitycannot be maintained by any other conventional measure.II. THE EMERGENCY SCHEMEThe scheme is based on a strategy where the purpose is <strong>to</strong>maintain voltage stability in a part of the system in order <strong>to</strong>avoid a complete system breakdown. It should only operatefor situations where there is no other way <strong>to</strong> maintain voltagestability within the complete system by any other means.Hence the scheme is primarily intended for extreme contingencies.The scheme is based upon conventional Zone 3 distancerelays and can have a varying degree of sophistication; e.gstand alone or be a part of an extensive protection strategyincluding communication equipment. However, in its basicform only local data are utilized and the scheme will functionalso in emergency situations, where for example communicationlinks are out of service.In the case of voltage instability lower voltages andincreased (reactive) power flows will lead <strong>to</strong> a reduced apparentimpedance as seen by the distance protection. The functionof the scheme is obtained by assigning the Zone 3distance relays for all lines associated <strong>to</strong> the intersectionbetween the region <strong>to</strong> be saved, and the remaining system,settings corresponding <strong>to</strong> the operating point “system beyondrecovery“. In the case of an irrevocable collapse the trippingzones for these distance relays are entered. As a result thescheme separates the system part <strong>to</strong> be saved and a stableoperating condition can be established. The separation issimply carried out by tripping the lines interconnecting theregion <strong>to</strong> be saved from the surrounding system. Obviously,the region where stable voltage is secured must be carefullychosen with respect <strong>to</strong> reliable island operation at the sametime as the objective should be <strong>to</strong> minimize the breakdown
∑∑area. The scheme is <strong>to</strong> a certain extent similar <strong>to</strong> out-of-stepprocedures involving system separation, although the schemeproposed here is addressing voltage instability.III. THE SETTINGS OF THE DISTANCE RELAYSThe aim is <strong>to</strong> identify the appropriate settings for the Zone 3distance relays for the transfer section intended for systemseparation. The main challenge is <strong>to</strong> accurately determine ifthe system is operating beyond recovery, and then <strong>to</strong> identifythe corresponding apparent impedances as seen by the relays.The setting process for the distance relays is given in Fig. 1.First all lines of the transfer section are assumed <strong>to</strong> be in service(BLOCK 1) and their <strong>to</strong>tal line equivalent is established(BLOCK 2). Next the power injected in<strong>to</strong> the interconnectionis determined for all relevant operating conditions (BLOCK3). Lines are modelled as π-equivalents in ARISTO [1] (whichis used for our illustration in section IV) and therefore a techniquebased on the PV-curve is adopted in order <strong>to</strong> examinethe relevant operating conditions (BLOCK 3b). However,more full scale static and dynamic investigations may berequired in case of more complicated systems. In BLOCK 3ball stable operating conditions are investigated by examiningall possible combinations of relevant sending end voltages,V send,a , and receiving end voltages, V rec,j , for the line equivalent.Based on system experience of the test system, theinjected- and received reactive powers associated <strong>to</strong> the transfersection have been given the value zero. In case thisassumption cannot be adopted, the reactive powers must be anon-fixed variable for the investigation; i.e Q rec is variedbetween the possible maximum (Q max ) and minimum (Q min )reactive power levels.The equation (5) is solved with respect <strong>to</strong> the receivedactive power P rec and under the condition given in (6). The αand β variables are defined by (7) - (9). As a next step the correspondinginjected power, P injected,a , is determined based onloss-summation (10)-(11). The process (5)-(11) is executedfor all possible operating conditions V send,a and V rec,j , wherethe resulting powers P injected,a are organized in<strong>to</strong> the matrixP injected,i . In order <strong>to</strong> determine the relevant operating impedancesalso the corresponding sending end voltage matrixV send is established. When all possible active powers <strong>to</strong> beinjected in<strong>to</strong> the transfer section, P injected,i , have been determinedthey are used <strong>to</strong>gether with their corresponding sendingend voltages V send <strong>to</strong> identify the apparent impedance identifyingthe operating point “system beyond recovery” (BLOCK4). Obviously this condition is identified by the smallest possibleapparent impedance resulting from the square of thesending end voltage divided by the sending end power (12). In(12) a value ε is subtracted from the smallest apparent impedancein order <strong>to</strong> assure settings corresponding <strong>to</strong> unstableoperation. As the minimum value resulting from the divisionin (12) in fact represents the smallest impedance possible forstable operation. The relay setting for the transfer section configurationis determined in (13).As a next step one line is removed from the transfer section(BLOCK 6) and the same calculations are carried out for thenew section configuration (BLOCK 2 - BLOCK 4). Duringthis process, always the longest line (largest impedance) isremoved since the scheme should NOT operate for a stableoperating condition and priority is given <strong>to</strong> security. Finally,when the calculations are performed for all possible operatingconditions and for all transfer section configurations, the settingfor the Zone 3 relays, R 3,set , is chosen (BLOCK 7). Theminimum value is selected since no possible stable conditionshould lead <strong>to</strong> tripping of the transfer section.Remove the longest linei=i+1BLOCK 6All lines in operationi=1Lump all present lines in<strong>to</strong> an equivalent:1 1(1) =Zeq , i present lines Zlineimpedance(2) B = B{ Zeq i}{ Zeq i}Determine P injected,a for all relevant operating conditions:Method applied here:∀ V ≤V ≤V , V ≤V ≤ V , Q = 0,min , ,max ,min , ,maxsend send a send rec rec j rec rec(5) V − α +2α − β = 0rec,j(6)2α − β ≥ 0(7)2Vsend , aα =2−( R ⋅ Prec + X ⋅Q′rec)eq , i eq,i(8) β = Z ⋅ ( Prec 2+ Q′rec)2 2eq , i(9) Q′ rec= Q − B2⋅Vrec rec eq, i , j(10)R∆ P =V( Pre2+ Q′rec)eq,i 22 crec(11) Pinjected , a= Prec+ ∆PBLOCK 3bCreate the matrix Vsendbased on all investigated operating conditions Vsend,aand the matrix Pinjected,ifor all corresponding powers Pinjected,a:BLOCK 3⎧⎫⎪⎪⎨⎬⎪⎪⎩⎭Determine the relation between the smallest possible operatingimpedance and the line impedance:(12)2VsendRlimit,i= min −εPinjected,iwhere ε is an infinitesimal number(13)Rlimit,iR3,i =Zeq,iBLOCK 4YESFig. 1. Flow chart for the setting process. Note that normal variables correspond<strong>to</strong> real numbers while bold variables represent vec<strong>to</strong>rs and matrixes.eq,ipresent lines(3) R = Re(4) X = Imeq, i,eq, i,linesuceptanceMore than oneline remainingNOBLOCK 1BLOCK 2BLOCK 5Decide the resistive reach for the zone 3 relays:BLOCK 7R 3,set = min(R 3,1 ,…,R 3,i ,…,R 3,n )
The same setting R 3,set is used for all lines in order <strong>to</strong> synchronisethe tripping process of all relays. The relays of thelonger lines will reach a bit longer in Ω as compared <strong>to</strong> therelays of the shorter lines but this is compensated by theslightly smaller power flow due <strong>to</strong> the larger line impedance.As a result the tripping will occur at the same time for alllines. Note that the transfer section is considered as a numberof parallel lines, while in reality this assumption is only a fairreflection of the true system. Accordingly, the lines will mostlikely not trip at exactly the same moment. This is of lessimportance but the main issue is that no line should trip incase of stable operation. For an unstable case it is sufficient ifat least one line is tripped as the resulting power re-distributionafter the loss of the first line will accelerate the trippingof the remaining lines.The reactive reach for distance protection is strongly linked<strong>to</strong> fault conditions. In addition <strong>to</strong> the fault resistance the resistivereach has a close relationship <strong>to</strong> normal operation involvingload encroachment. The setting process described hereaddresses only the resistive reach of the distance protection.The selectivity of the protection system is thereby secured asthe resistive settings given by this method will not affect thefault clearing with respect <strong>to</strong> distance but only with respect <strong>to</strong>fault resistance.IV. TEST CASEThe simulation used <strong>to</strong> illustrate the protection scheme wasperformed in ARISTIO [1] and the NORDIC32 system [2]displayed in Fig. 2 was applied as the test system. TheNORDIC32 network represents a test system with similardynamic behaviour as the Swedish bulk power system. Thesystem involves large power transfers from the Northernhydro dominated regions <strong>to</strong> the main load centres in the Centraland SouthWest areas. The generation in the Central andSouthWest regions is mainly based on thermal power.Two test scenarios are given in [2]; a peak load scenariowhere the n-1 design criteria are completely assured, and anextreme (but possible) load condition where almost all n-1contingencies result in acceptable post-contingency conditions.Extensive (simulation based) studies have indicated thatthe maximum power transport from the North region <strong>to</strong>wardsthe Central should be limited <strong>to</strong> about 2850 MW in order <strong>to</strong>sustain any n-1 contingency. For the extreme case given in [2]about 3260 MW is transferred between the two regions. In ourtest case we have a power transport between the two regionsof about 3100 MW immediately before a contingency event islaunched. The increased power transport as compared <strong>to</strong> thepeak load scenario given in [2] is mainly due <strong>to</strong> reduced generation(loss of one unit) in the SouthWest region. At the sametime the spinning reserve in the Central and SouthWestregions are preserved at an acceptable level. Note that in contrast<strong>to</strong> the n-1 contingency illustrated below, most n-1 contingencieslead <strong>to</strong> acceptable post-contingency conditions alsofor a load condition of 3100 MW.FL12AT 121FT 61FL10FT 62FT 63AL3 AT 111AL4AL5AL6AT 131AT 241FL13NorthFL6AL7AL8AL9AL1050 %FT 41AL1AL2CL4CT 12SouthWestCL8CL9CT 22CT 31CL10CL1350 % 40 %CL1CL5Fig. 2. The NORDIC32 test system.The triggering event for the contingency is the permanent lossof one generation unit in station FT63. The unit tripping leads<strong>to</strong> a further increased power transfer over the North-Centralinterconnection. Consequently, a long term voltage collapse isinitiated in the SouthWest and Central regions where the voltagesare continuously decreasing resulting in a propagatingvoltage reduction affecting the Northern regions as well.About 160 s after the initial genera<strong>to</strong>r loss a complete systemblackout is a fact, although au<strong>to</strong>matic schemes involvingshunt switching and load shedding were initiated. The interconnectinglines CL14 and CL15 were never tripped and theNorthern regions were never separated from the remainingsystem. This is one of the main reasons for the completeCL2CL11CL14 CL15 CL16 CL17FL2FL11CT 11CL3RL3RT131RL5 RL6RT133CT 32FT 42RL4FL7RL8RL9FL16FL3FL8CT 2140 %FT 44FT 50RL1RL2FL14CT 71FL1FT 43RL7FL14FL1540 %RT132Geographic schemeNORDIC32TTest system used in theARISTO simula<strong>to</strong>rCL12CentralFL9FT 51NorthEastCL7CL6FT 45FL5FT 47CT 72
system collapse. The original distance protection settings forthe transfer section are given in Table 1.Table 1. Original Zone 3 settings in the resistive direction. The reach of therelay is obtained from the product of the setting fac<strong>to</strong>r R 3 and the linereactance.LineR 3 [pu]CL12 1.1CL14, CL15 0.6CL16, CL17 0.72Next, the distance protection for stations located in the Northregion and associated <strong>to</strong> the North-Central interconnectionwere given settings according <strong>to</strong> the method proposed in sectionIII. First the active powers, P rec , were obtained for allpossible operating conditions (5)-(9). The non-linear equationswere solved by conventional numerical methods and as anext step the relevant settings were determined from (10)-(13). Finally, when the relay settings had been determined forall possible system configurations, the appropriate Zone 3 settingcould be selected. The settings obtained from (13) foreach loop i in the setting process of Fig. 1 are given in Table 2.For illustration also the setting fac<strong>to</strong>rs for the cases where theshortest lines were removed are given. Table 2 confirms thatthe case <strong>to</strong> be used for the relay settings is the one where thelongest lines are removed since the restricting settings arethen obtained.Table 2. Zone 3 setting fac<strong>to</strong>rs for different network configurationsdetermined from (13) in Fig. 1.Number of lines in service between theNorth and Central regions.R 3,i [pu](longest lineremoved)R 3,i [pu](shortest lineremoved)All lines (i=1) 1.0091 1.00914 lines (i=2) 1.0072 1.01053 lines (i=3) 1.0074 1.01322 lines (i=4) 1.0051 1.01531 line (i=5) 1.0056 1.0213For the setting process the voltages were varied in steps of0.01 pu where V min and V max corresponded <strong>to</strong> 0.8 pu and 1.05pu. The max and min values were selected with respect <strong>to</strong> thesettings of the remaining system devices. For example, allGenera<strong>to</strong>r UnderVoltage <strong>Protection</strong> schemes operate at voltagesof 0.82 pu or higher. From Table 2 the setting fac<strong>to</strong>r 1.0pu was decided <strong>to</strong> be an appropriate choice for the relay settingswhich means that the resistive reach had <strong>to</strong> be increasedfor all relays, apart from the CL12 device. The distance protectionused in ARISTO is of box form and accordingly alldistance relays in the North region and associated <strong>to</strong> the interconnectionwere given the resistive reach 1 pu with respect <strong>to</strong>its own line reactance. Note, according <strong>to</strong> the implementationof the distance relays in ARISTO Z eq,i is here replaced byX eq,i in (13) for the setting process. Consequently, the resistivereach of the relays are given with respect <strong>to</strong> their linereactance and not their <strong>to</strong>tal line impedances.The test case was investigated with the new relay settings.About 143 s after the initial genera<strong>to</strong>r loss CL12, CL14, CL15and CL 16 are tripped by their distance protection. Seven secondslater also the relay of CL 17 operates and the North andNorthEast regions are completely separated from the remainingregions. Consequently, the northern regions are protectedand immediately recover <strong>to</strong> a normal operating condition,while the Central and SouthWest regions are subjected <strong>to</strong> acollapse.Immediately after the first four lines are tripped the voltagein the Central and SouthWest regions drops rapidly which inturn initiates load shedding. The tripping of CL 17 is delayedby this load shedding as the power through the transfer sectionis reduced. Additionally, some genera<strong>to</strong>r shedding is requiredin the North region in order <strong>to</strong> avoid over-frequency after theinitial line tripping. Also the genera<strong>to</strong>r shedding will reducethe power transfer over the interconnection and contribute <strong>to</strong>the delay of the tripping of CL17. Genera<strong>to</strong>r shedding isrequired since the NORDIC32 system is relatively small andthere is insufficient system capacity <strong>to</strong> absorb the surpluspower within an acceptable time frame.If communication equipment is used the co-ordination ofthe line tripping can be further improved by adding a devicethat trips all lines when e.g three out of five lines are out ofservice as there is no practical possibility that the system willremain stable for such an operating condition.V. DISCUSSIONToday duplicated main protection is often used for transmissionlines, and the Zone 3 relays can conveniently be used forthe emergency scheme proposed here. Distance relays usuallyprovide more than three tripping zones and thus the schemecan also be operated for systems applying remote back-up orreversed tripping schemes based on communication. For certainrelay characteristics (e.g mho) the settings in the resistiveand reactive direction are dependent on each other. Whenthose relays are used for transfer sections relevant <strong>to</strong> the emergencyscheme the associated conventional remote back-upzones most likely require a longer reach than the relay settings
equired by the scheme due <strong>to</strong> the very large line impedancesinvolved. Thus, the traditional remote back-up protection mayinherently provide a function where regions are separated inthe case of abnormal operating conditions; the separation willbe carried out in an unforeseen manner though. However,conventional long remote back-up settings should be preventedas they may lead <strong>to</strong> mal-trips due <strong>to</strong> load encroachmentwhich in turn may significantly increase the probability ofinstability [3]. On the other hand the separation principlebased on load encroachment by distance protection can beadopted, but the system separation should be accomplished ina controlled and pre-determined manner.According <strong>to</strong> the nature of the scheme, caution should begiven <strong>to</strong> the setting process as inappropriate settings can bedetrimental. In order <strong>to</strong> obtain an overall reliable performancewith respect <strong>to</strong> both the scheme and normal fault clearing,only distance relays offering separated setting-mechanisms inthe resistive and reactive direction should be used. Thescheme should be used <strong>to</strong>gether with Out-of-Step protectionin order <strong>to</strong> obstruct the increased mal-trip possibility resultingfrom increased tripping zones.In the case of systems operating at line loading levels belowSurge Impedance Loading, as the NORDIC32, reversed distanceprotection reach may be required. However, as the timedelay of the Zone 3 elements are much larger than the timedelays of the interacting forward reach Zones 1 and 2, theselectivity should be unaffected. For the test case in sectionIV the reversed approach was rejected. Nevertheless, byapplying this technique the tripping co-ordination time for CL17 will be significantly improved and the time gap betweenthe tripping of the first four lines and CL 17 is accordinglyreduced.In the case where a shorter reach is obtained for the Zone 3element than for the Zone 1 and 2 elements, i.e the reachobtained is less than the required fault resistance, prioritymust obviously be given <strong>to</strong> the fault resistance. However, withrespect <strong>to</strong> relevant system and fault data this scenario is highlyunlikely.To restrict the number of lines removed in the case of a contingency,the distance protection settings obtained for thescheme can also be used for remote control of load sheddingand other conventional corrective measures. However, thescheme should primarily be an extremely reliable final measure<strong>to</strong> avoid a complete collapse and should therefore be independen<strong>to</strong>f long distance communication.VI. CONCLUSIONSAn emergency scheme based on conventional Zone 3 distanceprotection has been proposed where the scheme avoids a completesystem collapse in the case of severe voltage instability.The scheme is simple in its nature and easy <strong>to</strong> implement as itis using relays which are already in service. The main incentivefor the scheme is <strong>to</strong> avoid a complete breakdown as thisleads <strong>to</strong> an extremely time consuming res<strong>to</strong>ration process.Furthermore, the scheme is intended <strong>to</strong> be a robust and finalcorrective measure for situations when there is no way <strong>to</strong>maintain voltage within the entire system.The performance of the scheme has been illustrated from atest case based on the NORDIC32 system. The schemeshowed an encouraging performance. A complete system collapseas in the case of original relay settings was restricted <strong>to</strong>a partial collapse when the scheme was applied.If long distance communication applications are introducedthe method can also be utilized for a more extensive WideArea <strong>Protection</strong> <strong>System</strong>. Examples are supervising remotecontrol of load- and/or genera<strong>to</strong>r shedding.VII. ACKNOWLEDGEMENTSThe authors would like <strong>to</strong> thank Svenska Kraftnät for theirinterest in this research area and for their financial support.VIII. REFERENCES.[1] Edström A, Walve K, ”A Highly Interactive Fast Simula<strong>to</strong>rCovering Transients Stability and Long TermDynamics in Large <strong>Power</strong> <strong>System</strong>s”, CIGRÉ Report38-204, Paris, August 28-September 3, 1994.[2] CIGRÉ TF 38-02-08, ”Long Term Dynamics PhaseII”, 1995.[3] Jonsson M, ”Line <strong>Protection</strong> and <strong>Power</strong> <strong>System</strong> Collapse”,Technical Report No. 393L, Chalmers Universityof Technology, Sweden, 2001.IX. BIOGRAPHIESMattias Jonsson received his M. Sc. and Lic.Eng from Chalmers Universityof Technology in 1998 and 2001, respectively. His interest lies in powersystem stability and power system protection. At present he works <strong>to</strong>wards aPh.D. thesis.Jaap E. Daalder obtained his Ph.D in power engineering from the EindhovenUniversity of Technology, The Netherlands. He worked there as anAssociate Professor until 1984 when he left for Norway <strong>to</strong> become a Direc<strong>to</strong>rof Technology and Member of the Board of a subsidiary of the Brown BoveriCompany, nowadays ABB. In 1993 he was appointed as full Professor atChalmers University of Technology. Since 1997 he is heading the Departmen<strong>to</strong>f Electric <strong>Power</strong> Engineering. His areas of interest are power systems andenvironmental issues related <strong>to</strong> power engineering.Kenneth Walve received his M. Sc. from the Royal Institute of Technology,S<strong>to</strong>ckholm in 1969. For many years he worked at Vattenfall (The SwedishState <strong>Power</strong> Board) and since 1992 at Svenska Kraftnät (Swedish NationalGrid). His tasks has been power system analysis and now he is workingmainly with opera<strong>to</strong>r training and special projects.


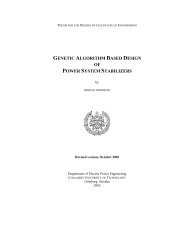


![LAPLACE OPERATOR.ppt [Lecture seule]](https://img.yumpu.com/42909900/1/190x135/laplace-operatorppt-lecture-seule.jpg?quality=85)