Annual - AJ Lucas
Annual - AJ Lucas
Annual - AJ Lucas

You also want an ePaper? Increase the reach of your titles
YUMPU automatically turns print PDFs into web optimized ePapers that Google loves.
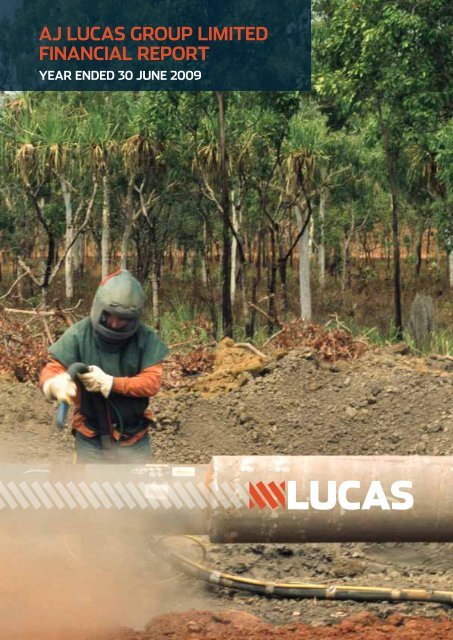
<strong>AJ</strong> <strong>Lucas</strong> Group Limitedfinancial reportyear ended 30 june 2009
annual report 2009<strong>AJ</strong> LUCAS GROUP LIMITEDFINANCIAL REPORTYEAR ENDED 30 JUNE 2009Page2 Directors’ report16 Income statements17 Statements of recognised income and expense18 Balance sheets19 Statements of cash flows20 Notes to the financial statements64 Directors’ declaration65 Independent auditor’s report66 Australian Securities Exchange additional information67 Directory
annual report 20092financial reportdirectors’ reportThe Board of directors have pleasure in presenting their report together with the financial report of <strong>AJ</strong> <strong>Lucas</strong> Group Limited (theCompany) and the consolidated entity, being the Company, its controlled entities, interests in associates and jointly controlled entities(the Group), for the year ended 30 June 2009 and the auditor’s report thereon.DirectorsThe Directors of <strong>AJ</strong> <strong>Lucas</strong> Group Limited at any time during or since the end of the financial year are as follows:Allan Campbell BCom LLBExecutive chairman and CEOAge 53Director since 1995After qualifying as a lawyer, Mr Campbell worked for severalleading investment banks, initially in Australia then for tenyears in London and New York. During this period he was givenresponsibility for corporate advisory and recovery where hegained valuable hands-on experience in the turnaround ofdistressed companies.Mr Campbell acquired <strong>Lucas</strong> in 1995, setting the Companyon a path and listed it on the ASX in 1999. Subsequently, hehas been responsible for the Company’s strategic direction andhas established its position as one of the leading provider ofinfrastructure, construction and mining services in Australia.Ian Stuart-Robertson AAIQSExecutive directorAge 60Director since 1993Mr Stuart-Robertson is a qualified quantity surveyor with nearly40 years experience in civil and building construction. He haspreviously served as a director of several construction companiesand been responsible for the delivery of many major projects. Healso has considerable expertise in project cost reporting systemsand makes a vital contribution to the Group in his role as chairmanof the tender review committee.He is also a non-executive director of quantity surveyors, JohnHollis & Partners.
annual report 20093financial reportAndrew Lukas beExecutive directorAge 62Director since 1995Mr Lukas is a qualified civil engineer. He joined <strong>Lucas</strong> in 1975 afterworking in the engineering and construction of pipelines in theUSA and Australia for the Williams group of companies.He pioneered the development of horizontal directional drillingin Australia and is an authority on this technology as well aspipelines. He is also a leading proponent of directional drilling incoal seam gas extraction.He is a past president of the Australian Pipeline IndustryAssociation (APIA) and a director and past president of theInternational Pipeline and Offshore Contractors Association(IPLOCA).Garry O’Meally BSc BEIndependent non-executive directormember of audit committeeAge 73Director since 1999Martin Green FCAIndependent non-executive directorChairman of audit committeeAge 64Director since 1999Mr Green is a Fellow of the Institute of Chartered Accountants andan official liquidator of the Supreme Court of NSW. He has beenin public practice for 37 years, mainly specialising in businessrecovery and insolvency. He has substantial business and financeexperience at senior levels.He is currently a principal at BRI Ferrier (NSW) Pty LtdChartered Accountants, a former honorary director/treasurer ofthe National Trust of Australia (NSW) and has served at varioustimes in many public roles and capacities.Mr Green also serves as Chairman of the Company’s AuditCommittee.Mr O’Meally has over 40 years experience in the oil and gasindustries, mainly with Australian Gas Light Company where heserved as general manager of AGL Gas Companies and later ofAGL Petroleum. He was also general manager of Queensland andNorthern Territory for Santos Limited and has consulted to manyenergy companies.He was previously president of the Australian Gas Association,councillor and Queensland chairman of the Australian PetroleumProduction and Exploration Association and an executive managerof the Australian Pipeline Industry Association. Mr O’Meally’sknowledge of the energy industries has been vitally important inthe Group’s expansion into its coal seam gas activities.
annual report 20094financial reportCompany secretaryMr Nicholas Swan MA, MBA, was appointed as company secretaryon 15 November 2001. He has also served as the companysecretary of several listed public companies as well as of aresponsible entity for managed investment schemes.Directors’ meetingsThe number of directors’ meetings (including meetings ofcommittees of directors) held during the financial year, during theperiod of each director’s tenure, and number of such meetingsattended by each of the directors is:Board ofDirectorsAudit committeeHeld Attended Held AttendedAllan Campbell 16 16 — —Ian Stuart-Robertson 16 14 — —Andrew Lukas 16 16 — —Martin Green 16 16 2 2Garry O’Meally 16 16 2 2Corporate governance statementThe Board of directors is responsible for the corporategovernance of the Group. This statement outlines the maincorporate governance practices. Unless otherwise stated, thesepractices were in place for the entire year.Board of directorsThe directors of the Company are accountable to shareholdersfor the proper management of the business and affairs of theCompany.The key responsibilities of the Board are to:• establish and monitor the corporate strategies of theCompany;• ensure proper corporate governance;• monitor the performance of management;• ensure that appropriate risk management systems, internalcontrols, reporting systems and compliance frameworks arein place and operating effectively;• monitor financial results;• approve decisions concerning investments, acquisitions anddividends; and• comply with reporting and other requirements of the law.The Board’s role and responsibilities are documented in a writtenBoard charter which is available on the investor page of theCompany’s website. The Board charter details the functionsreserved to the Board and those delegated to the CEO whothen engages senior management to assist in those delegatedfunctions. The directors are also subject to a Code of Conduct,a copy of which is also available on the investor page of theCompany website.Composition of the BoardThe constitution of the Company requires between three and tendirectors. Currently there are five directors, two of whom are nonexecutiveand both of whom are independent.The table below sets out the independence status of each directoras at the date of this annual report.DirectorAllan CampbellAndrew LukasIan Stuart-RobertsonMartin GreenGarry O’MeallyStatusNon-independent chief executive officerand chairmanNon-independent executive directorNon-independent executive directorIndependent non-executive directorIndependent non-executive directorProfiles of the current directors including details of theirqualifications and experience are found in the Directors’ Report.Directors are appointed for their industry-specific expertiseand commercial acumen. The Board believes that all the directorscan make, and do make, quality and independent judgementsin the best interests of the Company. While the Chairman is alsothe chief executive officer, his contribution to the Company isconsidered vital to direct the strategy of the Company as well asits management. The Chairman and CEO is a major shareholderand it is considered that his interests are aligned with those ofother shareholders. While such roles have not been separatedat this stage of the Company’s growth, the Board is monitoringopportunities for separation of the CEO and chair roles subject toidentifying suitable candidates. Similarly, the Board recognisesthe need for additional non-executive independent input, and ismonitoring opportunities.The directors are able to obtain independent advice at theexpense of the Company.During the financial year ending 30 June 2009, the Companydid not have a formal nomination committee it being the view thatone was not necessary while the Board is its current size. In recentyears, the composition of the Board has remained relatively static.The Board recognises the need for the size and composition ofthe Board to have a balance of skills and experience to allow it tomake its decisions having regard to the interests of the variousstakeholders of the Company. The analysis of size and compositionis undertaken without any formal procedure for selection andappointment of new directors.Directors are nominated for re-election by rotation.The Board’s performance is assessed on an informal basis givenits size. It is noted that with such a small Board, each director has,and is required, to actively participate in the business of the Board.On this basis, no formal evaluation process is undertaken.Ethical and responsible decision makingThe Company has a code of conduct to guide the directors andkey executives. It includes disclosure of conflicts of interest anduse of information not otherwise publicly known or available. Anydirector with an interest in matters being considered by the Boardmust take no part in decisions relating to those matters.The Directors’ Code of Conduct is available in the investorsection of the Company’s website as is the employee Code ofConduct as provided to each employee on commencing withthe Company. These codes address the practices necessary tomaintain confidence in the Company’s integrity, to take accountof legal obligations and expectations of stakeholders and theresponsibility and accountability for reporting and investigatingunethical practices.Trading in Company securitiesThe Company has in place a Securities Trading Policy whichrestricts the times and circumstances in which directors, senior
annual report 20095financial reportexecutives and certain employees may buy or sell shares in theCompany. These persons are required to seek approval from theCompany Secretary prior to trading.Directors must also advise the Company, which advises the ASX ontheir behalf, of any transactions conducted by them in the Company’ssecurities within five business days after the transaction occurs.The Securities Trading Policy is available in the investor sectionof the Company’s website.Integrity in financial reportingThe Board has established an Audit Committee which providesassistance to the Board in fulfilling its corporate governance andoversight responsibilities in relation to the Company’s financialreporting, internal control systems, risk management systems,regulatory compliance and external audit. The Audit Committee isgoverned by the Audit Committee Charter which is available in theinvestor section of the Company’s website.The Committee must have at least two members. All membersmust be independent non-executive directors. At least onemember must have financial expertise and some members shallhave an understanding of the industry the Company operates in.The principal roles of the committee are to:• assess whether the accounting methods and statutoryreporting applied by management are consistent andcomply with accounting standards and applicable laws andregulations;• make recommendations on the appointment of the externalauditors, assess their performance and independence andensure that management responds to audit findings andrecommendations;• discuss the adequacy and effectiveness of the Company’sinternal control systems and policies to assess and managebusiness risks and its legal and regulatory complianceprogrammes; and• ensure effective monitoring of the Company’s compliancewith its codes of conduct and Board policy statements.The Audit Committee meets with the external auditors at leasttwice a year. The Committee is authorised to seek informationfrom any employee or external party and obtain legal or otherprofessional advice.Currently the Audit Committee consists of those directors setout in the following table. Their qualifications and experience isset out in the Directors’ Report.The Chief Executive Officer and the Chief Financial Officerhave provided assurance in writing to the Board that theCompany’s financial reports are founded on a sound system ofrisk management and internal compliance and control whichimplements the policies adopted by the Board.MeetingsNameIndependent/Non-independent attendedMartin Green(Chairman) Independent non-executive director 2 of 2Garry O’Meally Independent non-executive director 2 of 2The Audit Committee cooperates with its external auditorsin the selection, appointment and rotation of external auditengagement partners.Timely and balanced disclosureThe Company has established policies and procedures designedto ensure compliance with ASX listing rules, continuous disclosurerequirements and accountability for compliance at a senior levelso that investors have equal and timely access to all materialinformation.The Company has a Disclosure and Communications Policy, acopy of which is on the investor page of its website.Clear communication with shareholdersThe Continuous Disclosure and Communications Policy promoteseffective communication with shareholders and encouragesshareholder participation at AGMs.Risk identification and managementThe Board has established policies on risk management. Thesystems of internal financial controls have been determined bysenior management and are designed to provide reasonable butnot absolute protection against fraud, material mis-statement orloss. The chief executive officer and chief financial officer providerepresentation to the Audit Committee and the Board that therisk management system is operating effectively in all materialrespects in relation to financial risks.The Company has, in accordance with the Australian Standardon risk management AS/NZS4360:1999, developed a riskstatement and underlying procedures for the key risk areas ofPeople, Environment, Business and Reputation.A copy of the risk statement is available on the investor page ofthe Company’s website.As part of the CEO’s regular operational reviews, he reports to theBoard on key areas of risk and the Company’s management of risk.The Company has had a number of external audits of particulartypes of risk during the year.Encourage enhanced performanceThe performance of the Audit Committee, individual directors andkey executives is evaluated regularly by the Board.The Board informally evaluates its performance and that of theindividual directors and committees on a regular basis. The Boardbelieves that the individuals on the Board have made quality andindependent judgements in the best interests of the Company onall relevant issues during the reporting period. There has been aformal performance evaluation of all key executives (other thanthe executive directors) during the reporting period.Recognise the interests of all stakeholdersThe Company has established various codes of conduct to guidecompliance with legal and other obligations to stakeholders andthe community at large. These include ethical and work standards,employment practices including occupational health and safetyand employment opportunities, and environmental protection.The Company’s compliance and that of its employees is monitoredthrough internal review.REMUNERATIONDue to the small size of the board, a formal remunerationcommittee was not considered necessary. The independent nonexecutivedirectors review the remuneration of the executivedirectors and senior officers. The remuneration of the nonexecutivesis based on the recommendations of independentremuneration consultants and while there is no formal charter forremuneration, the Board seeks independent advice as required.The Company’s non-executive directors receive fees for actingas a director of the Company. Additional fees of $5,000 per
annual report 20096financial reportcommittee are payable for being a member of a sub-committeesuch as the Audit Committee. In addition to fees, non-executivedirectors may also receive shares in the Company.Executive Directors and senior executives are remuneratedbased on a fixed wage plus incentive payments. The Companyhas performance and review policies and procedures in place forthe evaluation of senior executives and these evaluations takeplace over the course of the year. The matters delegated to seniorexecutives are such matters as are within the delegated authorityof the CEO and delegated based on relevant skills and experience.Further details in relation to the remuneration of directors andsenior executives are set out in the Remuneration Report. TheBoard also seeks independent advice on the structure of executivepay and has acted in accordance with this advice.The Company’s Securities Trading Policy deals with executivesentering into transactions limiting risk on unvested equity, andhedging more generally.Principal activities<strong>AJ</strong> <strong>Lucas</strong> Group is a diversified infrastructure, construction andmining services group specialising in providing services to theenergy, water and wastewater, resources and property sectors.The Group has in excess of 1,100 employees and a client baseprincipally comprising State and local governments and majorcorporations.The Group is structured into three principal business segments:Drilling: Australia’s foremost provider of drilling services to thecoal and coal seam gas industries for the degasification of coalmines and the recovery and commercialisation of coal seam gasand associated services. The Group is also the market leader inthe trenchless installation of conduits and pipes using horizontaldirectional drilling.Construction and infrastructure: Provision ofconstruction and civil engineering services together with facilitiesmanagement.oil and gas: Exploration for and commercialisation ofunconventional and conventional hydrocarbons in Australia,Canada, USA and Europe.Review and results of operationsOverview of the consolidated entityThe consolidated entity recorded a net profit of $103,253,000(2008: $14,027,000). A summary of the results is set out in thefollowing table:Summary of financial results2009$’000Restated2008$’000Total revenue 499,177 424,301EBITDA 201,606 38,211EBIT 177,717 26,760Profit before tax 164,213 21,207Net profit attributable to members 103,253 14,027Total assets 515,005 231,619Net assets 199,757 66,364Basic earnings per share 156.1¢ 25.5 ¢Group’s consolidated profit after tax increased by 636% to$103.3 million (2008: $14.0 million). This was mainly attributableto the sale of the Group’s investment in Gloucester Basin for grosssale proceeds of $259 million realising a net profit after tax of$154.8 million.Gross revenue increased by 17.6% to $499.2 million. However,operating results were impacted by the adverse economic conditions,an impairment provision for intangibles and trade receivables,unanticipated costs of the integration of Mitchell Drilling, a difficultworking environment for several of the Group’s projects and badweather. These factors resulted in the underlying EBITDA decreasingby 2.9% to $37.1 million (2008: $38.2 million).Divisional performanceContributions from the business divisions were as follows:Revenue$’000EBITDA$’000Margin%2009Drilling 204,272 34,539 16.9Construction & infrastructure 287,395 10,106 3.4Oil and gas 7,510 — —2008Drilling 88,417 18,881 21.4Construction & infrastructure 335,884 23,179 6.9Oil and gas — — —DrillingFollowing the acquisition of Mitchell Drilling, completed in August2008, the Company established itself as the largest providerof drilling services to the coal and coal seam gas industries inAustralia. Drilling revenue increased by 131% to $204.3 million(2008: $88.4 million).While the divisional performance was very strong in the firstpart of the financial year, including the contribution from MitchellDrilling, a fall in demand for coal as a result of the economicdownturn resulted in reduced demand for the Group’s coaldegasification services. Together with weather interruptions,and costs of integrating the Mitchell business, this resulted in areduction in margin from 21.4% to 16.9%.However, the improving economy has resulted in the restorationin demand for coal and the Group’s drilling fleet is again operatingat full capacity. Demand for drilling services in the coal seam gassector remained strong throughout the financial year.Construction and infrastructureThe performance of the construction and infrastructure divisionwas impacted by the adverse economic conditions with revenuereducing by 12% to $287.4 million (2008: $335.9 million).Arduous working conditions due to poor weather and remotelocations, the deferral of several contracts and restructuringcosts, resulted in the divisional margin declining to 3.4% from6.9% in the previous year.Oil and gasThe Company sold its investment in the Gloucester Basin projectduring the year for $259 million, realising a pre-tax profit of $215.8million. The decision to sell the investment was made becausethe project was about to move into its commercialisation phasewhere the substantial investment required would cause the Group’sreturn on investment to decline. Likewise, the Company exited itsinvestment in Sydney Gas Limited, following an offer being made forthis company by AGL, resulting in a pre-tax profit of $5.4 million.
annual report 20097financial report<strong>Lucas</strong> has a 10% net profit interest (NPI) in oil and gasleasehold interests in the Monument Prospect (“the Prospect”)located in Trinity Country, East Texas, USA. The NPI entitles theCompany to:(i)A 10% interest in, the gross production revenue earned fromthe leases less all costs incurred in acquiring and developingthe Prospect and generating the revenue; and(ii) A 10% interest in, the gross proceeds from the sale ortransfer of the leasehold interest less all costs incurred inacquiring and developing the Prospect at the time of sale ortransfer.When the NPI investment was made, management was of theview that it had acquired an exploration and evaluation assetwithin the scope of AASB 6 Exploration for and Evaluation ofMineral Resources. Under this accounting standard, explorationand evaluation assets are assessed for impairment only whenfacts and circumstances suggest that the carrying amount of theasset may exceed its recoverable amount, or upon transfer todevelopment assets. Unlike other assets, there is no requirementto assess whether an indicator of impairment exists at eachreporting date until the Company has sufficient information toreach a conclusion about commercial viability and the feasibilityof extraction.As a result of further advice obtained by the Company andfollowing the negotiation and execution of documentation, theasset was reclassified as an intangible asset within the scope ofAASB 138 Intangible Assets as it represents a contractual right tofuture income streams. As a result, the Company was required totest the asset for impairment. Given that the Prospect remainsin an early stage of exploration and evaluation, the Company wasunable to prepare discounted cash flow analysis to support thecarrying value of the Prospect and accordingly, was required toimpair this asset ($56.6 million) as at 30 June 2009It should be noted that the Company considers that furtherexploration and evaluation activity should allow an assessment offuture cash flows to be performed.Investments for future performanceThe global demand for coal has rebounded strongly. The Companyexpects the increased demand to be maintained and in responseto new contracts, has recently ordered three new rigs.The outlook in demand for drilling services in the coal seam gassector also looks very strong as the various Queensland LNG exportproponents move towards Financial Investment Decision. However,the ramp up in capital expenditure for these projects is notexpected to commence until the end of 2010 / beginning of 2011.Development of the LNG projects on the North West Shelf arealso accelerating, most particularly at Gorgon. These projects willrequire drilling and infrastructure services and the Group is wellqualified to deliver these.Review of financial conditionCapital structureThe Company’s capital structure is managed in a manner tomaximise the return to shareholders subject to consideration ofthe financing risk of the business and the cash flows generatedfrom operations.Following the sale of the Company’s investment in GloucesterBasin and its shareholding in Sydney Gas Limited, the Company isstrongly capitalised. The Company has applied some of the saleproceeds to reducing its debt, much of it taken on to acquire theMitchell business, repaying approximately $75 million in the 2009calendar year. In addition, the Company has bought back 4.5% ofits shares via an on-market buy-back for $8.4 million.Cash flows from operationsCash flow from operations amounted to a net outflow of $11.9million. This result was impacted by the timing of contracts,notably the delay in commencement of several projects, and thereduced operating profitability of the business.Impact of legislation andother external requirementsThere were no changes in environmental or other legislativerequirements during the year that have significantly impacted theresults or operations of the Group.DividendsDividends paid or declared by the Company since the end of theprevious year were:Declared and paid during the year 2009Centsper shareTotalamount$’000Franked/unfrankedDate ofpaymentFinal 2008 4.5 3,038 15% franked 29 Sept 2008Interim 2009 5.0 3,320 Unfranked 27 Mar 20096,358Declared after end of yearAfter the balance sheet date, the directors have declared a 2009final ordinary dividend as follows:Centsper shareTotal amount$’000Franked/unfrankedDate ofpayment5.5 3,572 100% franked 28 Sept 2009The financial effect of this dividend has not been brought toaccount in the financial statements for the year ended 30 June2009 and will be recognised in the 2010 financial report.State of affairsIn the opinion of the Directors, other than the acquisitionof Mitchell Drilling, the sale of the Company’s investment inGloucester Basin and the investment in the Monument Prospectin Trinity County, East Texas, there were no significant changes inthe state of affairs of the Group during the financial year underreview.Environmental regulations & native titleAs infrastructure engineers, meeting stringent environmentaland land use regulations, including native title issues, are animportant element of our work. <strong>Lucas</strong> is committed to identifyingenvironmental risks and engineering solutions to avoid, minimiseor mitigate them. We work closely with all levels of government,landholders, Aboriginal land councils and other bodies to ensureour activities have minimal or no effect on land use and areasof environmental, archaeological or cultural importance. Oneof the key benefits of directional drilling is its ability to avoid orsubstantially mitigate environmental impact.
annual report 20098financial reportGroup policy requires all operations to be conducted in amanner that will preserve and protect the environment.The Directors are not aware of any significant environmentalincidents, or breaches of environmental regulations during orsince the end of the financial year.Events subsequent to reporting dateSubsequent to year-end, the Company invested a further $25.1million in relation to its 10% Net Profit Interest in the MonumentProspect as part of the Company’s oil and gas strategy. Referto Note 19 for further information in relation to the nature ofthis investment. Subsequent to balance date, the directors havedeclared a final ordinary dividend of 5.5¢ per share, fully franked.Other than these matters, there has not arisen in the intervalbetween the end of the financial year and the date of this reportany item, transaction or event of a material or unusual nature likely,in the opinion of the Directors of the Company, to affect significantlythe operations of the Group, the results of those operations, or thestate of affairs of the Group, in future financial years.Likely developmentsThe Group has successfully established itself as the leadingservice provider in each of its chosen activities. Its strategy ofbeing an integrated service provider to the energy, water andwastewater, resources and property sectors presents manyopportunities to leverage its service offering.The coal seam gas industry is expected to experiencesignificant growth in preparation for the proposed export ofLNG through Gladstone. <strong>AJ</strong> <strong>Lucas</strong> is the only company with thefull service capability to provide technical services, drilling andmanagement services, well head completions, work overs, wellservices and gas gathering systems through to pipelines to theLNG plant. This gives the Group a significant strategic advantageover all its competitors.The complementary nature of the Group’s activities will alsobe drawn upon to perform civil works for the infrastructure worksrequired for the LNG projects. Partnering with selected entitiesthrough joint ventures and alliances, and the development andapplication of innovative technology and practices, are expectedto create opportunities to apply the Group’s civil works expertise.The Group will continue to investigate direct investmentopportunities in the energy and water and wastewatersectors. These include both conventional and unconventionalhydrocarbons (shale gas). The Group will also pursue investmentopportunities in renewable energies (geothermal) and othertechnologies being developed to reduce greenhouse gasemissions by carbon geosequestration.Further information about likely developments in theoperations of the Group and the expected results of thoseoperations in future financial years has not been included in thisreport because disclosure of the information would be likely toresult in unreasonable prejudice to the Group.Other DisclosuresShares issued on exercise of rightsDuring or since the end of the financial year, the Company issuedthe following ordinary shares as result of the exercise of rights:Amount paid onNumber of shareseach share611,429 $NilThere were no amounts unpaid on the shares issued.Unissued shares under rights or optionsAt the date of this report, unissued shares of the Company underrights or options are:Expiry date Exercise price Number of shares30 June 2010 — 21,75430 June 2011 — 369,18324 November 2011 $1.10 550,00030 June 2012 — 144,78731 August 2012 — 1,119,06323 November 2012 $2.11 250,00030 June 2013 — 93,861All rights and options expire on the earlier of their expiry date,termination of the employee’s employment and cessation of theofficer’s service.The rights or options do not entitle the holders to participate inany share issue of the Company.Directors’ shareholdingsand other interestsThe relevant interest of each director and their director-relatedentities in the shares and options over shares issued by theCompany, as notified by the directors to the Australian SecuritiesExchange in accordance with Section 205G(1) of the CorporationsAct 2001, at the date of this report are:Options issued underManagementOrdinary SharesRights PlanAllan Campbell 10,140,083 598,648Ian Stuart-Robertson 1,386,750 220,000Andrew Lukas 6,204,833 220,000Martin Green 125,000 —Garry O’Meally 219,180 —Indemnification and insuranceof officers and auditorsIndemnificationThe Company has agreed to indemnify all directors and officersof the Company against all liabilities including expenses toanother person or entity (other than the Company or a relatedbody corporate) that may arise from their position as directorsor officers of the Group, except where the liability arises out ofconduct involving a lack of good faith.No indemnity has been provided to the auditors of the Company.Insurance premiumsSince the end of the previous financial year, the Company has paidpremiums in respect of Directors’ and Officers’ liability and legalexpenses insurance contracts for the year ending 30 November 2009.Non-audit servicesDuring the year, KPMG, the Company’s auditor, has performedcertain other services in addition to their statutory duties.The Board has considered the non-audit services providedduring the year by the auditor and in accordance with writtenadvice provided by resolution of the audit committee, is satisfied
annual report 20099financial reportthat the provision of those non-audit services during the yearby the auditor is compatible with, and did not compromise, theauditor independence requirements of the Corporations Act 2001for the following reasons:• all non-audit services were subject to the corporategovernance procedures adopted by the Company and havebeen reviewed by the audit committee to ensure they do notimpact the integrity and objectivity of the auditor; and• the non-audit services provided do not undermine thegeneral principles relating to auditor independence as set outin APES 110 ‘Code of Ethics for Professional Accountants’, asthey did not involve reviewing or auditing the auditor’s ownwork, acting in a management or decision-making capacityfor the Company, acting as an advocate for the Company orjointly sharing risks and rewards.Payments to the auditor of the Company, KPMG, and its relatedpractices for non-audit services provided during the year, as setout in note 7 in the notes to the financial statements, amounted to$695,228 (2008: $353,701).Lead auditor’s independence declarationThe Lead auditor’s independence declaration is set out on page15 and forms part of the Directors’ Report for the financial yearended 30 June 2009.Rounding offThe Company is of a kind referred to in ASIC 98/100 dated 10 July1998 and, in accordance with that Class Order, amounts in theDirectors’ Report and the financial report are rounded off to thenearest thousand dollars, unless otherwise stated.Remuneration report – auditedThis remuneration report outlines the remuneration policy for keymanagement personnel comprising the directors of the Companyand senior executives of the Company and the Group includingthe five most highly remunerated Company and Group executives.Key management personnel have authority and responsibility forplanning, directing and controlling the activities of the Companyand the Group. The Company Secretary is not considered tobe a key management person and has been excluded from keymanagement personnel disclosures in the financial report.Remuneration philosophyThe key principle of the Company’s executive remunerationpolicy is to set remuneration at a level that will attract and retainqualified and experienced personnel and motivate and rewardthem to achieve strategic objectives and improve business results.Remuneration is structured to reward employees forincreasing shareholder value. This is achieved by providing afixed remuneration component together with short and long termperformance-based incentives.Through creating goal congruence between directors, executivesand shareholders, it is hoped to maximise shareholder value.<strong>AJ</strong> <strong>Lucas</strong> aims to set fixed annual remuneration at marketmedian levels for jobs of comparable size and responsibility usingestablished job evaluation methods and to provide incentives toenable top performers to be remunerated at the upper end of themarket, subject always to the performance of the Group.The aim of the incentive plans is to drive performance tosuccessfully implement annual business plans and increaseshareholder value.The remuneration for executives and staff is reviewed annually,using a formal performance appraisal process and marketdata derived from independent surveys of people with similarcompetencies and responsibilities.Remuneration structureRemuneration packages include a mix of fixed and variableremuneration and short and long-term incentives.Fixed remunerationFixed remuneration consists of base remuneration which iscalculated on a total cost basis and includes any fringe benefit taxcharges related to employee benefits including motor vehicles aswell as employer contributions to superannuation.Incentive based remunerationIncentive based remuneration includes short-term and longtermincentives and is designed to reward executive directorsand senior executives for meeting or exceeding their financialobjectives.All incentive based remuneration is subject to the Groupachieving certain performance criteria including continuedservices and most importantly, a minimum level of profit. Incertain cases, the criteria may not reflect the Group performancebut may be based on a particular project or company’sperformance. Subject to these performance criteria being met,the short-term incentives (STI) may be received as cash orordinary shares in the Company. This is generally subject to aminimum percentage being taken in shares but may vary on acase by case basis.The long-term incentive (LTI) is only available to be takenin ordinary shares and vests after three years subject to therecipient still being employed by the Group at that time.Relationship of remunerationto company performanceIn considering the Group’s performance and benefits forshareholder wealth, executive management has regard to thefollowing indices in respect of the current financial year and theprevious two financial years.Year ended 30 Jun 2009 30 Jun 2008 30 Jun 2007Revenue ($’000) $499,177 $424,301 $216,369Net profit attributable toequity holders of theCompany ($’000) $103,253 $14,027 $6,396Earnings per share 156.1¢ 25.5¢ 11.9¢Dividend per share 9.5¢ 6.0¢ 0.0¢Share price at balance date $3.18 $6.27 $2.00Share price appreciation/(depreciation) (49%) 314% 230%The overall level of key management personnel compensationtakes into account the performance of the Group over a numberof years. Over the past three years, the Group’s earnings beforeinterest, tax, depreciation and amortisation (EBITDA) has grown ata compound annual growth rate of 288%. During the same period,the average increase in key management’s compensation hasgrown by approximately 191% per annum.
annual report 200912financial reportRights and options over equity instruments granted as compensation - auditedDetails of rights and options that were granted as compensation to each director of the Company and each of the named executivesduring the reporting period and details of the rights and options that vested during the reporting period are as follows:Grant dateNumber ofoptions grantedduring 2009Fair valueper option atgrant date$Exercise priceper options$ Expiry dateNumber ofoptions vestedduring 2009Directors26 Nov 2008 144,787 4.42 — 30 Jun 2012 —AS Campbell26 Nov 2008 93,861 4.27 — 30 Jun 2013 —ExecutivesI Redfern — — — — — 34,239K Lester — — — — — 20,543M Summergreene — — — — — 18,900B Tredinnick — — — — — 16,829M Tonkin 1 July 2008 6,087 2.05 — 30 June 2010 16,829M Tonkin 1 July 2008 6,087 1.97 — 30 June 2011 —M Tonkin 1 July 2008 3,675 1.88 — 30 June 2012 —N Swan — — — — — 14,941During the financial year, 238,648 options over unissued ordinary shares in the Company were issued to the executive directors asapproved by shareholders at the 2008 <strong>Annual</strong> General Meeting. These options vest on the third anniversary of the grant date. Nooptions or rights have been granted since the end of the financial year.Exercise of rights and options granted as compensation - auditedDuring the reporting period, the following shares were issued on the exercise of rights and options previously granted as compensationto the named executives:2009Numberof sharesAmount paid$/shareExecutivesI Redfern 109,239 —K Lester 20,543 —M Summergreene 18,900 —B Tredinnick 16,829 —M Tonkin 16,829 —N Swan 14,941 —There are no amounts unpaid on the shares issued as a result of the exercise of the rights or options.
annual report 200913financial reportanalysis of share-based payments granted as remuneration - auditedDetails of the vesting profile of the options and rights granted as remuneration to each director of the Company and each of the namedexecutives is detailed below:Options andrights grantedVestedForfeitedinFinancial yearsin whichoptions orNumberDate in year year 1 rights vestDirectors % %AS Campbell 250,000 24 Nov 2006 — — 2010110,000 23 Nov 2007 — — 2011144,787 26 Nov 2008 — — 201093,861 26 Nov 2008 — — 2011I Stuart-Robertson 150,000 24 Nov 2006 — — 201070,000 23 Nov 2007 — — 2011<strong>AJ</strong> Lukas 150,000 24 Nov 2006 — — 201070,000 23 Nov 2007 — — 2011Company and consolidated entity executivesI Redfern 34,239 31 Aug 2007 100 — 200961,333 31 Aug 2007 — — 2010K Lester 20,543 31 Aug 2007 100 — 200948,271 31 Aug 2007 — — 2010M Summergreene 18,900 31 Aug 2007 100 — 200944,409 31 Aug 2007 — — 2010B Tredinnick 16,829 31 Aug 2007 100 — 200939,544 31 Aug 2007 — — 2010M Tonkin 16,829 31 Aug 2007 100 — 200939,544 31 Aug 2007 — — 2010N Swan 14,941 31 Aug 2007 100 — 200939,910 31 Aug 2007 — — 2010(1) The % forfeited in the year represents the reduction from the maximum number of options available to vest due to theperformance hurdle not being achieved.
annual report 200914financial reportAnalysis of movements in options and rights - auditedThe movement during the reporting period, by value, of options and rights over ordinary shares of the Company held by each Companydirector and each of the named executives is detailed below:(i)Grantedin year$(ii)Value ofoptions and rightsexercised in year$(iii)Lapsedin year$DirectorsAS Campbell 1,041,000 — —ExecutiveI Redfern — 550,614 —K Lester — 53,617 —M Summergreene — 49,239 —B Tredinnick — 43,924 —M Tonkin — 43,924 —N Swan — 38,996 —(i) The value of options and rights is their fair value calculated at grant date using a Black-Scholes pricing model. The total value of theoptions and rights is included in the table above. This amount is allocated to remuneration over the vesting period.(ii) The value of the options and rights is calculated as the market price of the Company’s shares on the Australian Securities Exchangeas at close of trading on the date the options or rights were exercised after deducting the price paid to exercise the options andrights.(iii) The value of the options and rights that lapsed during the year represents the benefits foregone and is calculated at the date of theoption or right lapses using a Black-Scholes pricing model assuming the performance hurdle has not been met. No options or rightslapsed in the year.Signed in accordance with a resolution of the directors pursuant to s.298 (2) of the Corporations Act 2001.Allan Campbell, DirectorDated at Sydney, this 30th day of September 2009.
annual report 200916financial report<strong>AJ</strong> <strong>Lucas</strong> Group Limitedand its controlled entitiesINCOME STATEMENTSfor the year ended 30 june 2009The accompanying notes are an integral part of theseconsolidated financial statements.ConsolidatedCompanyNote2009$’000Restated*2008$’0002009$’0002008$’000Revenue 3 499,177 424,301 — 1,500Total revenue 499,177 424,301 — 1,500Other income 4 221,157 — 221,157 —Material costs (126,403) (123,788) — —Sub-contractor costs (118,141) (116,734) — —Employee expenses (135,905) (80,627) — —Plant and other construction costs (71,383) (55,404) — —Impairment of intangible asset 6 (56,644) — (56,644) —Depreciation and amortisation expenses 6 (23,889) (11,451) — —Impairment of receivables 6 (7,510) — — —Debt recovery and legal costs (1,050) (6,500) — —Other expenses (1,692) (3,037) — (93)Results from operating activities 177,717 26,760 164,513 1,407Financial income 5 7,908 1,322 12,648 6,591Financial expenses 5 (21,412) (6,875) (2,506) (5,078)Net financing (costs)/income 5 (13,504) (5,553) 10,142 1,513Profit before income tax 164,213 21,207 174,655 2,920Income tax (expense)/income 8 (60,960) (7,180) (67,174) 799Profit attributable to equity holders of the company 27 103,253 14,027 107,481 3,719Earnings per share:Basic earnings per share (cents) 9 156.1 25.5Diluted earnings per share (cents) 9 149.9 24.9* See change of accounting policy note (Note 2)
annual report 200917financial reportstatements of RECOGNISED INCOME AND EXPENSEfor the year ended 30 june 2009The accompanying notes are an integral part of theseconsolidated financial statements.ConsolidatedCompanyNote2009$’000Restated*2008$’0002009$’0002008$’000Exchange differences on translation of foreign operations 27 277 274 — —Effective portion of changes in fair value of cash flow hedges 27 (2,392) — — —Income and expense recognised directly in equity (2,115) 274 — —Profit for the year 27 103,253 14,027 107,481 3,719Total recognised income and expense for the year 27 101,138 14,301 107,481 3,719* See change of accounting policy note (Note 2)
annual report 200918financial report<strong>AJ</strong> <strong>Lucas</strong> Group Limitedand its controlled entitiesBalance SheetsAs at 30 june 2009The accompanying notes are an integral part of theseconsolidated financial statements.ConsolidatedCompany2009$’000Restated *2008$’0002009$’0002008$’000NoteCurrent assetsCash and cash equivalents 10 96,317 16,612 95,083 5,519Trade and other receivables 11 59,733 56,912 2,897 6,064Inventories 12 61,389 42,405 — —Other assets 13 907 1,717 — 184Total current assets 218,346 117,646 97,980 11,767Non-current assetsTrade and other receivables 11 24,029 — 200,008 49,889Property, plant and equipment 14 138,451 55,986 — —Investments 15 1,316 26,156 4,614 26,879Exploration assets 17 4,354 4,100 — —Intangible development assets 18 878 15,452 — —Other intangible assets 19 119,451 12,279 2,061 2,061Deferred tax assets 20 — — 276 8,405Investments in equity accounted investees 16 8,180 — 1,504 —Total non-current assets 296,659 113,973 208,463 87,234Total assets 515,005 231,619 306,443 99,001Current liabilitiesTrade and other payables 21 77,038 83,074 5,546 632Interest-bearing loans and borrowings 22 123,070 19,996 — 4,500Current tax liabilities 23 50,797 114 50,454 —Employee benefits 26 6,542 4,751 — —Provisions 24 — 3,799 — —Total current liabilities 257,447 111,734 56,000 5,132Non-current liabilitiesTrade and other payables 21 — — 19,677 29,361Interest-bearing loans and borrowings 22 45,495 51,036 43,172 18,226Deferred tax liabilities 20 11,576 1,737 — —Employee benefits 26 730 748 — —Total non-current liabilities 57,801 53,521 62,849 47,587Total liabilities 315,248 165,255 118,849 52,719Net assets 199,757 66,364 187,594 46,282EquityIssued capital 27 91,935 54,037 91,935 54,118Reserves 27 837 2,236 2,372 —Retained earnings/(accumulated losses) 27 106,985 10,091 93,287 (7,836)Total equity 27 199,757 66,364 187,594 46,282* See change of accounting policy note (note 2)
annual report 200919financial reportstatements of cash flowsfor the year ended 30 june 2009The accompanying notes are an integral part of theseconsolidated financial statements.Consolidated2009$’0002008$’0002009$’000Company2008$’000NoteCash flows from operating activitiesCash receipts from customers 542,314 450,877 — 66Cash payments to suppliers and employees (544,793) (394,407) — (277)Cash generated from operations (2,479) 56,470 — (211)Interest received 7,868 547 3,687 465Income taxes paid — (72) — —Interest and other costs of finance paid (17,287) (6,875) (2,479) (4,112)Net cash (used in)/from operating activities 32(b) (11,898) 50,070 1,208 (3,858)Cash flows from investing activitiesProceeds from sale of plant and equipment 596 1,018 — —Proceeds from sale of development asset 259,000 — 259,000 —Payment of development asset disposal costs (14,115) — (14,115) —Proceeds from sale of shares in listed entity 34,216 — 34,216 —Repayment of loans to controlled entities — — 1,847 —Payments for equity accounted investments (8,180) — (1,504) —Payment for investments (4,912) (27,858) (4,949) (25,243)Payment for intangible assets (41,918) — (41,918) —Loans to controlled entities — — (141,678) (8,574)Payments for plant and equipment (40,364) (21,472) — —Exploration and evaluation expenditure (7,384) (12,513) — —Loans to associate (24,029) — (24,029) —Loans to director related entity (9,953) (1,578) (9,953) (1,578)Loans to other entities (3,712) — (3,594) —Repayment of loan to director related entity — 292 — 263Repayment of loan to other entities 697 — 697 —Acquisition of subsidiary net of cash acquired (119,323) (9,993) — —Net cash from/(used in) investing activities 20,619 (72,104) 54,020 (35,132)Cash flows from financing activitiesProceeds from issue of shares 28,981 — 28,981 —Payments for share buy back (8,361) — (8,361) —Repayment of loans from controlled entities — — (17,913) —Proceeds of borrowings -other 125,053 41,690 45,000 22,626Repayment of borrowings - other (97,109) (6,413) (67,000) —Loans from controlled entities — — 17,190 13,144Deferred payment for acquisition (3,250) (625) — —Dividends paid (6,358) (3,273) (6,358) (3,273)Proceeds from issue of redeemable convertible preference shares 42,797 — 42,797 —Repayment of convertible notes — (1,500) — (1,500)Payment of finance lease liabilities (9,902) (4,659) — —Net cash from financing activities 71,851 25,220 34,336 30,997Net increase/(decrease) in cash and cash equivalents 80,572 3,186 89,564 (7,993)Cash and cash equivalents at beginning of the year 32(a) 15,745 12,559 5,519 13,512Cash and cash equivalents at end of the year 32(a) 96,317 15,745 95,083 5,519
annual report 200920financial reportnotes to thefinancial statementsPage Note Content20 1 Basis of preparation29 2 Change in accounting policy30 3 Segment reporting31 4 Other income31 5 Financial income and expense31 6 Other expenses32 7 Auditor’s remuneration32 8 Income tax33 9 Earnings per share33 10 Cash and cash equivalents34 11 Trade and other receivables34 12 Inventories34 13 Other assets35 14 Property, plant and equipment35 15 Investments36 16 Equity accounted investees36 17 Exploration assets37 18 Intangible development assets38 19 Other intangible assets39 20 Deferred tax assets and liabilities41 21 Trade and other payables41 22 Interest-bearing loans and borrowings44 23 Current tax liabilities44 24 Provisions44 25 Operating leases45 26 Employee benefits47 27 Capital and reserves48 28 Financial instruments54 29 Interests in joint ventures55 30 Consolidated entities56 31 Contingencies and commitments57 32 Reconciliation of cash flows from operating activities58 33 Acquisition of subsidiary59 34 Key management personnel disclosures62 35 Non-key management personnel disclosures62 36 Deed of cross guarantee63 37 Events subsequent to balance date1. basis of preparation<strong>AJ</strong> <strong>Lucas</strong> Group Limited (the ‘Company’) is a company domiciled inAustralia. The address of the Company’s registered office is 394 LaneCove Road, Macquarie Park, NSW 2113. The consolidated financialreport of the Company as at and for the financial year ended 30 June2009 comprises the Company and its subsidiaries (together referredto as the ‘Group’) and the Group’s interest in associates and jointlycontrolled entities.The accounting policies set out below have been applied consistentlyto all periods presented in these consolidated financial statements, andhave been applied consistently by all entities in the Group.Certain comparative amounts have been reclassified to conformwith current year presentation (see note 2).(a) Statement of complianceThe financial report is a general purpose financial report which hasbeen prepared in accordance with Australian Accounting Standards(‘AASBs’) including Australian interpretations adopted by theAustralian Accounting Standards Board (‘AASB’) and the CorporationsAct 2001. The consolidated financial report of the Group and thefinancial report of the Company comply with International FinancialReporting Standards (IFRSs) and interpretations adopted by theInternational Accounting Standards Board (IASB).The financial statements were approved by the Board of Directorson 30 September 2009.(B) Going concernAs at 30 June 2009, the Group is in a net current deficiency position of$39,101,000. The net current deficiency is due to the classification ofbank loans of $52,645,000 and lease finance facilities of $23,372,000which are due for repayment in excess of 12 months from balancedate, as current liabilities on the balance sheet. This reclassificationwas due to the Group and the Company being in breach of itsborrowing covenants with respect to its Senior Banking Facility(“Finance Facility”) with ANZ Bank (“Lender”) at 30 June 2009. Thebreach of borrowing covenants at 30 June 2009 has arisen as a resultof the deterioration in operating performance during the secondhalf of the 2009 financial year and an impairment loss recognised inrelation to a receivable.The financial statements are prepared on the basis that the Groupis a going concern, which assumes continuity of normal businessactivities and the realisation of assets and settlement of liabilitiesin the ordinary course of business. The directors have reached thisconclusion having regard to the following:• Positive indications received from the Group’s Lender that it iswilling to review the borrowing covenants which should assist theGroup to achieve future covenant compliance with the terms ofthe Finance Facility and to fund future growth prospects;• The directors’ confidence in the Group’s ability to raise additionaldebt and/or equity from non-bank sources to reduce bank debtif necessary and/or to fund future business requirements havingregard to the $74 million new finance raised during the 2009financial year through the issue of redeemable convertiblepreference shares ($45.0 million) and the issue of ordinary shares($29.0 million);• Positive cash flow projections by the Group taking into account:— Significant cash inflows from contracted revenue;— The value of the Group’s portfolio of energy assets combinedwith the Group’s ability to realise these assets;— Further likely contributions to commercialise the Group’senergy asset portfolio;
annual report 200921financial report— Actions taken by the Group to reduce operating expensesand enhance cash flows; and— The significant level of cash reserves held by the Group at30 June 2009.Had the going concern basis not been used, adjustment wouldneed to be made relating to the recoverability and classificationof recorded assets amounts, and/or to the amounts andclassifications of liabilities, to reflect the fact that the Groupmay be required to realise its assets and extinguish its liabilitiesother than in the normal course of the business, and at amountsdifferent from those stated in the financial report.(c) Basis of measurementThe consolidated financial statements have been prepared on thehistorical cost basis except for the following:• derivative financial instruments are measured at fair value• available-for-sale financial assets are measured at fair value• liabilities for cash-settled share-based paymentarrangements are measured at fair value.The methods used to measure fair values are discussed in note 1 (AA).(d) Functional and presentation currencyThe consolidated financial report is presented in Australiandollars which is the Company’s functional currency and thefunctional currency of the majority of the Group. The Companyis of a kind referred to in ASIC Class Order 98/100 dated 10 July1998 (updated by CO 05/641 effective 28 July 2005 and CO 06/51effective 31 January 2006) and in accordance with that ClassOrder, all financial information presented in Australian dollarshas been rounded off to the nearest thousand dollars, unlessotherwise stated.(e) Use of estimates and judgmentsThe preparation of financial statements requires managementto make judgements, estimates and assumptions that affect theapplication of accounting policies and the reported amount ofassets, liabilities, income and expenses. Actual results may differfrom these estimates. Estimates and underlying assumptions arereviewed on an ongoing basis. Revisions to accounting estimatesare recognised in the period in which the estimate is revised and inany future periods affected.In particular, information about significant areas of estimationuncertainty and critical judgements in applying accountingpolicies that have the most significant effect on the amountrecognised in the financial statements are described in thefollowing notes:• Note 12 — inventories; Note 18 — intangible developmentassets; Note 19 — impairment tests for cash generating unitscontaining goodwill; Note 20 — utilisation of tax losses;Notes 24 & 31 — provisions and contingencies; Note 25 — leaseclassification;Note 26 — Measurement of share based payments; Note 28 —Valuation of financial instruments; Note 33 — Acquisition ofsubsidiary(f) Basis of consolidationAssociates: Associates are those entities in which the Grouphas significant influence, but not control, over the financial andoperating policies. Significant influence is presumed to exist whenthe Group holds between 20 and 50 percent of the voting powerof another entity.Associates are accounted for using the equity method (equityaccounted investees) and are initially recognised at cost. TheGroup’s investment includes goodwill identified on acquisition, netof any accumulated impairment losses. The consolidated financialstatements include the Group’s share of income and expensesand equity movements of equity accounted investees, afteradjustments to align the accounting policies with those of theGroup, from the date that significant influence commences untilthe date that significant influence ceases. Where the Group’s shareof losses exceeds its interest in an equity accounted investee,the carrying amount of that interest (including any long-terminvestments) is reduced to nil and the recognition of furtherlosses is discontinued except to the extent that the Group has anobligation or has made payments on behalf of the investee.Subsidiaries: Subsidiaries are entities controlled by the Group.Control exists when the Group has the power, directly or indirectly,to govern the financial and operating policies of an entity so as toobtain benefits from its activities. In assessing control, potentialvoting rights that presently are exercisable or convertible aretaken into account. The financial statements of subsidiaries areincluded in the consolidated financial statements from the datethat control commences until the date that control ceases. Theaccounting policies of subsidiaries have been changed whennecessary to align them with the policies adopted by the Group.Jointly controlled operations, assets and entities:Jointly controlled entities are those entities over whose activitiesthe Group has joint control, established by contractual agreementand requiring unanimous consent for strategic financial andoperating decisions.The interest of the Company and of the Group inunincorporated joint ventures and jointly controlled assets arebrought to account by recognising in its financial statements theassets it controls, the liabilities that it incurs, the expenses itincurs and its share of income that it earns from the sale of goodsor services by the joint venture.Transactions eliminated on consolidation: Intragroupbalances, and any unrealised gains and losses or income andexpenses arising from intragroup transactions, are eliminatedin preparing the consolidated financial statements. Unrealisedgains arising from transactions with equity accounted investeesare eliminated against the investment to the extent of the Group’sinterest in the investee. Unrealised losses are eliminated in thesame way as unrealised gains, but only to the extent that there isno evidence of impairment.Gains and losses are recognised when the contributed assetsare consumed or sold by the equity accounted investees or, if notconsumed or sold by the equity accounted investee, when theGroup’s interest in such entities is disposed of.(g) Foreign currencyForeign currency transactions: Transactions in foreigncurrencies are translated to the respective functional currenciesof the Group’s entities at exchange rates at the dates of thetransactions. Monetary assets and liabilities denominated inforeign currencies at the reporting date are retranslated to thefunctional currency at the foreign exchange rate at that date.The foreign currency gain or loss on monetary items is thedifference between amortised cost in the functional currency at
annual report 200922financial reportthe beginning of the period, adjusted for effective interest andpayments during the period, and the amortised cost in foreigncurrency translated at the exchange rate at the end of the period.Non-monetary assets and liabilities denominated in foreigncurrencies that are measured at fair value are retranslated to thefunctional currency at the exchange rate at the date that the fairvalue was determined. Foreign currency differences arising onretranslation are recognised in profit or loss.Foreign operations: The assets and liabilities of foreignoperations are translated to Australian dollars at exchangerates at the reporting date. The income and expenses of foreignoperations are translated to Australian dollars at exchange ratesat the dates of the transactions.Foreign currency differences are recognised directly in equity.Since 1 January 2004, the Group’s date of transition to AASBs,such differences have been recognised in the foreign currencytranslation reserve (FCTR). When a foreign operation is disposedof, in part or in full, the relevant amount in the FCTR is transferredto profit or loss.Foreign exchange gains and losses arising from a monetaryitem receivable from or payable to a foreign operation,the settlement of which is neither planned nor likely in theforeseeable future, are considered to form part of the netinvestment in a foreign operation and are recognised directly inequity in the FCTR.(h) Financial instrumentsNon-derivative financial instruments: Non-derivativefinancial instruments comprise trade and other receivables, cashand cash equivalents, loans and borrowings, and trade and otherpayables.Non-derivative financial instruments are recognised initiallyat fair value plus, for instruments not at fair value through profitor loss, any directly attributable transaction costs. Subsequentto initial recognition, non-derivative financial instruments aremeasured as described below.Cash and cash equivalents comprise cash balances and calldeposits. Bank overdrafts that are repayable on demand and forman integral part of the Group’s cash management are included asa component of cash and cash equivalents for the purpose of thestatement of cash flows.Non-derivative financial instruments, other than “available forsalefinancial assets” described below, are measured at amortisedcost using the effective interest method, less any impairment losses.Compound financial instruments: Compound financialinstruments issued by the Group comprise convertible notes thatcan be converted to share capital at the option of the holder, andthe number of shares to be issued does not vary with changes intheir fair value.The liability component of a compound financial instrument isrecognised initially at the fair value of a similar liability that doesnot have an equity conversion option. The equity component isrecognised initially at the difference between the fair value of thecompound financial instrument as a whole and the fair value ofthe liability component. Any directly attributable transaction costsare allocated to the liability and equity components in proportionto their initial carrying amounts.Subsequent to initial recognition, the liability component of acompound financial instruments is measured at amortised costusing the effective interest method. The equity component of acompound financial instruments is not remeasured subsequent toinitial recognition.Interest, dividends, losses and gains relating to the financialliability are recognised in the profit or loss. Distributions to theequity holders are recognised against equity, net of any taxbenefit.Available-for-sale financial assets: The Group’sinvestments in equity securities are classified as availablefor-salefinancial assets. Subsequent to initial recognition,they are measured at fair value and changes therein, otherthan impairment losses are recognised directly in a separatecomponent of equity. When an investment is derecognised, thecumulative gain or loss in equity is transferred to profit or loss.Cash flow hedges: The Group holds derivative financialinstruments to hedge its interest rate risk exposure. Changes inthe fair value of the derivative hedging instrument designatedas a cash flow hedge are recognised directly in equity to theextent that the hedge is effective. To the extent that the hedge isineffective changes in fair value are recognised in profit or loss.(i) Share capitalOrdinary shares: Ordinary shares are classified as equity.Incremental costs directly attributable to the issue of ordinaryshares and share options are recognised as a deduction fromequity, net of any related income tax benefit.Redeemable convertible preference shares:Redeemable convertible preference shares are classified asa liability as they are redeemable on a specific date or at theoption of the shareholders, and the dividend payments are notdiscretionary. Dividends thereon are recognised as interestexpense in the profit and loss as accrued.Dividends: Dividends are recognised as a liability in the periodin which they are declared.(j) Leased assetsLeases in terms of which the Group assumes substantially all therisks and rewards of ownership are classified as finance leases.Upon initial recognition, the leased asset is measured at anamount equal to the lower of its fair value and the present valueof the minimum lease payments. Subsequent to initial recognition,the asset is accounted for in accordance with the accountingpolicy applicable to that asset.Other leases are operating leases and the leased assets are notrecognised on the Group’s balance sheet.(k) RevenueServices rendered: Revenue from services rendered isrecognised in the income statement in proportion to the stage ofcompletion of the transaction at the balance sheet date. The stage ofcompletion is assessed by reference to certification of work performed.Construction contracts: Contract revenue includesthe initial amount agreed in the contract plus any variations incontract work, claims and incentive payments to the extent that itis probable that they will result in revenue and can be measuredreliably. As soon as the outcome of a construction contract can be
annual report 200923financial reportestimated reliably, contract revenue and expenses are recognisedin the income statement in proportion to the stage of completionof the contract.The stage of completion is assessed by reference to anassessment of total labour hours and other costs incurred todate as a percentage of estimated total costs for each contract,unless an alternative measurement method provides a moreaccurate indication of the stage of completion. When the outcomeof a construction contract cannot be estimated reliably, contractrevenue is recognised only to the extent of contract costs incurredthat are likely to be recoverable. An expected loss on a contract isrecognised immediately in the income statement.(l) Lease paymentsPayments made under operating leases are recognised in theincome statement on a straight-line basis over the term of thelease. Lease incentives received are recognised as an integral partof the total lease expense, over the term of the lease.Minimum lease payments made under finance leases areapportioned between the finance expense and the reduction ofthe outstanding liability. The finance expense is allocated to eachperiod during the lease term so as to produce a constant periodicrate of interest on the remaining balance of the liability.(m) Finance income and expensesFinance income comprises interest income on funds invested,dividend income and foreign currency gains that are recognised inthe income statement. Interest income is recognised as it accrues,using the effective interest method. Dividend income is recognisedin profit or loss on the date that the Group’s right to receivepayment is established, which in the case of quoted securities isthe ex-dividend date.Finance expenses comprise interest expense on borrowings,unwinding of the discount on provisions and deferredconsideration, foreign currency losses and impairment lossesrecognised on financial assets that are recognised in the incomestatement. All borrowing costs are recognised in the incomestatement using the effective interest method. Transaction costsassociated with loans and borrowings were capitalised and are tobe expensed over the period of the borrowings.(n) Income taxIncome tax expense comprises current and deferred tax. Incometax is recognised in the income statement except to the extentthat it relates to items recognised directly in equity, in which caseit is recognised in equity.Current tax is the expected tax payable on the taxable income forthe year, using tax rates enacted or substantially enacted at thereporting date, and any adjustment to tax payable in respect ofprevious years.Deferred tax is recognised using the balance sheet method,providing for temporary differences between the carryingamounts of assets and liabilities for financial reporting purposesand the amounts used for taxation purposes. The followingtemporary differences are not provided for: the initial recognitionof goodwill and assets or liabilities in a transaction that isnot a business combination and affects neither accountingnor taxable profit, and differences relating to investments insubsidiaries to the extent that they will probably not reverse inthe foreseeable future. Deferred tax is measured at the tax ratesthat are expected to be applied to the temporary differenceswhen they reverse, based on the laws that have been enacted orsubstantially enacted by the reporting date. Deferred tax assetsand liabilities are offset if there is a legally enforceable right tooffset current tax liabilities and assets, and they relate to incometaxes levied by the same authority on the same taxable entity,or on different tax entities, but they intend to settle currenttax liabilities and assets on a net basis or their tax assets andliabilities will be realised simultaneously.A deferred tax asset is recognised only to the extent that it isprobable that future taxable profits will be available against whichthe temporary difference can be utilised. Deferred tax assets arereduced to the extent that it is no longer probable that the relatedtax benefit will be realised.Additional income taxes that arise from the distribution ofdividends are recognised at the same time as the liability to paythe related dividend is recognised.Tax consolidation: The Company and its wholly-ownedAustralian resident entities have formed a tax-consolidated groupand are therefore taxed as a single entity. The head entity withinthe tax-consolidated group is <strong>AJ</strong> <strong>Lucas</strong> Group Limited.Current tax expense/income, deferred tax liabilities anddeferred tax assets arising from temporary differences ofthe members of the tax-consolidated group are recognised inthe separate financial statements of the members of the taxconsolidatedgroup using the group allocation approach.Any current tax liabilities (or assets) and deferred tax assetsarising from unused tax losses of the subsidiaries are assumed bythe head entity in the tax-consolidated group and are recognisedby the Company as amounts payable (receivable) to/(from) otherentities in the tax-consolidated group in conjunction with anytax funding arrangement amounts (refer below). Any differencebetween these amounts is recognised by the Company as anequity contribution or distribution.The Company recognises deferred tax assets arising fromunused tax losses of the tax-consolidated group to the extent thatit is probable that future taxable profits of the tax-consolidatedgroup will be available against which the asset can be utilised.Any subsequent period adjustments to deferred tax assets arisingfrom unused tax losses as a result of revised assessments of theprobability of recoverability is recognised by the head entity only.Nature of tax funding arrangements and taxsharing arrangements: The head entity, in conjunctionwith other members of the tax-consolidated group, has enteredinto a tax funding arrangement which sets out the fundingobligations of members of the tax-consolidated group in respectof tax amounts. The tax funding arrangements require paymentsto/from the head entity equal to the current tax liability/(asset)assumed by the head entity and any tax-loss deferred taxasset assumed by the head entity, resulting in the head entityrecognising an inter-entity receivable /(payable) equal in amountto the tax liability/(asset) assumed. The inter-entity receivable/(payable) are at call.Contributions to fund the current tax liabilities are payableas per the tax funding arrangement and reflect the timing of thehead entity’s obligation to make payments for tax liabilities to therelevant tax authorities.The head entity in conjunction with other members of thetax-consolidated group, has also entered into a tax sharingagreement. The tax sharing agreement provides for thedetermination of the allocation of income tax liabilities betweenthe entities should the head entity default on its tax payment
annual report 200924financial reportobligations. No amounts have been recognised in the financialstatements in respect of this agreement as payment of anyamounts under the tax sharing agreement is considered remote.(o) Earnings per shareThe Group presents basic and diluted earnings per share (EPS)data for its ordinary shares. Basic EPS is calculated by dividing theprofit or loss attributable to ordinary shareholders of the Companyby the weighted average number of ordinary shares outstandingduring the period. Diluted EPS is determined by adjusting the profitor loss attributable to ordinary shareholders and the weightedaverage number of ordinary shares outstanding for the effects ofall dilutive potential ordinary shares, which comprise convertiblenotes and share options granted to employees.(p) Segment reportingA segment is a distinguishable component of the Group that isengaged either in providing related products or services (businesssegment), or in providing products or services within a particulareconomic environment (geographical segment), which is subjectto risks and rewards that are different from those of othersegments. Segment information is presented in respect of theGroup’s business and geographical segments. The consolidatedentity’s primary format for segment reporting is based onbusiness segments. The business segments are determined basedon the Group’s management and internal reporting structure.Segment results, assets and liabilities include items directlyattributable to a segment as well as those that can be allocated ona reasonable basis. Unallocated items comprise mainly loans andborrowings and related expenses, corporate assets (primarily theCompany’s headquarters) and head office expenses, and incometax assets and liabilities.Segment capital expenditure is the total cost incurred duringthe period to acquire property, plant and equipment, andintangible assets other than goodwill.(q) Construction work in progressConstruction work in progress represents the gross unbilledamount expected to be collected from customers for contractwork performed to date. It is measured at cost plus profitrecognised to date less progress billings and recognised losses.Cost includes all expenditure related directly to specific projectsand an allocation of fixed and variable overheads incurred in theGroup’s contract activities based on normal operating capacity.Construction work in progress is presented as part of trade andother receivables in the balance sheet. If payments received fromcustomers exceed the income recognised, then the difference ispresented as deferred income in the balance sheet.(r) Property, plant and equipmentRecognition and measurement: Items of property,plant and equipment are measured at cost less accumulateddepreciation and impairment losses. The cost of property, plantand equipment at 1 July 2004, the date of transition to AASBs, wasdetermined by reference to its fair value at that date.Cost includes expenditures that are directly attributable tothe acquisition of the asset. The cost of self-constructed assetsincludes the cost of materials, direct labour, the initial estimate,where relevant, of the costs of dismantling and removing theitems and restoring the site on which they are located, anappropriate proportion of production overheads and any othercosts directly attributable to bringing the asset to a workingcondition for its intended use. Purchased software that is integralto the functionality of the related equipment is capitalised as partof that equipment. Borrowing costs related to the acquisition orconstruction of qualifying assets are recognised in profit or loss asincurred.When parts of an item of property, plant and equipment havedifferent useful lives, they are accounted for as separate items(major components) of property, plant and equipment.Leased assets: Leases in terms of which the Group assumessubstantially all the risks and rewards of ownership are classifiedas finance leases. Finance leases are measured at an amountequal to the lower of fair value and the present value of minimumlease payments at inception of the lease, less accumulateddepreciation and impairment losses.Sale of non-current assets: The net gain or loss ondisposal is included in the income statement in “other income” atthe date control of the asset passes to the buyer, usually when anunconditional contract for sale is signed.The gain or loss on disposal is calculated as the differencebetween the carrying amount of the asset at the time of disposaland the net proceeds on disposal (including incidental costs).Subsequent costs: The cost of replacing part of an itemof property, plant and equipment is recognised in the carryingamount of the item if it is probable that the future economicbenefits embodied within the part will flow to the Group andits cost can be measured reliably. The costs of the day-to-dayservicing of property, plant and equipment are recognised inprofit or loss as incurred.DepreciationDepreciation is charged to the income statement on a straightlinebasis over the estimated useful lives of each part of an itemof plant and equipment commencing from the time the asset isready for use. Leased assets are depreciated over the shorter ofthe lease term and their useful lives unless it is reasonably certainthat the Group will obtain ownership by the end of the lease term.The estimated useful lives for the current and comparativeperiods are as follows:Plant and equipmentYearsPlant and equipment 4-10Motor vehicles 7Office equipment 4-8Computer equipment 3-4Leased plant and equipment 4-10The residual value, the useful life and the depreciation methodapplied to an asset are reassessed at least annually.(s) Intangible assetsGoodwill: Goodwill (negative goodwill) arises on theacquisition of subsidiaries, associates and joint ventures.Acquisitions prior to 1 July 2003: As part of its transition toAASBs, the Group elected to restate only those business combinationsthat occurred on or after 1 July 2003. In respect of acquisitions priorto 1 July 2003, goodwill represents the amount recognised under theGroup’s previous accounting framework, Australian GAAP.
annual report 200925financial reportAcquisitions on or after 1 July 2003: For acquisitions on orafter 1 July 2003, goodwill represents the excess of the cost ofthe acquisition over the Group’s interest in the net fair value ofthe identifiable assets, liabilities and contingent liabilities of theacquiree. When the excess is negative (negative goodwill), it isrecognised immediately in profit or loss.Subsequent measurement: Following initial recognition, goodwillis measured at cost less any accumulated impairment losses. Inrespect of equity accounted investees, the carrying amount ofgoodwill is included in the carrying amount of the investment.Research and development: Expenditure on researchactivities, undertaken with the prospect of gaining new scientificor technical knowledge and understanding, is recognised in theincome statement when incurred.Development activities involve a plan or design for theproduction of new or substantially improved products orprocesses. Development expenditure is capitalised only ifdevelopment costs can be measured reliably, the product orprocess is technically and commercially feasible, future economicbenefits are probable and the Group intends to and has sufficientresources to complete development and to use or sell the asset.The expenditure capitalised includes the cost of materials, directlabour and overhead costs that are directly attributable topreparing the asset for its intended use. Borrowing costs relatedto the development of qualifying assets are recognised in profit orloss as incurred. Other development expenditure is recognised inprofit or loss as incurred.Capitalised development expenditure is stated at cost lessaccumulated amortisation and accumulated impairment losses.Customer relationships and customer contracts:Customer relationship and customer contracts intangibles that areacquired by the Group that have finite lives are measured at costless accumulated amortisation and impairment losses.Other intangible assets: Other intangible assets that areacquired by the Group are measured at cost less accumulatedamortisation and accumulated impairment losses.Subsequent expenditure: Subsequent expenditure oncapitalised intangible assets is capitalised only when it increasesthe future economic benefits embodied in the specific asset towhich it relates. All other expenditure is recognised in the incomestatement as incurred.Amortisation: Amortisation is recognised in the incomestatement on a straight line basis over the estimated useful livesof intangible assets unless such lives are indefinite. Goodwill andintangible assets with an indefinite useful life are systematicallytested for impairment at each balance sheet date. Otherintangible assets are amortised from the date they are availablefor use. The estimated useful lives in the current and comparativeperiods are as follows:• Other development costs – 5 years• Customer intangibles:(i) Contracts — are amortised over the life of each contract(ii) Customer relationships — are amortised over a five yearperiod after the expiration of the contract.(t) Exploration and evaluation assetsExploration and evaluation costs, including the costs of acquiringlicences, are capitalised as exploration and evaluation assets onan area of interest basis. Costs incurred before the Group hasobtained legal rights to explore an area are recognised in theincome statement.Exploration and evaluation assets are only recognised if therights of the area of interest are current and either:(i)the expenditures are expected to be recouped through successfuldevelopment and exploitation of the area of interest; or(ii) activities in the area of interest have not at the reportingdate, reached a stage which permits a reasonable assessmentof the existence or otherwise of economically recoverablereserves and active and significant operations in, or inrelation to, the area of interest are continuing.Exploration and evaluation assets are assessed for impairment if:(i)sufficient data exists to determine technical feasibility andcommercial viability; and(ii) facts and circumstances suggest that the carrying amountexceeds the recoverable amount. For the purposes ofimpairment testing, exploration and evaluation assets areallocated to cash-generating units to which the explorationactivity relates. The cash generating unit shall not be largerthan the area of interest.When the area of interest enters the development phase, theaccumulated exploration and evaluation is transferred to gasassets in development.(u) Gas assetsAssets in development: When the technical and commercialfeasibility of an undeveloped gas field in an area of interest hasbeen demonstrated, the field enters the development phase.The costs of the area of interest field assets in the developmentphase are separately accounted for as assets and include pastexploration and evaluation costs, development drilling and othersurface and subsurface expenditure, surface plant and equipmentand any associated land and buildings.When commercial operations commences, the accumulatedcosts are transferred to gas producing assets.Producing assets: The costs of gas assets in production areseparately accounted for as assets and include past explorationand evaluation costs, pre-production development costs andongoing costs of continuing to develop resources for productionand to expand or replace plant and equipment and any associatedland and buildings. These costs will be subject to depreciationand depletion and also tested annually for impairment.(v) ImpairmentFinancial assets: A financial asset is assessed at eachreporting date to determine whether there is any objective evidencethat it is impaired. A financial asset is considered to be impaired ifobjective evidence indicates that one or more events have had anegative effect on the estimated future cash flows of that asset.An impairment loss in respect of a financial asset measured atamortised cost is calculated as the difference between its carryingamount, and the present value of the estimated future cash flowsdiscounted at the original effective interest rate. An impairmentloss in respect of an available-for-sale financial asset is calculatedby reference to its fair value.
annual report 200926financial reportIndividually significant financial assets are tested for impairmenton a individual basis. The remaining financial assets are assessedcollectively in groups that share similar credit risk characteristics.All impairment losses are recognised in the income statement.Any cumulative loss in respect of an available-for-sale financialasset recognised previously in equity is transferred to the IncomeStatement. An impairment loss is reversed if the reversal can berelated objectively to an event occurring after the impairment losswas recognised. For available-for-sale financial assets that areequity securities, the reversal is recognised directly in equity.Non-financial assets: The carrying amounts of the Group’snon-financial assets, other than inventories, construction work inprogress and deferred tax assets, are reviewed at each reportingdate to determine whether there is any indication of impairment.If any such indication exists, then the asset’s recoverable amountis estimated. For goodwill and intangible assets that haveindefinite lives or that are not yet available for use, recoverableamount is estimated at each reporting date.The recoverable amount of an asset or cash-generating unitis the greater of its value in use and its fair value less costs tosell. In assessing value in use, the estimated future cash flowsare discounted to their present value using a pre-tax discountrate that reflects current market assessments of the time valueof money and the risks specific to the asset. For the purpose ofimpairment testing, assets are grouped together into the smallestgroup of assets that generates cash inflows from continuinguse that are largely independent of the cash inflows of otherassets or groups of assets (“the cash generating unit”). Thegoodwill acquired in a business combination, for the purpose ofimpairment testing, is allocated to cash generating units that areexpected to benefit from the synergies of the combination.An impairment loss is recognised if the carrying amount ofan asset or its cash-generating unit exceeds its recoverableamount. Impairment losses are recognised in profit or loss.Impairment losses recognised in respect of cash-generating unitsare allocated first to reduce the carrying amount of any goodwillallocated to the units and then to reduce the carrying amount ofthe other assets in the unit (group of units) on a pro rata basis.An impairment loss in respect of goodwill is not reversed. Inrespect of other assets, impairment losses recognised in priorperiods are assessed at each reporting date for any indicationsthat the loss has decreased or no longer exists. An impairmentloss is reversed if there has been a change in the estimatesused to determine the recoverable amount. An impairment lossis reversed only to the extent that the asset’s carrying amountdoes not exceed the carrying amount that would have beendetermined, net of depreciation or amortisation, if no impairmentloss had been recognised.(w) Employee benefitsDefined contribution superannuation funds: Adefined contribution plan is a post-employment benefit plan underwhich an entity pays fixed contributions into a separate entityand will have no legal or constructive obligation to pay furtheramounts. Obligations for contributions to defined contributionplans are recognised as a personnel expense in profit or loss whenthey are due. Prepaid contributions are recognised as an asset tothe extent that a cash refund or a reduction in future payments isavailable.Other long-term employee benefits: The Group’s netobligation in respect of long-term employee benefits is the amountof future benefit that employees have earned in return for theirservice in the current and prior periods plus related on costs; thatbenefit is discounted to determine its present value. The discountrate is the yield at the reporting date on AA credit-rated bondsthat have maturity dates approximating the terms of the Group’sobligations. The calculation is performed using the projected unitcredit method. Any actuarial gains or losses are recognised in theincome statement in the period in which they arise.Short-term benefits: Short-term employee benefitobligations are measured on an undiscounted basis and areexpensed as the related service is provided.Share-based payment transactions: The grant date fairvalue of options granted to employees is recognised as an employeeexpense, with a corresponding increase in equity, over the period inwhich the employees become unconditionally entitled to the options.The amount recognised as an expense is adjusted to reflect the actualnumber of share options that vest, except for those that fail to vestdue to market conditions not being met.The fair value of the amount payable to employees inrespect of share appreciation rights, which are settled in cash,is recognised as an expense, with a corresponding increasein liabilities, over the period in which the employees becomeunconditionally entitled to payment. The liability is remeasuredat each reporting date and at settlement date. Any changes in thefair value of the liability are recognised as personnel expense inprofit or loss.Share-based payment arrangements in which the Groupreceives goods or services as consideration for its own equityinstruments are accounted for as equity-settled share-basedpayment transactions, regardless of how the equity instrumentsare obtained by the Group.When the Company grants options over its shares to employeesof subsidiaries, the fair value at grant date is recognised as anincrease in the investments in subsidiaries, with a correspondingincrease in equity over the vesting period of the grant.(x) ProvisionsA provision is recognised if, as a result of a past event, theGroup has a present legal or constructive obligation that can beestimated reliably, and it is probable that an outflow of economicbenefits will be required to settle the obligation. Provisions aredetermined by discounting the expected future cash flows at apre-tax rate that reflects current market assessments of the timevalue of money and the risks specific to the liability.(y) Goods and services taxRevenue, expenses and assets are recognised net of the amountof goods and services tax (GST), except where the amount ofGST incurred is not recoverable from the taxation authority. Inthese circumstances, the GST is recognised as part of the cost ofacquisition of the asset or as part of the expense.Receivables and payables are stated with the amount of GSTincluded. The net amount of GST recoverable from, or payableto, the ATO is included as a current asset or liability in thebalance sheet.Cash flows are included in the statement of cash flows ona gross basis. The GST components of cash flows arising from
annual report 200927financial reportinvesting and financing activities which are recoverable from, orpayable to, the ATO are classified as operating cash flows.(z) New standards and interpretationsnot yet adoptedThe following standards, amendments to standards andinterpretations have been identified as those which may impactthe entity in the period of initial application. They are availablefor early adoption at 30 June 2009, but have not been applied inpreparing this financial report:• Revised AASB 3 Business Combinations (2008) incorporatesthe following changes that are likely to be relevant to theGroup’s operations:• The definition of a business has been broadened, whichis likely to result in more acquisitions being treated asbusiness combinations• Contingent consideration will be measured at fair value,with subsequent changes therein recognised in profit orloss• Transaction costs, other than share and debt issue costs,will be expensed as incurred• Any pre-existing interest in the acquiree will be measuredat fair value with the gain or loss recognised in profit or loss• Any non-controlling (minority) interest will be measuredat either fair value, or at its proportionate interest in theidentifiable assets and liabilities of the acquiree, on atransaction-by-transaction basis.Revised AASB 3, which becomes mandatory for theGroup’s 30 June 2010 financial statements, will be appliedprospectively and therefore there will be no impact on priorperiods in the Group’s 2010 consolidated financial statement.• Amended AASB 127 Consolidated and Separate FinancialStatements (2008) requires accounting for changes inownership interests by the Group in a subsidiary, whilemaintaining control, to be recognised as an equitytransaction. When the Group loses control of subsidiary, anyinterest retained in the former subsidiary will be measuredat fair value with the gain or loss recognised in profit or loss.The amendments to AASB 127, which become mandatoryfor the Group’s 30 June 2010 financial statements, are notexpected to have a significant impact on the consolidatedfinancial statements.• AASB 8 Operating Segments introduces the “managementapproach” to segment reporting. AASB 8, which becomesmandatory for the Group’s 30 June 2010 financial statements,will require a change in the presentation on and disclosure ofsegment information based on the internal reports regularlyreviewed by the Group’s Chief Operating Decision Maker inorder to assess each segment’s performance and to allocateresources to them. Currently the Group presents segmentinformation in respect of its business and geographicalsegments (see note 3). The application of the managementapproach is not expected to have a significant impact on thedisclosure of segment information.• Revised AASB 101 Presentation of Financial Statements (2007)introduces the term total comprehensive income, whichrepresents changes in equity during a period other thanthose changes resulting from transactions with owners intheir capacity as owners. Total comprehensive income maybe presented in either a single statement of comprehensiveincome (effectively combining both the income statement andall non-owner changes in equity in a single statement) or, in anincome statement and a separate statement of comprehensiveincome. Revised AASB 101, which becomes mandatory for theGroup’s 30 June 2010 financial statements, is expected to havea significant impact on the presentation of the consolidatedfinancial statements. The Group plans to provide totalcomprehensive income in a single statement of comprehensiveincome for its 2010 consolidated financial statements.• Revised AASB 123 Borrowing Costs removes the option toexpense borrowing costs and requires that an entity capitaliseborrowing costs directly attributable to the acquisition,construction or production of a qualifying asset as part ofthe cost of that asset. The revised AASB 123 will becomemandatory for the Group’s 30 June 2010 financial statementsand will constitute a change in accounting policy for the Group.In accordance with the transitional provisions the Group willapply the revised AASB 123 to qualifying assets for whichcapitalisation of borrowing costs commences on or after theeffective date. Therefore there will be no impact on priorperiods in the Group’s 30 June 2010 financial statements.• AASB 2008-1 Amendments to Australian Accounting Standard– Share-based Payment: Vesting Conditions and Cancellationsclarifies the definition of vesting conditions, introduces theconcept of non-vesting conditions, requires non-vestingconditions to be reflected in grant-date fair value andprovides the accounting treatment for non-vesting conditionsand cancellations. The amendments to AASB 2 will bemandatory for the Group’s 30 June 2010 financial statements,with retrospective application. The Group has not yetdetermined the potential effect of the Interpretation.• AASB 2008-5 Amendments to Australian Accounting Standardsarising from the <strong>Annual</strong> Improvements Process and 2008-6Further Amendments to Australian Accounting Standardsarising from the <strong>Annual</strong> Improvements Process affectvarious AASBs resulting in minor changes for presentation,disclosure, recognition and measurement purposes. Theamendments, which become mandatory for the Group’s 30June 2010 financial statements, are not expected to have anyimpact on the financial statements.• AASB 2008-7 Amendments to Accounting Standards – Costof an Investment in a Subsidiary, Jointly Controlled Entity orAssociate changes the recognition and measurement ofdividend receipts as income and addresses the accountingof a newly formed parent entity in the separate financialstatements. The amendments become mandatory for theGroup’s 30 June 2010 financial statements. They are notexpected to have a significant impact on the financial report.• AASB 2008-8 Amendments to Australian Accounting Standard- Eligible Hedged Items clarifies the effect of using options ashedging instruments and the circumstances in which inflationrisk can be hedged. The amendments become mandatoryfor the Group’s 30 June 2010 financial statements, withretrospective application.• AI 15 Agreements for the Construction of Real Estateprovides guidance on the accounting for agreements forthe construction of real estate by the seller under AASB 111Construction Contracts or AASB 118 Revenue and the timingof revenue recognition. AI 15 will become mandatory for theGroup’s 30 June 2010 financial statements, with retrospectiveapplication required. The Group has not yet determined thepotential effect of the Interpretation.
annual report 200928financial report• AI 16 Hedges of a Net Investment in a Foreign Operationclarifies that net investment hedging can only be appliedwhen the net assets of the foreign operation are recognisedin the entity’s consolidated financial statements. AI 16 willbecome mandatory for the Group’s 30 June 2010 financialstatements. It is not expected to have a significant impact onthe financial report.• AI 17 Distributions of Non-Cash Assets to Owners providesguidance in respect of measuring the value of distributions ofnon-cash assets to owners. AI 17 will become mandatory for theGroup’s 30 June 2010 consolidated financial statements. It is notexpected to have a significant impact on the financial report.• AI 18 Transfers of Assets from Customers provides guidance onthe accounting for contributions from customers in the form oftransfers of property, plant and equipment (or cash to acquireor construct it). AI 18 will become mandatory for the Group’s30 June 2010 consolidated financial statements. It is notexpected to have a significant impact on the financial report.(aa) Determination of fair valuesA number of the Group’s accounting policies and disclosuresrequire the determination of fair value, for both financial and nonfinancialassets and liabilities. Fair values have been determinedfor measurement and / or disclosure purposes based on thefollowing methods. When applicable, further information aboutthe assumptions made in determining fair values is disclosed inthe notes specific to that asset or liability.Property, plant and equipment: The fair value ofproperty, plant and equipment recognised as a result of abusiness combination is based on market values. The marketvalue of property is the estimated amount for which a propertycould be exchanged on the date of valuation between a willingbuyer and a willing seller in an arm’s length transactionafter proper marketing wherein the parties had each actedknowledgeably, prudently and without compulsion. The marketvalue of items of plant, equipment, fixtures and fittings is basedon the quoted market prices for similar items.Intangible assets: The fair value of customer relationshipsacquired in a business combination is determined using themulti-period excess earnings method, whereby the subject assetis valued after deducting a fair return on all other assets that arepart of creating the related cash flows. The fair value of otherintangible assets is based on the discounted cash flows expectedto be derived from the use and eventual sale of the assets.Inventories: The fair value of inventories acquired in abusiness combination is determined based on its estimated sellingprice in the ordinary course of business less the estimated costs ofcompletion and sale, and a reasonable profit margin based on theeffort required to complete and sell the inventories.Investments in equity and debt securities: The fairvalue of financial assets at fair value through profit or loss, heldto-maturityinvestments and available-for-sale financial assets isdetermined by reference to their quoted closing bid price at thereporting date. The fair value of held-to-maturity investments isdetermined for disclosure purposes only.Trade and other receivables: The fair value of trade andother receivables, excluding construction work in progress, isestimated as the present value of future cash flows, discounted atthe market rate of interest at the reporting date.Derivatives: The fair value of interest rate swaps is based onbroker quotes. Those quotes are tested for reasonableness bydiscounting estimated future cash flows based on the terms andmaturity of each contract and using market interest rates for asimilar instrument at the measurement date.Non-derivative financial liabilities: Fair value, whichis determined for disclosure purposes, is calculated based onthe present value of future principal and interest cash flows,discounted at the market rate of interest at the reporting date. Inrespect of the liability component of convertible notes, the marketrate of interest is determined by reference to similar liabilities thatdo not have a conversion option. For finance leases the market rateof interest is determined by reference to similar lease agreements.Share-based payment transactions: The fair valueof employee stock options and share appreciation rights aremeasured using the Black-Scholes formula. Measurement inputsinclude share price on measurement date, exercise price of theinstrument, expected volatility (based on weighted averagehistoric volatility adjusted for changes expected due to publiclyavailable information), weighted average expected life of theinstruments (based on historical experience and general optionholder behaviour), expected dividends, and the risk-free interestrate (based on government bonds). Service and non-marketperformance conditions attached to the transactions are nottaken into account in determining fair value.Financial guarantees: For financial guarantee contractliabilities, the fair value at initial recognition is determined using aprobability weighted discounted cash flow approach. This methodtakes into account the probability of default by the guaranteedparty over the term of the contract, the loss given default(being the proportion of the exposure that is not expected to berecovered in the event of default) and exposure at default (beingthe maximum loss at the time of default).
annual report 200929financial report2. CHANGE IN ACCOUNTING POLICYThe Group has revised its accounting policy in relation to inventories of spare parts and drilling consumables. Under the revised policy,inventories of such items are capitalised and measured at the lower of cost and net realisable value. The cost of acquiring inventories isbased on the weighted average cost principle, and includes expenditure incurred in acquiring the inventories, production or conversioncosts and other costs incurred in bring them to their existing location and condition. Net realisable value is the estimated selling pricein the ordinary course of business, less the estimated costs of completion and selling expenses. Previously the Group expensed all suchitems. The change in accounting policy was applied retrospectively to inventories in accordance with AASB 108.The change in accounting policy has the following impact on the consolidated financial statements:2009$’0002008$’000Income statement for the year ended 30 JuneDecrease in cost of sales (3,082) (799)Increase in income tax expense 925 240Increase in profit from continuing operations 2,157 559Recognised income and expense for the year ended 30 JuneIncrease in profit for the period 2,157 559Balance sheet at 30 JuneIncrease in construction work in progress and inventories 5,428 1,720Decrease in goodwill (438) —Increase in deferred tax liability (1,628) (516)Increase in retained earnings 3,362 1,204The adjustment to retained earnings at 1 July 2007 was an increase of $645,000 relating to the year ended 30 June 2007.The change in accounting policy had an impact of 3.3 and 3.1 cents per share (2008: 1.0 and 0.9 cents per share) on basic and dilutedearnings per share, respectively.The Group has also elected to change the classification of its business segments. This change followed a reorganisation of theGroup’s management structure and internal financial reporting arrangements. As a result of the change, the “Pipelines” businesssegment has now been included within the “Construction and Infrastructure” business segment. In addition a new “Oil and Gas”segment has been introduced which was previously reported as unallocated.Comparative information has been restated to reflect this change in accounting policy.There was no effect on the Company.
annual report 200930financial report3. SEGMENT REPORTINGSegment information is presented in respect of the Group’s business and geographical segments. The primary format, businesssegment, is based on the Group’s management and internal reporting structure.Segment results, assets and liabilities include items directly attributable to a segment as well as those that can be allocated on areasonable basis. Other income comprises the profits derived from the sale of the Group’s investment in its Gloucester developmentasset and shares held in Sydney Gas Limited. Impairment loss represents a provision recognised in respect of the net profit interestin oil and gas leasehold interests in the Monument Prospect located in Trinity County, East Texas, USA (refer to note 19) and theimpairment of a receivable (refer to note 11). Other unallocated items mainly comprise interest-earning assets and revenue, investmentsin equity accounted investees, interest-bearing loans, borrowings and expenses, and corporate assets and expenses. Inter-segmentpricing is determined on an arms length basis.Segment capital expenditure is the total cost incurred during the period to acquire segment assets that are expected to be used formore than one period.Business segmentsThe Group comprises the following main business segments based on the Group’s reporting system:DrillingDrilling services for the recovery and commercialisation of coal seam gas, degasification ofunderground coal mines, and the trenchless installation of pipes and conduits.Construction and infrastructure Civil engineering services for the construction of infrastructure, pipelines and buildings,together with facilities management.Oil and gasExploration for and commercialisation of unconventional and conventional hydrocarbons inAustralia, Canada, USA and Europe.2009$’000DrillingRestated2008$’000Construction &infrastructure2009$’000Restated2008$’0002009$’000Oil and gasRestated2008$’000Consolidated2009$’000Total segment revenue 204,272 88,417 287,395 335,884 7,510 — 499,177 424,301Restated2008$’000Other income — — — — 221,157 — 221,157 —Impairment losses — — — — (64,154) — (64,154) —Other segment expenses (193,184) (80,506) (277,727) (313,186) — — (470,911) (393,692)Segment result 11,088 7,911 9,668 22,698 164,513 — 185,269 30,609Unallocated expenses (7,552) (3,849)Results from operating activities 177,717 26,760Net finance costs (13,504) (5,553)Profit before tax 164,213 21,207Income tax (expense)/benefit (60,960) (7,180)Net profit for the year 103,253 14,027Depreciation and amortisation 23,451 10,970 438 481 — — 23,889 11,451AssetsSegment assets 377,424 135,953 85,778 88,771 36,874 — 500,076 224,724Unallocated assets 14,929 6,895Total Assets 515,005 231,619LiabilitiesSegment liabilities 236,515 116,419 75,247 43,968 — — 311,762 160,387Unallocated liabilities 3,486 4,868Total Liabilities 315,248 165,255Capital expenditure 37,725 16,488 15,344 6,990 — — 53,069 23,478Unallocated capital expenditure 9,778 —62,847 23,478
annual report 200931financial reportSecondary reporting — geographical segmentsGeographical segment revenue and assets are based on the respective geographical location of customers and assets.Operating revenue Segment assets Capital expenditure2009$’000Restated2008$’0002009$’000Restated2008$’0002009$’000Restated2008$’000Australia 491,667 421,421 489,353 228,622 62,847 23,478North America 7,510 — — 2,897 — —Europe — — 25,533 — — —Asia/Pacific — 2,880 119 100 — —499,177 424,301 515,005 231,619 62,847 23,4784. Other incomeConsolidated2009$’0002008$’000Company2009$’0002008$’000Profit on sale of development asset (refer note 18) 215,765 — 215,765 —Profit on disposal of investment in listed entity (refer note 15) 5,392 — 5,392 —221,157 — 221,157 —5. Financial income and expenseConsolidated2009$’0002008$’000Company2009$’0002008$’000Interest income 7,908 1,173 3,686 1,091Dividend income — — 8,962 5,500Net foreign exchange gain — 149 — —Financial income 7,908 1,322 12,648 6,591Interest expense (20,880) (6,875) (2,506) (5,076)Net foreign exchange loss (532) — — (2)Financial expenses (21,412) (6,875) (2,506) (5,078)Net financing (expense)/income (13,504) (5,553) 10,142 1,5136. Other expensesConsolidated2009$’0002008$’000Company2009$’0002008$’000Profit before income tax has been arrived at after charging thefollowing items:Depreciation of property, plant and equipment 13,250 6,074 — —Amortisation of: — —Leased plant and equipment 4,588 2,605 — —Development expenditure 228 182 — —Contracts and customer relationships 5,809 2,590 — —Tender costs 14 — — —10,639 5,377 — —Total depreciation and amortisation 23,889 11,451 — —Impairment of intangible assets (refer note 19) 56,644 — 56,644 —Impairment of receivables (refer note 11) 7,510 — — —
annual report 200932financial report7. Auditor’s RemunerationConsolidated2009$2008$Company2009$Audit servicesAuditors of the Company — KPMGAudit and review of financial reportsAustralia 347,820 347,990 — 17,500Overseas — 7,120 — —374,820 355,110 — 17,500Other servicesAuditors of the Company — KPMGTaxation services 455,746 51,605 — —Other professional services 239,482 302,096 — —The audit fees for the Company have been borne by the Group.2008$695,228 353,701 — —8. INCOME TAX2009$’000ConsolidatedRestated2008$’0002009$’000CompanyRestated2008$’000Recognised in the income statementCurrent tax expense/(benefit)Current year 52,574 (1,253) 59,045 (2,520)Foreign tax losses not recognised in current year 42 1,019 — —Prior year adjustments (2,033) 75 — —50,583 (159) 59,045 (2,520)Deferred tax expenseOrigination and reversal of temporary differences 10,377 7,339 8,129 1,721Total income tax expense/(benefit) in income statement 60,960 7,180 67,174 (799)Numerical reconciliation between tax benefit and pre-tax net profitAccounting profit before income tax 164,213 21,207 174,655 2,920Prima facie income tax expense calculated at 30% (2008:30%) 49,264 6,362 52,397 876Adjustment for:Equity settled share based payments 452 446 — —Non-deductible accounting interest on deferred purchase — 99 — —Non-deductible expenses 344 43 282 —Amortisation of customer contracts 1,554 411 — —Effect of tax rate in foreign jurisdictions 41 323 — —Foreign income taxable in Australia — — 191 257Foreign tax loss not recognised 42 1,020 — —Investment allowance (725) — — —Impairment of intangibles 16,993 — 16,993 —Research and development allowance (2,008) (1,317) — —Dividend received from subsidiaries not assessable — — (2,689) (1,650)Acquisition cost deductible for tax purposes — (282) — (282)Utilisation of capital losses not previously recognised (2,964) — — —62,993 7,105 67,174 (799)Income tax (over)/under provided in prior year (2,033) 75 — —Income tax expense/(benefit) attributable to operating profit 60,960 7,180 67,174 (799)
annual report 200933financial report9. EARNINGS PER SHAREBasic earnings per shareThe calculation of basic earnings per share at 30 June 2009 was based on the profit attributable to ordinary shareholders of$103,253,000 (2008 restated: $14,027,000) and a weighted average number of ordinary shares outstanding of 66,128,935(2008: 54,892,487) calculated as follows:2009NumberConsolidated2008NumberWeighted average number of ordinary shares (basic)Issued ordinary shares at 1 July 59,257,134 54,200,536Effect of shares issued 7,589,754 520,679Effect of shares bought back and cancelled (919,882) —Effect of exercise of management rights 201,929 171,272Weighted average number of ordinary shares (basic) at 30 June 66,128,935 54,892,487Diluted earnings per shareThe calculation of diluted earnings per share at 30 June 2009 was based on the profit attributable to ordinary shareholders of$103,273,000 (2008 restated: $16,214,000) and a weighted average number of shares outstanding of 68,903,050 (2008: 65,195,367)calculated as follows:Consolidated2009$’000Restated2008$’000Profit attributable to ordinary shareholders (diluted)Profit attributable to ordinary shareholders 103,253 14,027Interest expense on convertible notes, net of tax 20 2,187Profit attributable to ordinary shareholders (diluted) for the year ended 30 June 103,273 16,2142009Number2008NumberWeighted average number of ordinary shares (diluted)Weighted average number of ordinary shares (basic) 66,128,935 54,892,487Effect of conversion of convertible notes 86,745 7,732,764Effect of share options on issue 2,687,370 2,570,116Weighted average number of ordinary shares (diluted) at 30 June 68,903,050 65,195,367The average market value of the Company’s shares for the purposes of calculating the dilutive effect of convertible notes and optionswere based on quoted market prices for the period that the notes and options were outstanding.10. CASH AND CASH EQUIVALENTSConsolidated2009$’0002008$’000Company2009$’000Bank balances 96,317 16,612 95,083 5,5192008$’000
annual report 200934financial report11. TRADE AND OTHER RECEIVABLESNoteConsolidated2009$’0002008$’000Company2009$’0002008$’000CurrentTrade debtors (net of impairment losses) 50,048 50,158 — —Retentions — 66 — —Other receivables 6,669 624 — —Other loans 3,016 6,789 2,897 —Impairment loss on other loans — (6,789) — _Loan to related entity 34 — 6,064 — 6,06459,733 56,912 2,897 6,064Non-currentLoans to associate 24,029 — 24,029 —Loans to controlled entities — — 175,979 49,88924,029 — 200,008 49,889Total trade and other receivables 83,762 56,912 202,905 55,953Trade debtors are shown net of impairment losses of $7,568,000 (2008: $349,000). The Company has advanced funds to CuadrillaResources Limited, an associate, to develop its acreage which it has acquired or in the process of acquiring in Europe (see note 16 forfurther details).12. INVENTORIESConsolidated2009$’000Restated2008$’0002009$’000Company2008$’000Materials and consumables 5,427 1,720 — —Construction work in progress 55,962 40,685 — —61,389 42,405 — —Construction work in progress comprises:Contract costs incurred to date 789,233 585,528 — —Profit recognised to date 102,935 61,218 — —892,168 646,746 — —Less: progress billings (836,206) (606,061) — —Net construction work in progress 55,962 40,685 — —During the year ended 30 June 2009, materials, consumables and work in progress recognised as cost of sales have been expensed aspart of material costs and sub-contractor costs in the income statement.13. OTHER ASSETSConsolidated2009$’0002008$’000Company2009$’000Prepayments 907 1,717 — 1842008$’000
annual report 200935financial report14. Property, PLANT AND EQUIPMENTLeaseholdimprovements$’000Land &buildings$’000Plant &equipment$’000Leased plant& equipment$’000Capital worksin progress$’000Total$’000Consolidated 2009At cost 1,364 4,396 110,390 51,125 15,412 182,687Accumulated depreciation/amortisation (39) (149) (31,278) (12,770) — (44,236)1,325 4,247 79,112 38,355 15,412 138,451Consolidated 2008At cost 24 4,306 45,316 31,235 2,750 83,631Accumulated depreciation/amortisation (10) (18) (18,678) (8,939) — (27,645)14 4,288 26,638 22,296 2,750 55,986ReconciliationsReconciliations of the carrying amounts for each class of property, plant and equipment are set out below.Leaseholdimprovements$’000Land &buildings$’000Plant &equipment$’000Leased plant& equipment$’000Capital worksin progress$’000Total$’000Consolidated 2009Carrying amount at 1 July 2008 14 4,288 26,638 22,296 2,750 55,986Additions 1,350 — 15,446 11,347 23,683 51,826Acquisitions through business combinations — — 39,548 10,314 — 49,862Disposals — — (371) (1,014) — (1,385)Transfer between classes of assets — — 11,021 — (11,021) —Depreciation (39) (41) (13,170) — — (13,250)Amortisation — — — (4,588) — (4,588)Carrying amount at 30 June 2009 1,325 4,247 79,112 38,355 15,412 138,451Consolidated 2008Carrying amount at 1 July 2007 24 — 18,580 12,315 2 30,921Additions 749 4,306 7,273 8,521 2,748 23,597Acquisitions through business combinations — — 7,057 4,164 — 11,221Disposals (743) — (232) (99) — (1,074)Depreciation (16) (18) (6,040) — — (6,074)Amortisation — — — (2,605) — (2,605)Carrying amount at 30 June 2008 14 4,288 26,638 22,296 2,750 55,98615. INVESTMENTSConsolidated2009$’0002008$’000Company2009$’0002008$’000Investments - listed entities (available-for-sale financial asset) 1,000 24,875 1,000 24,875Investments - other 316 1,240 3,614 2,004Deferred expenditure — 41 — —1,316 26,156 4,614 26,879The Company’s investment in listed entities as at 30 June 2008 comprised its interest in Sydney Gas Limited. This investment wasdisposed of during the current financial year.The Group’s investments in listed entities are listed on the Australian Securities Exchange. For such investments classified asavailable-for-sale, a 2% change in the share price at reporting date would have changed equity by $14,000 after tax (2008: an increaseof $348,000 after tax).
annual report 200936financial report16. Investments in equity accounted investeesConsolidatedCompanyName of investeeOwnership2009Carrying value$’0002008Carrying value$’0002009Carrying value$’0002008Carrying value$’000Cuadrilla Resources Limited (associate) 11.5% 1,504 — 1,504 —Arawn Energy Limited (associate) 60% 6,409 — — —Marais-<strong>Lucas</strong> Technologies Pty Limited(joint venture) 50% 267 — — —8,180 — 1,504 —Summary financial information for the equity accounted investee not adjusted for the percentage ownership held by the Group is asfollows:Name of investeeCurrentassets$’000Non-currentassets$’000Totalassets$’000Currentliabilities$’000Non-currentliabilities$’000Totalliabilities$’000Cuadrilla Resources Limited (associate) 10,526 15,641 26,167 22,458 — 22,458Arawn Energy Limited (associate) 423 6,438 6,861 423 — 423Marais-<strong>Lucas</strong> Technologies Pty Limited(joint venture) 101 1,776 1,877 327 1,016 1,34311,050 23,855 34,905 23,208 1,016 24,224During the year, the Group acquired an 11.5% shareholding in Cuadrilla Resources Limited. The company was established to search forshale gas in Europe and has applied for acreage in the UK, Spain, Netherlands and Poland.The Company holds a 60% interest in Arawn Energy Limited, a Canadian company which owns a coal seam gas prospect in BritishColumbia in Canada. Two wells have been drilled and an assessment is being carried out of the extent of the gas reserves. <strong>Lucas</strong> doesnot control this Company.During the year, the Group incorporated a joint venture company with Groupe Marais SA of France to promote the use of Marais’specialist trenching machines for the installation of telecommunications networks in Australia and certain Asian countries. The jointventure company is equally owned by both investors, with neither having control. The investee purchased its first machine during theyear but otherwise did not trade.The Group’s share of profit of equity accounted investee’s for the current year is $nil (2008: $nil).17. Exploration assetsConsolidated2009$’0002008$’000Company2009$’0002008$’000CostBalance at 1 July 4,100 6,175 — —Acquisitions 6,663 12,387 — —Transferred to equity accounted investments (6,409) — — —Transferred to development assets — (14,462) — —Balance at 30 June 4,354 4,100 — —
annual report 200937financial report18. Intangible Development assetsGas assets$’000ConsolidatedOther$’000Total$’000CostBalance at 30 June 2007 — 2,376 2,376Acquisitions — 126 126Transferred from exploration assets 14,462 — 14,462Balance at 30 June 2008 14,462 2,502 16,964Acquisitions — 116 116Disposals (14,462) — (14,462)Transferred from exploration assets — — —Balance at 30 June 2009 — 2,618 2,618AmortisationBalance at 30 June 2007 — 1,330 1,330Amortisation for the year — 182 182Balance at 30 June 2008 — 1,512 1,512Amortisation for the year — 228 228Balance at 30 June 2009 — 1,740 1,740Carrying amountsAt 1 July 2007 — 1,046 1,046At 30 June 2008 14,462 990 15,452At 1 July 2008 14,462 990 15,452At 30 June 2009 — 878 878The balance of gas assets as at 30 June 2008 related to the Group’s interest in the Gloucester Basin coal seam gas reserve. This assetwas disposed of during the year.
annual report 200938financial report19. Other INTANGIBLE ASSETSCustomerRelationships$’000ConsolidatedGoodwill$’000Net profitinterest (1)$’000Total$’000Goodwill$’000CompanyNet profitinterest (1)$’000Total$’000CostBalance at 1 July 2007 4,758 5,432 — 10,190 2,061 — 2,061Acquisitions — through businesscombinations 5,505 2,559 — 8,064 — — —Balance at 30 June 2008 10,263 7,991 — 18,254 2,061 — 2,061Balance at 1 July 2008 10,263 7,991 — 18,254 2,061 — 2,061Acquisitions — — 56,644 56,644 — 56,644 56,644Acquisitions — through businesscombinations 8,456 104,525 — 112,981 — — —Balance at 30 June 2009 18,719 112,516 56,644 187,879 2,061 56,644 58,705Amortisation and impairment lossesBalance at 1 July 2007 1,785 1,600 — 3,385 — — —Amortisation for the year 2,590 — — 2,590 — — —Balance 30 June 2008 4,375 1,600 — 5,975 — — —Balance at 1 July 2008 4,375 1,600 — 5,975 — — —Amortisation for the year 5,809 — — 5,809 — — —Impairment loss — — 56,644 56,644 — 56,644 56,644Balance at 30 June 2009 10,184 1,600 56,644 68,428 — 56,644 56,644Carrying amountsAt 1 July 2007 2,973 3,832 — 6,805 2,061 — 2,061At 30 June 2008 5,888 6,391 — 12,279 2,061 — 2,061At 1 July 2008 5,888 6,391 — 12,279 2,061 — 2,061At 30 June 2009 8,535 110,916 — 119,451 2,061 — 2,061(1) <strong>Lucas</strong> has a 10% net profit interest (NPI) in oil and gas leasehold interests in the Monument Prospect (“the Prospect”) located inTrinity Country, East Texas, USA. The NPI entitles the Company to:(i) A 10% interest in, the gross production revenue earned from the leases less all costs incurred in acquiring and developing theProspect and generating the revenue; and(ii) A 10% interest in, the gross proceeds from the sale or transfer of the leasehold interest less all costs incurred in acquiring anddeveloping the Prospect at the time of sale or transfer.When the NPI investment was made, management was of the view that it had acquired an exploration and evaluation assetwithin the scope of AASB 6 Exploration for and Evaluation of Mineral Resources. Under this accounting standard, exploration andevaluation assets are assessed for impairment only when facts and circumstances suggest that the carrying amount of the assetmay exceed its recoverable amount, or upon transfer to development assets. Unlike other assets, there is no requirement to assesswhether an indicator of impairment exists at each reporting date until the Company has sufficient information to reach a conclusionabout commercial viability and the feasibility of extraction.As a result of further advice obtained by the Company and following the negotiation and execution of documentation, the assetwas reclassified as an intangible asset within the scope of AASB 138 Intangible Assets given that it represents a contractual right tofuture income streams. As a result, the Company was required to test the asset for impairment. Given that the Prospect remainsin an early stage of exploration and evaluation, the Company was unable to prepare discounted cash flow analysis to support thecarrying value of the Prospect and accordingly, was required to impair this asset at 30 June 2009.It should be noted that the Company considers that further exploration and evaluation activity should allow an assessment offuture cash flows to be performed.
annual report 200939financial reportImpairment tests for cash generating units containing goodwillFor the purpose of impairment testing, goodwill is allocated to the Group’s operating divisions which represent the lowest level withinthe Group at which the goodwill is monitored for internal management purposes.The aggregate carrying amounts allocated to each unit are:ConsolidatedCompany2009$’0002008$’0002009$’0002008$’000Drilling 107,084 2,559 — —Construction and infrastructure 3,832 3,832 2,061 2,061Oil and gas — — — —110,916 6,391 2,061 2,061The recoverable amount of the cash generating unit is based on value in use calculations. The calculations use cash flow projections based onthe following year’s budget and plan extended over a period of 5 years. A post-tax discount rate of 8.65% is applied adjusted for the risk of theindustry in which each unit operates. The growth rate used in determining the terminal value of the cash generating units was 2.5%.20. DEFERRED TAX ASSETS AND LIABILITIESRecognised deferred tax assets and liabilitiesDeferred tax assets and liabilities are attributable to the following:2009$’000Assets Liabilities NetRestated2008$’0002009$’000Restated2008$’0002009$’000Restated2008$’000ConsolidatedConstruction work in progress — — (16,184) (10,018) (16,184) (10,018)Intangibles — — (77) (266) (77) (266)Intangible development costs — — (243) (254) (243) (254)Exploration, evaluation and development expenditure — — (1,239) (5,118) (1,239) (5,118)Convertible note issue cost — — — (5) — (5)Property, plant and equipment (35) — — — (35) —Impairment of trade debtors 2,291 2,180 — — 2,291 2,180Provisions for employee benefits 2,207 1,650 — — 2,207 1,650Trade creditors 1,040 1,225 — — 1,040 1,225Other creditors and accruals 351 224 — — 351 224Unrealised foreign exchange differences 313 301 — — 313 301Tax value of loss carry-forwards recognised — 8,344 — — — 8,344Tax assets/(liabilities) 6,167 13,924 (17,743) (15,661) (11,576) (1,737)Set off of tax (6,167) (13,924) 6,167 13,924 — —Net tax liabilities — — (11,576) (1,737) (11,576) (1,737)2009$’000Assets Liabilities Net2008$’0002009$’0002008$’0002009$’0002008$’000CompanyConvertible note issue cost — — — (5) — (5)Unrealised foreign exchange differences 276 276 — — 276 276Tax value of loss carry-forwards recognised — 8,134 — — — 8,134Tax assets/(liabilities) 276 8,410 — (5) 276 8,405Set off of tax — (5) — 5 — —Net tax assets 276 8,405 — — 276 8,405
annual report 200940financial report20. DEFERRED TAX ASSETS AND LIABILITIES (cont)Movement in temporary differences during the year:RestatedBalance01 Jul 08$’000Recognisedin income$’000ConsolidatedAcquiredin businesscombinations$’000Balance30 Jun 09$’000Balance01 Jul 08$’000CompanyRecognisedin income$’000Utilisationof c/f taxlosses$’000Balance30 Jun 09$’0002009Construction work in progress (10,018) (6,166) — (16,184) — — — —Intangibles (266) 189 — (77) — — — —Intangible development costs (254) 11 — (243) — — — —Exploration, evaluation anddevelopment expenditure (5,118) 3,879 — (1,239) — — — —Convertible note issue cost (5) 5 — — (5) 5 — —Property, plant and equipment — (35) — (35) — — — —Doubtful debts impairmentrecognised 2,180 111 — 2,291 — — — —Provisions for employee benefits 1,650 19 538 2,207 — — — —Trade creditors 1,225 (185) — 1,040 — — — —Other creditors and accruals 224 127 — 351 — — — —Unrealised foreign exchangedifferences 301 12 — 313 276 — — 276Value of carried forward incometax losses recognised 8,344 (8,344) — — 8,134 (8,134) — —(1,737) (10,377) 538 (11,576) 8,405 (8,129) — 276Balance01 Jul 07$’000RestatedRecognisedin income$’000ConsolidatedAcquiredin businesscombinations$’000RestatedBalance30 Jun 08$’000Balance01 Jul 07$’000CompanyRecognisedin income$’000Utilisationof c/f taxlosses$’000Balance30 Jun 08$’0002008Construction work in progress (6,110) (3,908) — (10,018) — — — —Intangibles (631) 365 — (266) — — — —Intangible development costs (274) 20 — (254) — — —Exploration, evaluation anddevelopment expenditure (2,082) (3,036) — (5,118) — — — —Convertible note issue cost (244) 239 — (5) (244) 239 — (5)Property, plant and equipment 15 (15) — — — — — —Doubtful debts impairmentrecognised 2,177 3 — 2,180 — — — —Provisions for employee benefits 974 676 — 1,650 — — — —Trade creditors 971 254 — 1,225 — — — —Other creditors and accruals 192 32 — 224 — — — —Unrealised foreign exchangedifferences 310 (9) — 301 276 — — 276Value of carried forward incometax losses recognised 10,304 — (1,960) 8,344 10,094 — (1,960) 8,1345,602 (5,379) (1,960) (1,737) 10,126 239 (1,960) 8,405Unrecognised deferred tax assetsAs at 30 June 2009, the Group had not recognised deferred tax assets of $1,158,697 (2008: $1,117,811) in relation to foreign income taxlosses. The Company did not have any unrecognised deferred tax assets.
annual report 200941financial report21. TRADE AND OTHER PAYABLES Consolidated Company2009$’0002008$’0002009$’0002008$’000CurrentTrade payables 30,866 60,048 — 376Other payables and accruals 39,501 23,026 1,267 256Loan from related party 4,279 — 4,279 —Hedge liability 2,392 — — —77,038 83,074 5,546 632Non-currentOther loans - controlled entities — — 19,677 29,361Other than the loan from the Company’s Hong Kong subsidiary of $106,732 (2008: $12,337,328), the loans payable to controlled entities wereinterest free and unsecured. The loans payable to controlled entities are not repayable for at least 12 months from balance date. The Group’sexposure to currency and liquidity risk related to trade and other payables is disclosed in note 28.22. INTEREST-BEARING LOANS AND borrowingsConsolidated2009$’0002008$’0002009$’000Company2008$’000CurrentBank overdraft — secured — 867 — —Other borrowings — unsecured — 716 — —Other borrowings — secured — 1,779 — —Deferred subsidiary acquisition consideration — unsecured 18,500 3,250 — —Bank loans — secured (1) 71,508 9,200 — 4,500Lease liabilities — secured (1) 33,062 4,184 — —123,070 19,996 — 4,500Non-currentLease liabilities — secured — 13,760 — —Other borrowings — secured — 2,582 — —Deferred subsidiary acquisition consideration — unsecured 2,323 5,476 — —Bank loans — secured — 28,492 — 17,500Redeemable convertible preference shares — unsecured 43,172 — 43,172 —Convertible notes — unsecured — 726 — 72645,495 51,036 43,172 18,226Financing facilities(a) The Group has access to the following lines of credit and bank guaranteesBank overdraft — secured 8,500 8,500 8,500 8,500Other borrowings — secured — 4,361 — —Lease liabilities — secured 41,835 29,501 — —Bank loan — secured 71,508 37,692 — 22,000121,842 80,054 8,500 30,500Total facilities utilised at balance date:Bank overdraft — secured — 867 — —Less: Right of set off — (867) — —Other borrowings — secured — 4,361 — —Lease liabilities — secured 33,063 17,944 — —Bank loan — secured 71,508 37,692 — 22,000104,570 59,997 — 22,000Total facilities not utilised at balance date:Bank overdraft — secured 8,500 8,500 8,500 8,500Other borrowings — secured — — — —Lease liabilities — secured 8,772 11,557 — —Bank loan — secured — — — —17,272 20,057 8,500 8,500(1) Bank loans and lease liabilities have been reclassified to current due to the breach of borrowing covenants. Refer note 1 (B).
annual report 200942financial report22. INTEREST-BEARING LOANS AND liabilities (cont) Consolidated Company2009$’0002008$’0002009$’0002008$’000(b) Bond facilities provided by surety entitiesBond facilities in aggregate 50,000 50,000 — —Amount utilised 34,299 30,788 — —Unused bond facilities 15,701 19,212 — —Bank indemnity guarantee 6,084 5,084 2,536 3,557Amount utilised 3,418 4,381 2,200 —Unused bond facilities 2,666 703 336 3,557Bank standby letter of credit 7,200 2,900 — 2,900Amount utilised — 2,900 — 2,900Unused bond facilities 7,200 — — —Of the bonds utilised, $17,046,127 (2008: $26,931,133) are on projects which are yet to achieve practical completion.Loans and debt repayment scheduleTerms and conditions of outstanding loans were as follows:Nominalinterest rate%Financialyear ofmaturity2009$’0002008$’000ConsolidatedBank overdraft 9.25 2009 — 867Secured bank loan 6.19 2012 (1) 7,042 8,842Secured bank loan 6.34 2015 (1) 3,950 4,550Secured bank loan 7.94 2009 — 20,000Secured bank loan 7.82 2009 — 2,000Secured bank loan 5.60 2011 (1) 48,001 —Secured bank loan 6.16 2010 10,242 2,300Other borrowings - secured 6.16 2010 2,273 4,265Other borrowings - secured 9.5 2009 — 96Other borrowings - unsecured 2.97 2009 — 716Deferred subsidiary acquisition consideration — 2009 - 2011 4,323 5,976Deferred subsidiary acquisition consideration 4.25 2010 1,500 2,750Deferred subsidiary acquisition consideration — 2010 15,000 —Convertible notes 10.00 2010 — 726Redeemable convertible preference shares 11.00 2014 43,172 —Financial lease liabilities Avg 8.90 2009 - 2013 (1) 33,062 17,944168,565 71,032CompanySecured bank loan 7.94 2009 — 20,000Secured bank loan 7.82 2009 — 2,000Convertible notes 10.00 2010 — 726Redeemable convertible preference shares 11.00 2014 43,172 —43,172 22,726All loans are denominated in Australian dollars.(1) Bank loans and lease liabilities have been disclosed as current due to the breach of borrowing covenants. Refer to note 1 (B).Bank facilitiesThe bank overdraft, bank loans, indemnity guarantee and standby letter of credit are all secured by a registered fixed and floatingcharge over all the assets of the Group.
annual report 200943financial reportRedeemable convertible preference sharesThe redeemable convertible preference shares were allotted on 8 December 2008 and the issue proceeds applied to repayment of thebridging finance for the acquisition of Mitchell Drilling (Refer to note 33).The principal terms of the Redeemable Convertible Preference Shares are:Term:5 yearsRanking:In priority to ordinary shares for the payment of dividends and the payment of capital on a winding up of the CompanyDividend Rate:Conversion Price:11% per annum payable semi-annually and cumulative$7.20 per share subject to various anti-dilution terms including on:• A bonus issue of Ordinary Shares• A rights issue or placement where the issue price is less than 90% of the current market price• A special dividend or return of capital in excess of an annual yield of 3.5% of the VWAP• A buy-back at greater than 110% of the VWAPEstimate of dilution: 6,250,000 ordinary shares (if converted)Voting Rights:No right to vote except:• when a dividend is in arrears• to vary the rights of the Redeemable Convertible Preference Shares or on certain other resolutionsconcerning the wind up of the Company• to reduce the share capital• with regards to the disposal of any of the Group’s businesses or to approve the terms of a buy-backConsolidatedCompany2009 2008 2009 2008$’000 $’000 $’000 $’000Proceeds of issue of redeemable convertible preference shares 45,000 — 45,000 —Transaction costs - capitalised (2,203) — (2,203) —Transaction costs - amortised 375 — 375 —Carrying amount at end of year 43,172 — 43,172 —Convertible notesConsolidatedCompany2009 2008 2009 2008$’000 $’000 $’000 $’000Carrying amount at beginning of year 726 24,188 726 24,188Accreted interest capitalised — — — —Redemption of notes — (1,500) — (1,500)Conversion of notes (726) (22,756) (726) (22,756)Proceeds of issue of convertible notes — — — —Transaction costs — 794 — 794Carrying amount at end of year — 726 — 726
annual report 200944financial report22. INTEREST-BEARING LOANS AND liabilities (cont)Finance lease facilitiesThe Group’s lease liabilities are secured by the leased assets of $38,355,000 (2008: $22,256,000) which, in the event of default, revertto the lessor.ConsolidatedCompany2009$’0002008$’0002009$’0002008$’000Finance lease liabilitiesPaymentsWithin one year 11,904 5,518 — —Between one and five years 25,790 15,509 — —37,694 21,027 — —Less: interestWithin one year (2,214) (1,334) — —Between one and five years (2,418) (1,749) — —(4,632) (3,083) — —Total lease liabilities 33,062 17,944 — —Lease liabilities provided for in the financial statements:Current (1) 33,062 4,184 — —Non-current — 13,760 — —Total lease liabilities 33,062 17,944 — —The Group leases plant and equipment under finance leases expiring from one to four years. At the end of the lease terms, the Grouphas the option to purchase the plant and equipment.(1) Lease liabilities were reclassified as current due to the breach of borrowing covenants. Refer to note 1 (B).23. CURRENT TAX LIABILITiesThe current tax liability for the Group of $50,797,000 (2008: $114,000) and for the Company of $50,454,000 (2008: $nil) represents theamount of income tax payable in respect of current and prior financial periods. The Company’s liability includes the income tax payableby all members of the tax consolidated group.24. PROVISIONSConsolidated2009$’0002008$’000Company2009$’000Provision for contractual dispute — 3,799 — —The contractual dispute which was provided for as at 30 June 2008 was settled during the financial year.2008$’00025. OPERATING LEASESConsolidated2009$’0002008$’000Company2009$’0002008$’000Non-cancellable operating lease rentals are payable as follows:Less than one year 3,704 985 — —Between one and five years 6,307 1,164 — —10,011 2,149 — —The Group leases property under non-cancellable operating leases expiring from one to three years. The leases generally provide the Groupwith a right of renewal. During the financial year, $2,913,000 (2008: $1,109,000) was recognised as an expense in the income statement inrespect of operating leases.
annual report 200945financial report26. EMPLOYEE BENEFITSConsolidated2009$’0002008$’000Company2009$’0002008$’000Provision for employee benefits, including on-costs:Current 6,542 4,751 — —Non-current 730 748 — —7,272 5,499 — —Superannuation plansBenefits provided under the superannuation funds to which the Group contributes are based on accumulated contributions and earningsfor each employee. The Group has a legal obligation to contribute to the funds in accordance with the Superannuation GuaranteeCharge legislation. The amount recognised as an expense for the financial year was $8,262,782 (2008: $4,375,341). The Company has noemployees and accordingly no defined contribution plans were sponsored by the Company.Employee share planThe Company has three employee incentive schemes for employees of the Group that were approved by shareholders in annual generalmeetings. Total securities granted but unissued under these schemes cannot exceed 15% of the total number of shares on issue.a) Management rights plan: The management rights plan (MRP) is available to employees, directors and other persons at thediscretion of the Board. Nominated persons are granted rights to acquire shares in the Company. The issue of these rights can take theform of the award of shares for no monetary consideration, traditional priced options or performance rights (which have no exerciseprice).Each right is convertible to one ordinary share. There are no voting or dividend rights attaching to the rights nor are there votingrights attaching to the unissued ordinary shares.The terms and conditions of grants made during the year ended 30 June 2009 are as follows:Grant date Number of rights Vesting conditions Vesting date Expiry date26 Nov 2008 144,787 Remain in service to vesting date 30 Jun 2010 30 Jun 201226 Nov 2008 93,861 Remain in service to vesting date 30 Jun 2011 30 Jun 2013The fair value of services received in return for the rights granted was calculated using a Black-Scholes pricing model with the followinginputs:Grant date No. of rights Expiry dateShare price ongrant dateExercisepriceRisk-freeinterest rateExpecteddividend yieldFair value atgrant date26 Nov 2008 144,787 30 Jun 2012 $4.60 — 3.2% 2.4% $4.4226 Nov 2008 93,861 30 Jun 2013 $4.60 — 3.6% 2.4% $4.27As the rights have no exercise price, the valuation took no account of the expected volatility of the underlying share price as this doesnot influence the value of the rights.The number and weighted average exercise prices of rights are as follows:Weighted averageexercise price2009Number of rights2009Weighted averageexercise price2008Number of rights2008Outstanding at beginning of the period $0.39 2,921,429 $0.58 1,048,333Forfeited during the period — — — —Exercised during the period — (611,429) — (234,333)Granted during the period — 238,648 $0.25 2,107,429Outstanding at end of the period $0.44 2,548,648 $0.39 2,921,429Exerciseable at end of the period — 390,937 — 633,183
annual report 200946financial report26. EMPLOYEE BENEFITS (cont)The options outstanding at 30 June 2009 have an exercise price in the range of $nil to $2.11 and a weighted average contractual life of2.9 years.During the financial year, 611,429 share options were exercised (2008: 234,333). The weighted average share price at the dates ofexercise was $4.01 (2008: $2.63).During the year the Group recognised as an expense $1,507,974 (2008: $1,494,000) in relation to share based payments. The liabilityat year end for cash settled rights is $404,418 (2008: $613,873). The carrying amount of the liability at 30 June 2008 was settled duringthe year ended 30 June 2009. All rights holders electing to exercise their rights entitlements during the year were settled by acquiringshares. No rights were exercised and settled by cash.The fair value of the rights granted in previous years has been calculated using a Black-Scholes pricing model and allocated to eachreporting period evenly over the period from grant date to vesting date. The value disclosed is the portion of the fair value of the rightsallocated to this reporting period.The following factors and assumptions were used in determining the fair value of rights on grant date for those share basedpayments granted in previous years:Grant dateExpiry dateShare price ongrant dateExercisepriceExpectedvolatilityRisk freeinterest rateExpecteddividend yieldFair valueat grant date23 Nov 2007 23 Nov 2012 $3.40 $2.11 51% 6.4% 2.2% $1.7031 Aug 2007 31 Aug 2012 $2.11 — 49% - 56% 6.2% - 6.3% 2.8% $1.88 - $2.0524 Nov 2006 24 Nov 2011 $1.08 $1.10 44% 5.7% 4.8% $0.25b) Deferred share plan: The deferred share plan (DSP) is available to chosen directors, including non-executives, andemployees to allow them to take a part of their annual remuneration in the form of shares in the Company. Shares vest from the dateof issue but cannot be disposed of until the earlier of 10 years from the date of issue or the date their employment or service with theGroup ceases. No shares were issued in either of the last two years.c) Employee share acquisition plan: The employee share acquisition plan (ESAP) is available to all eligible employees toacquire ordinary shares in the Company for no consideration as a bonus component of their remuneration. The ESAP complies withcurrent Australian tax legislation, enabling permanent employees to have up to $1,000 of free shares per annum, in respect of anemployee share scheme, excluded from their assessable income.Employees must have been employed by any entity within the Group for a minimum period of one year to be eligible. Shares issuedunder the ESAP rank equally with other fully paid ordinary shares including full voting and dividend rights from the date they vest. Noconsideration for the shares is receivable from the employees.Shares are issued in the name of the participating employee and vest from the date of issue. However, they cannot be disposed ofuntil the earlier of 3 years from the date of issue or the date their employment with the Group ceases. The Board has the discretion tovary this restriction. The ESAP has no conditions that could result in a recipient forfeiting ownership of shares.No shares were issued under this plan in either of the last two years.
annual report 200947financial report27. CAPITAL AND RESERVESReconciliation of movement in capital and reserves attributable to equity holders of the parent:Employee equitybenefit reserve$’000Translationreserve$’000Share capital$’000Hedgingreserve$’000RestatedRetainedearnings/(accumulatedlosses)$’000Total equity$’000ConsolidatedBalance at 1 July 2007 785 306 30,655 — (663) 31,083Total recognised income and expense — 274 — — 14,027 14,301Dividends to equity holders — — — — (3,273) (3,273)Issue of ordinary shares — — 23,382 — — 23,382Equity settled share based payments 871 — — — — 871Balance at 30 June 2008 1,656 580 54,037 — 10,091 66,364Balance at 1 July 2008 1,656 580 54,037 — 10,091 66,364Total recognised income and expense — 277 — (2,392) 103,253 101,138Dividends to equity holders — — — — (6,358) (6,358)Issue of ordinary shares — — 46,178 — — 46,178Share bought back and cancelled — — (8,361) — — (8,361)Equity settled share based payments 716 — 81 — — 797Balance at 30 June 2009 2,372 857 91,935 (2,392) 106,985 199,757CompanyBalance at 1 July 2007 — — 30,736 — (8,282) 22,454Total recognised income and expense — — — — 3,719 3,719Dividends to equity holders — — — — (3,273) (3,273)Issue of ordinary shares — — 23,382 — — 23,882Balance at 30 June 2008 — — 54,118 — (7,836) 46,282Balance at 1 July 2008 — — 54,118 — (7,836) 46,282Total recognised income and expense — — — — 107,481 107,481Dividends to equity holders — — — — (6,358) (6,358)Issue of ordinary shares — — 46,178 — — 46,178Share bought back and cancelled — — (8,361) — — (8,361)Equity settled share based payments 2,372 — — — — 2,372Balance at 30 June 2009 2,372 — 91,935 — 93,287 187,594Nature and purpose of reservesEmployee equity benefits reserve: The employee equity benefits reserve represents expense associated with equity-settledcompensation under the employee management rights and short-term and long-term incentive plans.Translation reserve: The translation reserve comprises all foreign currency differences arising from the translation of thefinancial statements of foreign operations.Hedging reserve: The hedging reserve comprises the effective portion of the cumulative net change in the present value of cashflow hedging instruments relating to hedged transactions that have not yet occurred.
annual report 200948financial report27. CAPITAL AND RESERVES (cont)Share capital - ordinary shares2009No. ofSharesCompany2008No. ofSharesMovements during the yearOn issue at 1 July 59,257,134 54,200,536Private placement 5,500,000 —Shares issued for business acquisition 2,754,769 285,550Exercise of rights under the Management Rights Plan 264,000 234,333Shares bought back and cancelled (3,058,487) —Conversion of convertible notes 228,461 4,536,715On issue at 30 June - fully paid 64,945,877 59,257,134Holders of ordinary shares are entitled to receive dividends and, in the event of a winding up of the Company, to any proceeds ofliquidation after all creditors and other stockholders.On a show of hands, every holder of ordinary shares present at a shareholder meeting in person or by proxy is entitled to one voteand upon a poll, each share is entitled to one vote.DividendsDividends recognised by the Company during the current year are:Centsper shareTotal amount$’000Franked/unfrankedDate of paymentFinal 2008 4.5 3,038 15% franked 29 September 2008Interim 2009 5.0 3,320 unfranked 27 March 20096,358Dividend not recognised at year endSince the year end, the directors have recommended a fully franked final dividend of 5.5 cents (2008: 4.5 cents) per share payable on28 September 2009. The declaration and subsequent payment of the dividend has no income tax consequences.The financial effect of this dividend has not been brought to account in the financial statements for the financial year ended30 June 2009 and will be recognised in subsequent financial reports.Dividend franking accountAfter the payment of the dividend recognised at year end and tax payments due within the next financial year, the balance of frankingcredits available to shareholders of the Company for subsequent financial years is $50,845,643 (2008: $48,312). The impact onthe dividend franking account of dividends proposed after balance date but not recognised as a liability will reduce this balance by$3,572,023.28. FINANCIAL INSTRUMENTsOverviewThe Group’s activities expose it to the following risks from their use of financial instruments:• Credit risk;• Liquidity risk; and• Market risk (including currency and interest rate risks).The Board of Directors has overall responsibility for the establishment and oversight of the risk management framework. The Boardhas established the Risk Management Committee, which is responsible for developing and monitoring risk management policies. Thecommittee reports regularly to the Board of Directors on its activities.Risk management policies are established to identify and analyse the risks faced by the Company and Group, to set appropriaterisk limits and controls, and to monitor risks and adherence to limits. Risk management policies and systems are reviewed regularlyto reflect changes in market conditions and the Company’s and Group’s activities. The Company and Group, through their training andmanagement standards and procedures, aim to develop a disciplined and constructive control environment in which all employeesunderstand their roles and obligations.The Audit Committee oversees how management monitors compliance with the Company’s and Group’s risk management policiesand procedures and reviews the adequacy of the risk management framework in relation to the risks faced by the Company and Group.
annual report 200949financial reportCredit riskCredit risk is the risk of financial loss to the Group if a customer or the counterparty to a financial instrument fails to meet itscontractual obligations, and arises principally from the Group’s receivables from customers. For the Company, it arises principally fromreceivables due from subsidiaries.Trade and other receivables: The Company’s and Group’s exposure to credit risk is influenced mainly by the individualcharacteristics of each customer. The Group’s customer base consists of mainly government, semi-government and major public companycustomers. The demographics of the Group’s customer base, including the default risk of the industry and location in which the customersoperate, has less of an influence on credit risk.New customers are analysed individually for creditworthiness, taking into account credit ratings where available, financial position,past experience and other factors. This includes all major contracts and tenders approved by the Group Tender Committee.In monitoring customer credit risk, customers are grouped by business segment, then by their debtor aging profile. Ongoing monitoringof receivable balances minimises exposure to bad debts.A provision for impairment is recognised when there is objective evidence that a individual trade receivable is impaired.Investments: The Group limits its exposure to credit risk by only investing in liquid securities of short maturity issued by a reputableparty or in readily marketable securities listed on a recognisable securities exchange. Given these investment criteria, managementdoes not expect any counterparty to fail to meet its obligations.Guarantees: Group policy is to provide financial guarantees only to wholly-owned subsidiaries.Exposure to credit risk: The carrying amount of financial assets represents the maximum credit exposure. The maximumexposure to credit risk at the reporting date was:ConsolidatedCompany2009$’0002008$’0002009$’0002008$’000Loans and receivables 83,762 56,912 202,905 55,953Bank balances 96,317 16,612 95,083 5,519180,079 73,524 297,988 61,472Maximum exposure to credit risk for loans and receivables at thereporting date by business segment was:Drilling 32,096 15,853 148,875 28,265Construction and infrastructure 24,739 34,305 27,104 6,577Oil and gas 24,029 — 24,029 —Unallocated 2,898 6,754 2,897 21,11183,762 56,912 202,905 55,953Impairment losses: The ageing of the Group and Company’s loans and receivables at the reporting date was:Gross2009$’000ConsolidatedImpairment2009$’000Gross2008$’000Impairment2008$’000The ageing of loans and receivables at the reporting date was:Not past due 73,490 (7,510) 44,889 —Past due up to 30 days 7,878 — 7,826 —Past due 31 to 120 days 5,695 — 2,953 —Past due 121 days to one year 3,840 — 1,253 (9)More than one year 427 (58) 7,187 (7,187)91,330 (7,568) 64,108 (7,196)At year end the balance of impairment in respect of loans and receivables for the Group as at 30 June 2009 was $7,568,000(2008: $7,196,000). A loan of $6,789,000 and a receivable of $349,000 were written off during the prior year. In addition, an impairmentloss for receivables of $7,510,000 was recognised during the current year.
annual report 200950financial report28. FINANCIAL INSTRUMENTs (CONT)Impairment allowance: Based on historic default rates, the Group believe that no impairment allowance is required for loans andreceivables not past due.The impairment allowance related to specific customers, identified as being in trading difficulties, or where specific debts arein dispute. The impairment allowance does not include debts past due relating to customers with a good credit history, or wherepayments of amounts due under a contract for such customers are delayed due to works in dispute and previous experience indicatedthat the amount will be paid in due course.When the Group is satisfied that no recovery of the amount owing is possible, the amounts considered irrecoverable are writtenoff directly against the financial asset. At 30 June 2009, the Group has collective impairments on its trade receivables of $7,568,000(2008: $7,196,000).Liquidity riskLiquidity risk is the risk that the Group will not be able to meet its financial obligations as they fall due. Liquidity is managed to ensure,as far as possible, that sufficient funds are available to meet liabilities when they fall due, under both normal and stressed conditions,without incurring unacceptable losses or risking damage to the Group’s reputation.The Group ensures that it has sufficient cash on demand to meet expected operational expenses, including the servicing of financialobligations, by maintaining excess committed credit facilities of at least $8.5 million. The Group aims at maintaining flexibility infunding by keeping committed credit lines available with a variety of counterparties, with a weighted average duration of at least threeyears. Refer note 22 for details of lines of credit available.The following are the contractual maturities of financial liabilities, including estimated interest payments and excluding the impact ofnetting arrangements:Carryingamount$’000Total$’0006 monthsor less$’000Contractual cash flows6-12months$’0001-2years$’0002-5years$’000More than5 years$’0002009ConsolidatedNon-derivative financial liabilitiesTrade and other payables - unsecured 74,646 (74,646) (74,646) — — — —Subsidiary acquisition deferredconsideration 20,823 (21,000) (18,500) — (2,500) — —Bank loans - secured 71,507 (80,931) (4,886) (18,664) (10,259) (47,122) —Lease liabilities - secured 33,063 (37,695) (6,273) (5,631) (8,827) (16,964) —Redeemable convertible preferenceshares - unsecured 43,172 (69,750) (2,475) (2,475) (4,950) (59,850) —Derivative financial liabilitiesInterest rate swaps used for hedging 2,392 (2,392) — — — (2,392) —245,603 (286,414) (106,780) (26,770) (26,536) (126,328) —2009CompanyRedeemable convertible preferenceshares - unsecured 43,172 (69,750) (2,475) (2,475) (4,950) (59,850) —Trade and other payables - unsecured 5,546 (5,546) (5,546) — — — —Loans from subsidiaries - unsecured 19,677 (19,677) — — — — (19,677)68,395 (94,973) (8,021) (2,475) (4,950) (59,850) (19,677)
annual report 200951financial reportCarryingamount$’000Total$’0006 monthsor less$’000Contractual cash flows6-12months$’0001-2years$’0002-5years$’000More than5 years$’0002008ConsolidatedTrade and other payables - unsecured 83,074 (83,074) (83,074) — — — —Bank overdraft - secured 867 (867) (867) — — — —Other borrowings - unsecured 716 (716) (716) — — — —Other borrowings - secured 4,361 (4,735) (2,013) (691) (1,383) (648) —Subsidiary acquisition deferredconsideration 8,726 (9,250) (3,250) — (3,500) (2,500) —Bank loans - secured 37,692 (43,295) (2,376) (9,523) (21,725) (9,671) —Lease liabilities - secured 17,944 (21,027) (2,873) (2,645) (6,377) (9,132) —Convertible notes - unsecured 726 (892) (37) (37) (818) — —154,106 (163,856) (95,206) (12,896) (33,803) (21,951) —2008CompanyTrade and other payables - unsecured 632 (632) (632) — — — —Bank loans - secured 22,000 (24,609) (732) (5,327) (18,550) — —Loans from subsidiaries - unsecured 29,361 (29,361) — — — — (29,361)Convertible notes - unsecured 726 (892) (37) (37) (818) — —52,719 (55,494) (1,401) (5,364) (19,368) — (29,361)Market riskMarket risk is the risk that changes in market prices, such as foreign exchange rates, interest rates and equity prices will affect theGroup’s income or the value of its holdings of financial instruments. The objective of market risk management is to manage and controlmarket risk exposures within acceptable parameters, while optimising the return.Currency risk: The Group and the Company operate internationally and are exposed to currency risk on sales, purchases andborrowings that are denominated in a currency other than the respective functional currencies of Group entities, primarily with respectto the US dollar, Euro, Hong Kong dollar and Pacific francs.The Group’s major foreign currency exposure relates to sales of services and purchases of raw materials, consumables andequipment. The Group has certain investments in foreign operations whose net assets are exposed to foreign currency translation risk.Currency exposure arising from the net assets of the Group’s foreign operations is managed primarily through borrowings denominatedin the relevant foreign currencies.The Group’s executive team actively monitors foreign currency exposures and where appropriate establish financial instrumentswhich ensure that sound management of currency risk is maintained.Exposure to currency riskThe Group’s exposure to foreign currency risk at balance date was as follows, based on notional amounts in Australian dollars (inthousands):Euro USD XPF NZD HKD2009ConsolidatedTrade payables (263) (564) (64) (13) (11)Net balance sheet exposure (263) (564) (64) (13) (11)2008ConsolidatedTrade receivables and other receivables — 9 — — —Trade payables (4,956) (724) (64) (12) —Net balance sheet exposure (4,956) (715) (64) (12) —
annual report 200952financial report28. FINANCIAL INSTRUMENTs (CONT)Sensitivity analysisAt 30 June 2009, had the Australian dollar weakened/strengthen by 10% against the respective foreign currencies with all other variablesheld constant, the Group post-tax profit and equity would have been $91,500 lower/$91,500 higher had the Australian dollar weakened/strengthened against the respective currencies.The following significant exchange rates applied during the year:Average RateReporting date spotrate2009 2008 2009 2008Euro 0.5419 0.6102 0.5751 0.6055USD 0.7461 0.8968 0.8114 0.9583XPF 64.62 70.36 64.6930 71.6165HKD 5.7947 6.9897 6.2884 7.4380NZD 1.2286 1.1678 1.2428 1.2569Interest rate risk: The Group’s main interest rate risk arises from long-term borrowings. Borrowings issued at variable ratesexpose the Group to cash flow interest rate risk. Borrowings at fixed rates expose the group to fair value interest rate risk. The Groupentered into interest rate hedges during the year to cap exposure to increases in interest rate volatility.Consolidated2009$’0002008$’000Company2009$’0002008$’000Fixed rate instrumentsFinancial assets 1,409 6,064 1,409 6,064Financial liabilities (76,235) (17,420) (43,172) (726)(74,826) (11,356) (41,763) 5,338Variable rate instrumentsFinancial assets 96,317 16,612 95,083 5,519Financial liabilities (73,007) (50,862) — (22,000)23,310 (34,250) 95,083 (16,481)At reporting date, the Group and the Company had the following variable rate borrowings:Weightedaverageinterest rate%30 June 2009 30 June 2008Balance$’000Weightedaverageinterest rate%Balance$’000ConsolidatedBank overdraft — — 11.75 (867)Other borrowings — — 10.25 (5,077)Deferred subsidiary acquisition consideration 4.25 (1,500) 10.50 (7,226)Bank loans 5.68 (71,507) 7.93 (37,692)Net exposure to cash flow interest rate risk (73,007) (50,862)CompanyBank loans — — 7.93 (22,000)Net exposure to cash flow interest rate risk — (22,000)Fair value sensitivity analysis for fixed rate instrumentsThe Group does not account for any fixed rate financial assets and liabilities at fair value through profit or loss, therefore a change ininterest rates at the reporting date would not effect profit or loss for the Group or the Company.
annual report 200953financial reportCash flow sensitivity analysis for variable rate instrumentsA change of 100 basis points in interest rates at the reporting date would have increased/(decreased) equity and profit or loss by$567,330 for the Group (2008: $859,704) and $nil for the Company (2008: $331,000). This analysis assumes that all other variables, inparticular foreign currency rates, remain constant. The analysis is performed consistently from year to year.Other market price risk: Equity price risk arises from available-for-sale equity securities held in a quoted corporation. TheGroup’s investment is managed on an individual basis and all buy and sell decisions are approved by the Risk Management Committee.Fair valuesFair values versus carrying amounts: The fair values of financial assets and liabilities, together with the carrying amountsshown in the balance sheet, are as follows:Carryingamount$’000ConsolidatedFair value$’000Carryingamount$’000CompanyFair value$’0002009Bank balances 96,317 96,317 95,083 95,083Loans and receivables 83,762 83,762 202,905 202,905Investments 1,316 1,316 4,614 4,614Trade and other payables (77,038) (77,038) (5,546) (5,546)Deferred subsidiary acquisition consideration (20,823) (20,823) — —Bank loans (71,507) (71,507) — —Lease liabilities (33,063) (33,063) — —Loans from subsidiaries — — (19,677) (19,677)Redeemable convertible preference shares (43,172) (43,172) (43,172) (43,172)(64,208) (64,208) 234,207 234,207Carryingamount$’000ConsolidatedFair value$’000Carryingamount$’000CompanyFair value$’0002008Bank balances 16,612 16,612 5,519 5,519Loans and receivables 56,912 56,912 55,953 55,953Investments 26,156 29,020 26,879 29,743Trade and other payables (83,074) (83,074) (632) (632)Bank overdraft (867) (867) — —Other borrowings (5,077) (5,077) — —Deferred subsidiary acquisition consideration (8,726) (8,726) — —Bank loans (37,692) (37,692) (22,000) (22,000)Lease liabilities (17,944) (17,944) — —Convertible notes (726) (726) (726) (726)Loans from subsidiaries — — (29,361) (29,361)(54,426) (51,562) 35,632 38,496The following methods and assumptions are used in estimating the fair values of financial instruments:• Loans and borrowings, and finance leases – present value of future principal and interest cash flow, discounted at the market rateof interest at the reporting date• Trade and other receivables and payables – carrying amount equals fair value
annual report 200954financial report28. FINANCIAL INSTRUMENTs (CONT)Capital management: The Board policy is to maintain a strong capital base so as to maintain investor, creditor and marketconfidence and to sustain future development of the business. The Board of Directors monitors the return on capital, which the Groupdefines as net operating income divided by total shareholders’ equity, excluding non-redeemable preference shares and minorityinterests. The Board of Directors also monitors the level of dividends to ordinary shareholders.The Board’s target is for employees (excluding directors) of the Group to hold five percent of the Company’s ordinary shares by 2012.At present employees hold approximately 1.5% of the Company’s ordinary shares, or just under 4% assuming that all outstanding shareoptions vest and are exercised. Currently management is considering structure for extending the Group’s employee share schemesbeyond key management and other senior employees; at present other employees are only periodically allotted shares under theEmployee Share Acquisition Plan (ESAP) under which eligible employees are granted up to $1,000 of free shares per annum.The Board seeks to maintain a balance between the higher returns that might be possible with higher levels of borrowings and theadvantages and security afforded by a sound capital position. The Group’s target is to achieve a return on capital of between 12% and16%; during the year ended 30 June 2009 the return was 15.4% (2008: 15.3%). In comparison, the weighted average interest expenseon interest-bearing borrowings (excluding liabilities with imputed interest) was 5.7% (2008: 5.4%).From time to time, the Group purchases its own shares on market as part of its capital management program and under a definedshare buy-back plan. The timing of these purchases depends on market prices. Alternatively, shares may be purchased on-market tosatisfy the Group’s obligations under its employee share schemes. Buy and sell decisions are made on a specific transaction basis by theBoard. Neither the Company nor any of its subsidiaries are subject to externally imposed capital requirements.29. INTERESTS IN JOINT VENTURESJoint venture namePrincipal activitiesParticipationinterest2009 2008% %Contribution tooperating resultsof the Group2009 2008$’000 $’000Queensland Gas Company Exploration for methane gas (ATP651P) 15 15 — —Amec Spie Capag <strong>Lucas</strong> Engineering, design, procurement & construction of pipeline 50 50 21 121Eastern Pipeline Alliance Pipe laying and related construction activities 46.39 46.83 7,345 16,340Southern SeaWater Alliance Construction and operation of desalination plant 19 — 133 —Included in the assets and liabilities of the Group are the following assets and liabilities employed in the joint ventures.Consolidated2009$’0002008$’000Company2009$’0002008$’000AssetsCurrent assetsCash and cash equivalents 627 3,270 — —Trade and other receivables 2,934 15,079 — —Other 95 131 — —Construction work in progress 2,038 5,615 — —Total current assets 5,694 24,095 — —Non-current assetsExploration assets 4,133 1,582 — —Investment 92 — — —Intangible development assets — 14,462 — —Total non-current assets 4,225 16,044 — —Total assets 9,919 40,139 — —LiabilitiesCurrent liabilitiesTrade and other payables 2,423 16,018 — —Total liabilities 2,423 16,018 — —The exploration and intangible development assets relates to the Group’s interests in the Surat Basin. The recoverability of its carryingamount is dependent of the successful development and commercial exploitation or sale of the area of interest.
annual report 200955financial report30. CONSOLIDATED ENTITIESThe financial statements at 30 June 2009 include the following controlled entities. The financial years of all the controlled entities arethe same as that of the parent entity.Ownership interestName of entityCountry ofincorporationParent entity<strong>AJ</strong> <strong>Lucas</strong> Group LimitedControlled entities<strong>AJ</strong> <strong>Lucas</strong> Operations Pty Limited Australia 100 100<strong>AJ</strong> <strong>Lucas</strong> Plant & Equipment Pty Limited Australia 100 100<strong>AJ</strong> <strong>Lucas</strong> Drilling Pty Limited Australia 100 100<strong>AJ</strong> <strong>Lucas</strong> Pipelines Pty Limited Australia 100 100<strong>AJ</strong> <strong>Lucas</strong> Testing Pty Limited Australia 100 100Smart Electrical & Power Services Pty Limited Australia 100 100<strong>AJ</strong> <strong>Lucas</strong> Joint Ventures Pty Limited Australia 100 100Coastal Sand Technologies Pty Limited Australia 100 100<strong>Lucas</strong> Energy Pty Limited Australia — 100<strong>AJ</strong> <strong>Lucas</strong> (Hong Kong) Limited Hong Kong 100 100<strong>AJ</strong> <strong>Lucas</strong> (USA) Inc. USA 100 100<strong>AJ</strong> <strong>Lucas</strong> Coal Technologies Pty Limited Australia 100 100Wholly owned subsidiary of <strong>AJ</strong> <strong>Lucas</strong> Coal Technologies Pty LimitedMitchell Drilling Corporation Pty Limited Australia 100 —<strong>Lucas</strong> Contract Drilling Pty Limited Australia 100 100Wholly owned subsidiary of <strong>Lucas</strong> Contract Drilling Pty LimitedMcDermott Drilling Pty Limited Australia 100 100<strong>Lucas</strong> Stuart Pty Limited Australia 100 100Wholly owned subsidiaries of <strong>Lucas</strong> Stuart Pty LimitedKetrim Pty Limited Australia 100 100Stuart Painting Services Pty Limited Australia 100 100<strong>Lucas</strong> Stuart Projects Pty Limited Australia 100 100Jaceco Drilling Pty Limited Australia 100 100Geosearch Drilling Service Pty Limited Australia 100 100<strong>Lucas</strong> Energy (UK) Limited England 99 99257 Clarence Street Pty Limited Australia 100 100<strong>Lucas</strong> SARL New Caledonia 100 100<strong>Lucas</strong> Energy (Holdings) Pty Limited Australia 100 —Wholly owned subsidiaries of <strong>Lucas</strong> Energy (Holdings) Pty Limited<strong>Lucas</strong> (Arawn) Pty Limited Australia 100 —<strong>Lucas</strong> Energy (WA) Pty Limited Australia 100 —<strong>Lucas</strong> Energy (ATP651P) Pty Limited Australia 100 —2009%2008%
annual report 200956financial report31. CONTINGENCIES and commitmentsContingenciesThe directors are of the opinion that provisions are not required in respect of these matters, as it is not probable that a future sacrificeof economic benefits will be required or the amount is not capable of reliable measurement.(i) Under the joint venture agreements (see note 29), the relevant <strong>AJ</strong> <strong>Lucas</strong> Group company is jointly and severally liable for allthe liabilities incurred by the joint ventures. As at 30 June 2009, the assets of the joint venture were sufficient to meet suchliabilities. The liabilities of the joint ventures not included in the consolidated financial statements amounted to $2,423,000(2008: $16,018,000)(ii) During the normal course of business, entities within the Group may incur contractor’s liability in relation to their performanceobligations for specific contracts. Such liability includes the potential costs to carry out further works and/or litigation by or againstthose Group entities. Provision is made for the potential costs of carrying out further works based on known claims and previousclaims history, and for legal costs where litigation has been commenced. While the ultimate outcome of these claims cannot bereliably determined at the date of this report, based on previous experience, amounts specifically provided, and the circumstancesof specific claims outstanding, no additional costs are anticipated.(iii) Under the terms of the Class Order described in the note on <strong>AJ</strong> <strong>Lucas</strong> Group Limited and controlled entities, the Company hasentered into approved deeds of indemnity for the cross-guarantee of liabilities with participating Australian subsidiary companies(refer to note 36 for further information).CommitmentsAt 30 June 2009 the Group had commitments contracted but not provided for and payable within one year of $1,729,060 (2008: $nil) forthe purchase of new plant and equipment under finance leases.
annual report 200957financial report32. RECONCILIATION OF CASH FLOWS FROM OPERATING ACTIVITIESNotesConsolidated2009$’000Restated2008$’0002009$’000Company2008$’000(a) Reconciliation of cashFor the purposes of the statements of cash flows, cash includescash at bank, cash on hand and bank overdrafts. Cash as at theend of the financial year as shown in the statements of cashflows is reconciled to the related items in the balance sheet asfollows:Cash assets 10 96,317 16,612 95,083 5,519Bank overdraft 22 — (867) — —Total cash 96,317 15,745 95,083 5,519(b) Cash flows from operating activitiesProfit for the year 103,253 14,027 107,481 3,719Adjustments for: —Interest on capitalised leases 2,501 1,193 — —Interest on deferred acquisition consideration 104 — — —Loss/(gain) on sale of non-current assets 110 (24) — —Interest income receivable — (626) — (626)Dividend income from controlled entity — — (8,961) —Depreciation 13,250 6,074 — —Gain on sale of intangible development asset (215,765) — (215,765) —Gain on sale of listed shares (5,392) — (5,392) —Impairment of intangible assets 56,644 — 56,644 —Amortisation of:Leased assets 4,588 2,605 — —Intangibles 5,809 2,590 — —Development expenditure 228 183 — —Borrowing cost 1,264 794 — 794Operating profit/(loss) before changes in working capital andprovisions (33,406) 26,816 (65,993) 3,887Change in receivables (4,805) (25,222) — 66Change in other current assets 810 (655) 184 (184)Change in inventories (18,359) 12,173 — —Change in payables (17,477) 18,856 (157) 172Change in other liabilities 53 7,897 — —Change in provisions for employee benefits (668) 2,211 — —Change in other provisions — 858 — —Change in loans to controlled entities — — — (9,520)Change in tax balances 60,961 6,862 67,174 1,721Change in employee equity benefit reserve 716 — — —Change in reserves 277 274 — —Net cash from operating activities (11,898) 50,070 1,208 (3,858)(c) Non-cash financing and investment activitiesDuring the year, the Group acquired plant and equipment with an aggregate fair value of $11,347,000 (2008: $8,521,000) by means offinance leases. These purchases are not reflected in the Statements of Cash Flows.(d) Financing arrangementsRefer note 22.
annual report 200958financial report33. ACQUISITION OF SUBSIDIARY2009On 22 August 2008, the Group completed the acquisition of the business of Mitchell Drilling, one of the largest drilling and specialityservices provider to the natural resources sector, most particularly coal seam gas in Queensland. The purchase price excludingacquisition costs amounted to $150.0 million and was satisfied by the issue of 2,645,503 ordinary shares in <strong>AJ</strong> <strong>Lucas</strong> Group to thevendor, $15.0 million in deferred consideration payable one year after acquisition, and the balance from a combination of the cashresources of the Group and increased borrowings.From 22 August 2008 to 30 June 2009, the Mitchell Drilling business contributed profit before tax of $2.69 million. If the acquisitionhad occurred on 1 July 2008, management estimates that for the year ended 30 June 2009, the consolidated revenue would have been$518.1 million and consolidated profit before tax would have been $231.3 million. In determining these amounts, management hasassumed that the fair value adjustments that arose on the date of acquisition would have been the same if the acquisition occurred on1 July 2008.The acquisition had the following effect on the Group’s assets and liabilities on acquisition date:Recognised valueson acquisition$’000Fair value Pre-acquisitionadjustments carrying amounts$’000$’000Cash and cash equivalents 1,409 — 1,409Trade and other receivables 1,081 — 1,081Stock 625 625 —Plant and equipment 49,862 11,034 38,828Deferred tax asset 538 (188) 726Intangibles 8,456 8,456 —Trade and other payables (92) — (92)Tax liabilities (229) — (229)Provisions (1,827) — (1,827)Net identifiable assets and liabilities 59,823 19,927 39,896Goodwill on acquisition 104,525Consideration 164,348Cash acquired (1,409)Liabilities assumed (12,082)Deferred cash consideration (15,000)Share consideration (16,534)Net cash outflow 119,323The consideration above includes acquisition costs of $14.3 million.Pre-acquisition carrying amounts were determined based on applicable AASBs immediately before the acquisition. The values ofassets, liabilities, and contingent liabilities recognised on acquisition are their estimated fair values (see note 1 for methods used indetermining fair values).The Group commissioned an independent expert to conduct an analysis of the fair value of the assets and liabilities of the MitchellDrilling business on its acquisition. Following this analysis, the Group has determined a carrying value of $8.5 million for customercontracts and relationships, separate from the goodwill on acquisition.In determining the fair value of customer contracts and relationships, the Group applied a discount rate of 12% to discount the futurecash flows of the customer intangibles.The goodwill recognised on the acquisition is attributable mainly to the skills and technical talent of the acquired business’ workforceand the synergies expected to be achieved from integrating the business into the existing consolidated entity.2008On 10 August 2007, the Company acquired 100% of the issued capital of each of Jaceco Drilling Pty Limited and Geosearch DrillingService Pty Limited trading as a partnership known as Capricorn Weston Drilling Group, a Queensland based drilling group, for apurchase consideration of $21.0 million including assumption of existing debt of $4.6 million. The consideration is payable in instalmentswith $10.0 million paid at settlement and the balance payable over three years in annual instalments. The initial consideration was paidentirely out of borrowings. Deferred consideration has been discounted using a market rate of interest for similar securities.In the period to 30 June 2008, Capricorn Weston Drilling Group contributed net profit before interest and tax of $6.2 million. If theacquisition had occurred on 1 July 2007, management estimates that consolidated revenue would have been $426.0 million and netprofit before interest and tax would have been $26.6 million.
annual report 200959financial reportThe acquisition had the following effect on the Group’s assets and liabilities on acquisition date:Recognised valueson acquisition$’000Fair value Pre-acquisitionadjustments carrying amounts$’000$’000Cash and cash equivalents 277 — 277Trade and other receivables 1,516 — 1,516Plant and equipment 11,221 1,567 9,654Other assets 627 — 627Intangibles 5,505 5,505 —Trade and other payables (479) — (479)Other financial liabilities (4,763) — (4,763)Provisions (216) — (216)Net identifiable assets and liabilities 13,688 7,072 6,616Goodwill on acquisition 2,559Consideration 16,247Less deferred consideration payable (5,977)Less debt funding (9,993)Net cash outflow 277The consideration above includes acquisition costs of $182,000.The Company commissioned an independent expert to conduct an analysis of the fair value of the plant and equipment andidentifiable intangible assets of Capricorn Weston Drilling Group on its acquisition. Following this analysis, the Company has determineda carrying value of $5.5 million for customer contracts and relationships.The goodwill recognised on the acquisition is attributable mainly to the skills and technical talent of the workforce of the acquiredbusiness and the synergies expected to be achieved from integrating the company into the Group’s existing drilling business.34. KEY MANAGEMENT PERSONNEL DISCLOSURESThe following were key management personnel of the Group at any time during the reporting period and unless otherwise indicatedwere key management personnel for the entire period.Executive directors• Allan Campbell• Andrew Lukas• Ian Stuart-RobertsonNon-executive directors• Martin Green• Garry O’MeallyExecutivesIan RedfernGeneral Manager, ConstructionKevin LesterGeneral Manager, PipelinesMark Summergreene Chief Financial OfficerDenis O’BrienGeneral Manager, QueenslandBrett TredinnickGeneral Manager, DrillingMark TonkinGeneral Manager, Strategy & PlanningMike MuchGeneral Manager, Oil & GasPaul Bilston General Manager, CSG (ceased employment on 31 March 2009)Mike Rollo Chief Executive, <strong>Lucas</strong> Operations (appointed 1 January 2009; ceased employment on 8 May 2009)
annual report 200960financial report34. KEY MANAGEMENT PERSONNEL DISCLOSURES (cont)Key management personnel compensationThe key management personnel compensation is:ConsolidatedShort-term employee benefits 19,811,668 2,548,353Post-employment benefits 182,668 153,332Termination benefits 200,000 —Share based payments 971,884 626,3462009$2008$21,166,220 3,328,031Individual directors and executives compensation disclosuresInformation regarding individual directors and executives compensation is provided in the Remuneration Report section of the Directors’Report. Apart from the details disclosed in this note, no director has entered into a material contract with the Company or the Group sincethe end of the previous financial year and there were no material contracts involving directors’ interests existing at year-end.Loans to and transactions with key management personnel and their related parties (consolidated)Details regarding loans outstanding at the reporting date to key management personnel and their related parties, where the individual’saggregate loan balance exceeds $100,000 at any time in the reporting period, are as follows:Balance1 July 2008$Balance30 June 2009$Interest payable inthe reporting period$Highest balancein period$Allan Campbell 6,063,617 nil nil (1) 9,753,659(1) Interest was payable and accrued at 8.5% per annum for the period from 1 July 2008 until 30 June 2009. This was lower than theinterest rate for the period to 30 June 2008 as the Company adjusted the rate of interest to market as from 1 July 2008. Prior to theend of 30 June 2009, interest of $661,115 that had accrued to 30 June 2009 under the loan was reversed to Nil (see below).The loan was due for repayment on 30 June 2009. During this period, the loan was secured. The loan was advanced to Mr Campbell asagent for the Company to acquire a 10% net profit interest in oil and gas leasehold interests in Trinity County, East Texas, USA (TrinityInvestment). Mr Campbell received no financial benefit personally as a result of the loan and entered into the arrangement solely for thebenefit of the Group. Mr Campbell, however, remained principally liable for repayment of the loan.Prior to 30 June 2009, the loan was fully discharged and the loan agreement with Mr Campbell was terminated. The obligation of MrCampbell to repay the loan was fully satisfied and discharged by Mr Campbell and the Company agreeing to recognise that the TrinityInvestment was a direct investment of the Company in which Mr Campbell had no personal interest and no right to receive any personalfinancial benefit.Other key management personnel transactions with the Company or its controlled entitiesA number of key management persons, or their related parties, hold positions in other entities that result in them having control orsignificant influence over the financial or operating policies of those entities. A number of these entities transacted with the Companyor its subsidiaries in the reporting period. The terms and conditions of the transactions with management persons and their relatedparties were no more favourable than those available, or which might reasonably be expected to be available, on similar transactions tounrelated entities on an arm’s length basis.The aggregate amounts recognised during the year relating to key management personnel and their related parties, were as follows:Key management persons Contracting Entity Transaction NoteAllan Campbell Argyll Capital Partners Pty Ltd Executive director services (i) 505,000 483,483Andrew Lukas <strong>AJ</strong> <strong>Lucas</strong> Equipment Pty Ltd Executive director services (i) 87,498 —Ian Stuart-Robertson Urban Enterprises Pty Ltd Executive director services (i) 29,166 —Ian Stuart-Robertson John Hollis & Partners Quantity surveyors (ii) 123,100 190,036Garry O'Meally Narwood Pty Ltd Non-executive director services (i) 80,000 45,000Martin Green BRI Ferrier (NSW) Pty Ltd Non-executive director services (i) 80,000 45,000(i) Services are provided through the contracting entity. Such services were provided in the ordinary course of business and on normalterms and conditions. Mr Lukas recommenced as an executive director of the Company on 1 April 2009 having previously beinga non-executive director. Mr Stuart-Robertson ceased employment with the Group on 31 May 2009 and commenced providingservices via the contracting entity on 1 June 2009. The amount payable for these services is shown in the Remuneration Report.(ii) Mr Stuart-Robertson is a director of John Hollis & Partners which provided quantity surveying services. Amounts were charged atnormal market rates for such services and were due and payable under normal payment terms.2009$2008$
annual report 200961financial reportEquity holdings and transactionsThe movement during the reporting period in the number of ordinary shares of the Company held directly, indirectly or beneficially byeach key management person, including their related parties, is as follows:2009Held at1 July 2008Received onexercise ofrightsReceivedas part ofcompensationNet otherchangeHeld at30 June 2009DirectorsAllan Campbell 10,140,083 — — — 10,140,083Ian Stuart-Robertson 1,386,750 — — — 1,386,750Andrew Lukas 6,204,833 — — — 6,204,833Martin Green 125,000 — — — 125,000Garry O’Meally 219,180 — — — 219,180ExecutivesIan Redfern — 109,239 — — 109,239Kevin Lester 180,570 20,543 — (7,879) 193,234Mark Summergreene — 18,900 — — 18,900Brett Tredinnick 79,570 16,829 — (12,000) 84,399Mark Tonkin 338,317 16,829 — — 355,1462008Held at1 July 2007Received onexercise ofrightsReceivedas part ofcompensationNet otherchangeHeld at30 June 2008DirectorsAllan Campbell 10,140,083 — — — 10,140,083Ian Stuart-Robertson 1,386,750 — — — 1,386,750Andrew Lukas 6,204,833 — — — 6,204,833Martin Green 125,000 — — — 125,000Garry O’Meally 189,180 — — 30,000 219,180ExecutivesIan Redfern — — — — —Kevin Lester 570 180,000 — — 180,570Mark Summergreene — — — — —Brian Burden 570 — — — 570Brett Tredinnick 60,570 — — 19,000 79,570Mark Tonkin 120,000 — — 218,317 338,317Options and rights over equity instruments granted as compensationThe movement during the reporting period in the number of rights or options over ordinary shares in the Company held directly,indirectly or beneficially, by each key management person, including their related parties, is as follows:2009Held at1 July 2008 Cancelled ExercisedGranted ascompensationHeld at30 June 2009Vested Vested andduring exercisable atthe year 30 June 2009DirectorsAllan Campbell 360,000 — — 238,648 598,648 — —Ian Stuart-Robertson 220,000 — — — 220,000 — —Andrew Lukas 220,000 — — — 220,000 — —ExecutivesIan Redfern 204,811 — (109,239) — 95,572 34,239 34,239Kevin Lester 89,357 — (20,543) — 68,814 20,543 20,543Mark Summergreene 82,209 — (18,900) — 63,309 18,900 18,900Brett Tredinnick 73,202 — (16,829) — 56,373 16,829 16,829Mark Tonkin 57,353 — (16,829) 15,849 56,373 16,829 16,829
annual report 200962financial report34. KEY MANAGEMENT PERSONNEL DISCLOSURES (cont)Options and rights over equity instruments granted as compensation (cont)2008Held at1 July 2007 Cancelled ExercisedGranted ascompensationHeld at30 June 2008Vested Vested andduring exercisable atthe year 30 June 2008DirectorsAllan Campbell 250,000 — — 110,000 360,000 — —Ian Stuart-Robertson 150,000 — — 70,000 220,000 — —Andrew Lukas 150,000 — — 70,000 220,000 — —ExecutivesIan Redfern 75,000 — — 129,811 204,811 34,239 109,239Kevin Lester 180,000 — (180,000) 89,357 89,357 20,543 20,543Mark Summergreene — — — 82,209 82,209 18,900 18,900Brian Burden 30,000 — — 80,422 110,422 18,489 48,489Brett Tredinnick — — — 73,202 73,202 16,829 16,829Mark Tonkin — — — 57,353 57,353 10,742 10,74235. NON-KEY MANAGEMENT PERSONNEL DISCLOSURESThe Group has a related party relationship with its subsidiaries (see note 30) and joint ventures (see note 29). These entities trade witheach other from time to time on normal commercial terms.Other than amounts owing to <strong>AJ</strong> <strong>Lucas</strong> (Hong Kong) Limited, on which interest is paid at 7.0% per annum, no interest is payable oninter-company balances. The aggregate amounts included in the profit from ordinary activities before income tax that resulted fromtransactions between entities in the Group are:2009$’0002008$’000Dividend revenue from wholly-owned controlled entity 8,962 —Interest expense 636 857Receivables:Aggregate amount receivable from wholly owned entities of the Company:<strong>AJ</strong> <strong>Lucas</strong> Joint Ventures Pty Limited 4,269 3,910<strong>AJ</strong> <strong>Lucas</strong> Operations Pty Limited 22,552 24,314<strong>Lucas</strong> Energy Pty Limited — 15,047<strong>Lucas</strong> Stuart Pty Limited 242 —<strong>AJ</strong> <strong>Lucas</strong> Coal Technologies Pty Limited 148,875 4,731McDermott Drilling Pty Limited — 1,846Smart Electrical & Power Services Pty Limited 14 14<strong>AJ</strong> <strong>Lucas</strong> (USA) Inc. 27 27175,979 49,889Payables:Aggregate amount payable to wholly owned entities of the Company:<strong>Lucas</strong> Stuart Pty Limited — 14,643McDermott Drilling Pty Limited 3,978 —<strong>AJ</strong> <strong>Lucas</strong> (Hong Kong) Limited 106 12,337Geosearch Drilling Service Pty Limited 15,593 2,38119,677 29,36136. Deed of cross guaranteeOn 16 June 2008, several of the entities in the Group entered into a Deed of Cross Guarantee. Pursuant to ASIC Class Order 98/1418 (asamended) dated 13 August 1998, the Group’s wholly owned subsidiaries entering into the Deed are relieved from the Corporations Act2001 requirements to prepare, have audited and lodge financial reports, and directors’ reports.The effect of the Deed is that the Company guarantees to each creditor payment in full of any debt in the event of winding up of anyof the subsidiaries under certain provisions of the Corporations Act 2001. If a winding up occurs under other provisions of the Act, theCompany will only be liable in the event that after six months any creditor has not been paid in full. The subsidiaries have also givensimilar guarantees in the event that the Company is wound up. The subsidiaries subject to the Deed are:
annual report 200963financial report36. Deed of cross guarantee (cont)Name of entity<strong>AJ</strong> <strong>Lucas</strong> Operations Pty Limited<strong>AJ</strong> <strong>Lucas</strong> Plant & Equipment Pty Limited<strong>AJ</strong> <strong>Lucas</strong> Drilling Pty Limited<strong>AJ</strong> <strong>Lucas</strong> Pipelines Pty Limited<strong>AJ</strong> <strong>Lucas</strong> Testing Pty LimitedSmart Electrical & Power Services Pty Limited<strong>AJ</strong> <strong>Lucas</strong> Joint Ventures Pty LimitedCoastal Sand Technologies Pty Limited<strong>Lucas</strong> Energy Pty Limited<strong>AJ</strong> <strong>Lucas</strong> Coal Technologies Pty Limited<strong>Lucas</strong> Contract Drilling Pty LimitedMcDermott Drilling Pty Limited<strong>Lucas</strong> Stuart Pty LimitedKetrim Pty LimitedStuart Painting Services Pty Limited<strong>Lucas</strong> Stuart Projects Pty LimitedJaceco Drilling Pty LimitedGeosearch Drilling Service Pty Limited<strong>Lucas</strong> Energy Holdings Pty Limited<strong>Lucas</strong> Energy (WA) Pty Limited<strong>Lucas</strong> (Arawn) Pty Limited<strong>Lucas</strong> Energy (ATP651P) Pty LimitedMitchell Drilling Corporation Pty LimitedA consolidated summarised income statement and consolidatedbalance sheet, comprising the Company and controlled entitieswhich are a party to the Deed, after eliminating all transactionsbetween parties to the Deed of Cross Guarantee, at 30 June 2009are set out as follows:Summarised income statement and retained profitsConsolidated2009$Restated2008$Profit before tax 170,885 22,592Income tax expense (60,838) (7,180)Profit after tax 110,047 15,412Retained profit at beginning of the year 2,085 (10,054)Dividends recognised during the year (6,358) (3,273)Retained profit at end of year 105,774 2,085Attributable to:Equity holders of the company 110,047 15,412Profit for the period 110,047 15,412Balance SheetConsolidated2009$Restated2008$Current assetsCash and cash equivalents 96,317 16,448Trade and other receivables 59,732 56,847Construction work in progress 61,389 42,405Other assets 907 1,263Total current assets 218,345 116,963Non-current assetsTrade and other receivables 23,922 —Development assets 878 15,452Exploration assets 4,354 4,750Investments 1,305 23,992Equity accounted investees 8,180 —Intangible assets 119,451 12,279Property, plant and equipment 138,451 55,986Total non-current assets 296,541 112,459Total assets 514,886 229,422Current liabilitiesTrade and other payables 77,037 79,273Interest-bearing loans and borrowings 123,070 17,696Income tax payable 50,797 115Provisions 6,542 8,550Total current liabilities 257,446 105,634Non-current liabilitiesTrade and other payables — 12,399Interest-bearing loans and borrowings 45,495 51,036Deferred tax liabilities 11,576 1,827Provisions 730 748Total non-current liabilities 57,801 66,010Total liabilities 315,247 171,644Net assets 199,639 57,778EquityIssued capital 91,935 54,037Reserves 1,930 1,656Retained earnings 105,774 2,085Total equity 199,639 57,77837. EVENTS SUBSEQUENT TO BALANCE DATESubsequent to year-end, the Company invested a further $25.1 million in relation to its 10% Net Profit Interest in the MonumentProspect as part of the Company’s oil and gas strategy. Refer to Note 19 for further information in relation to the nature of thisinvestment.Subsequent to balance date, the directors have declared a final ordinary dividend of 5.5 cents per share, fully franked.Other than these matters, there has not arisen in the interval between the end of the financial year and the date of this report anyitem, transaction or event of a material or unusual nature likely, in the opinion of the directors of the Company, to affect significantly theoperations of the Group, the results of those operations, or the state of affairs of the Group, in future financial years.
<strong>AJ</strong> <strong>Lucas</strong> Group LimitedABN 12 060 309 104394 Lane Cove RoadMacquarie Park NSW 2113Locked Bag 2113North Ryde BC NSW 1670T (02) 9490 4000F (02) 9490 4200www.lucas.com.auDIRECTORS’ DECLARATION1 In the opinion of the directors of <strong>AJ</strong> <strong>Lucas</strong> Group Limited (the Company):(a) the financial statements and notes, set out on pages 16 to 63 and the Remuneration Report included in the Directors’ Report,set out on pages 9 to 14, are in accordance with the Corporations Act 2001, including:(i) giving a true and fair view of the Company’s and the Group’s financial position as at 30 June 2009 and of their performancefor the financial year ended on that date; and(ii) complying with Australian Accounting Standards (including the Australian Accounting Interpretations) and the CorporationsRegulations 2001;(b) the financial report also complies with International Financial Reporting Standards as disclosed in note 1; and(c) there are reasonable grounds to believe that the Company will be able to pay its debts as and when they become due andpayable.2 There are reasonable grounds to believe that the Company and the group entities identified in note 36 will be able to meet anyobligations or liabilities to which they are or may become subject to by virtue of the Deed of Cross Guarantee between the Companyand those group entities pursuant to ASIC Class Order 98/1418.3 The directors have been given the declarations required by Section 295A of the Corporations Act 2001 from the Chief ExecutiveOfficer and Chief Financial Officer for the financial year ended 30 June 2009.Signed in accordance with a resolution of the directors:Allan CampbellDirector30 September 2009
65Independent auditor’s report to the members of aj lucas group limitedReport on the financial reportWe have audited the accompanying financial report of <strong>AJ</strong> <strong>Lucas</strong>Group Limited (the Company), which comprises the balance sheetsas at 30 June 2009, and the income statements, statements ofrecognised income and expense and cash flow statements for theyear ended on that date, a description of significant accountingpolicies and other explanatory notes 1 to 37 and the Directors’Declaration of the Group comprising the Company and the entitiesit controlled at year end or from time to time during the financialyear.Directors’ responsibility for the financial reportThe directors of the Company are responsible for thepreparation and fair presentation of the financial report inaccordance with Australian Accounting Standards (including theAustralian Accounting Interpretations) and the Corporations Act2001. This responsibility includes establishing and maintaininginternal control relevant to the preparation and fair presentationof the financial report that is free from material misstatement,whether due to fraud or error; selecting and applying appropriateaccounting policies; and making accounting estimates that arereasonable in the circumstances. In note 1, the directors alsostate, in accordance with Australian Accounting Standard AASB101 Presentation of Financial Statements, that the financial reportof the Group, comprising the financial statements and notes,complies with International Financial Reporting Standards.Auditor’s responsibilityOur responsibility is to express an opinion on the financialreport based on our audit. We conducted our audit in accordancewith Australian Auditing Standards. These Auditing Standardsrequire that we comply with relevant ethical requirements relatingto audit engagements and plan and perform the audit to obtainreasonable assurance whether the financial report is free frommaterial misstatement.An audit involves performing procedures to obtain auditevidence about the amounts and disclosures in the financialreport. The procedures selected depend on the auditor’sjudgement, including the assessment of the risks of materialmisstatement of the financial report, whether due to fraud orerror. In making those risk assessments, the auditor considersinternal control relevant to the entity’s preparation and fairpresentation of the financial report in order to design auditprocedures that are appropriate in the circumstances, but notfor the purpose of expressing an opinion on the effectiveness ofthe entity’s internal control. An audit also includes evaluatingthe appropriateness of accounting policies used and thereasonableness of accounting estimates made by the directors, aswell as evaluating the overall presentation of the financial report.We performed the procedures to assess whether in all materialrespects the financial report presents fairly, in accordance withthe Corporations Act 2001 and Australian Accounting Standards(including the Australian Accounting Interpretations), a view whichis consistent with our understanding of the Company’s and theGroup’s financial position and of their performance.We believe that the audit evidence we have obtained issufficient and appropriate to provide a basis for our audit opinion.IndependenceIn conducting our audit, we have complied with the independencerequirements of the Corporations Act 2001.Auditor’s opinionIn our opinion:(a) the financial report of <strong>AJ</strong> <strong>Lucas</strong> Group Limited is inaccordance with the Corporations Act 2001, including:(i) giving a true and fair view of the Company’s and theGroup’s financial position as at 30 June 2009 and of theirperformance for the year ended on that date; and(ii) complying with Australian Accounting Standards(including the Australian Accounting Interpretations) andthe Corporations Regulations 2001.(b) the financial report also complies with International FinancialReporting Standards as disclosed in note 1.Report on the Remuneration ReportWe have audited the Remuneration Report included withinthe Directors’ Report for the year ended 30 June 2009. Thedirectors of the Company are responsible for the preparationand presentation of the Remuneration Report in accordance withSection 300A of the Corporations Act 2001. Our responsibility isto express an opinion on the Remuneration Report, based on ouraudit conducted in accordance with Auditing Standards.Auditor’s opinionIn our opinion, the Remuneration Report of <strong>AJ</strong> <strong>Lucas</strong> GroupLimited for the year ended 30 June 2009, complies with Section300A of the Corporations Act 2001.KPMGNeil Cameron SmithPartnerSydney30 September 2009
annual report 200966financial reportAUSTRALIAN SECURITIES EXCHANGE ADDITIONAL INFORMATIONDistribution of ordinary shareholders(as at 31 August 2009)Number of Security HoldersSecurities heldOrdinary sharesRedeemableconvertiblepreference shares Options / rights1 - 1,000 1,128 — —1,001 - 5,000 1,707 — —5,001 - 10,000 584 — 110,001 - 100,000 472 4 35100,001 and over 38 1 3Total 3,929 5 3968 shareholders held less than a marketable parcel of ordinary shares.Twenty largest ordinary shareholdersNameNumber of ordinaryshares held% ofIssued sharesAndial Holdings Pty Limited 13,485,590 20.76National Nominees Limited 5,789,313 8.91HSBC Custody Nominees (Australia) Limited 3,962,215 6.10Mitchell Drilling Contractors Pty Limited Trustee of Tanson Account 2,645,503 4.07Amalgamated Dairies Limited 2,254,000 3.47JP Morgan Nominees Australia Limited 2,091,488 3.22Forty Traders Limited 1,976,348 3.04Cogent Nominees Pty Limited 1,090,930 1.68Citycorp Nominees Pty Limited CFS Developing Companies A/C 1,064,672 1.64Citicorp Nominees Pty Limited 910,337 1.40Gwynvill Trading Pty Limited 834,363 1.28ANZ Nominees Limited 819,210 1.26Forbar Nominees Limited 523,837 0.81Cogent Nominees Pty Limited SMP Account 419,967 0.65UBS Nominees Pty Limited 390,982 0.60Viewjet Pty Limited 352,769 0.54Barrijag Pty Limited The Hadley Family A/C 327,621 0.50NZ Guardian Trust Company Limited 01035700 A/C 290,950 0.45Citicorp Nominees Pty Limited CFSIL CWLTH AUST SHS 23 A/C 290,706 0.45Queensland Investment Corporation 251,933 0.39Total 39,772,734 61.22Substantial shareholdersNameNumber of ordinaryshares held% ofIssued sharesAndial Holdings Pty Limited 17,490,000 26.93Amalgamated Dairies Group 4,230,348 6.51On-market buy back: There is an on-market buy back currently in place.Unquoted equity securities: As at 31 August 2009, there were 2,548,648 rights over unissued ordinary shares in the Company.Redeemable convertible preference sharesThe following entities held 20% or more of the number of redeemable convertible preference shares on issue:NameNumber ofshares held% ofsharesPerpetual Nominees Limited 414,623 92.1Voting rightsOrdinary shares - Refer to note 27 of the financial statements.Redeemable convertible preference shares - Refer to note 22 of the financial statements.Options and rights - These are no voting rights attached to the options and rights.
annual report 200967financial reportDirectoryCompany secretaryNicholas Swan MA, MBARegistered office394 Lane Cove RoadMACQUARIE PARK NSW 2113Tel +61 2 9490 4000Fax +61 2 9490 4200Share registryComputershare Investor Services Pty LimitedLevel 5, 115 Grenfell StreetADELAIDE SA 5000GPO Box 1903ADELAIDE SA 5001Enquiries within Australia: 1300 556 161Enquiries outside Australia: +61 3 9615 5970Email: web.queries@computershare.com.auWebsite: www.computershare.comStock exchangeThe Company is listed on the Australian Securities Exchange with the code ‘<strong>AJ</strong>L’. The Home Exchange is Sydney.AuditorsKPMG10 Shelley StreetSydney NSW 2000BankersANZ Bank20 Martin PlaceSydney NSW 2000Quality certifiers (AS/NZS ISO 9001:2000)Bureau VeritasAustralian business number12 060 309 104Other information<strong>AJ</strong> <strong>Lucas</strong> Group Limited, incorporated and domiciled in Australia, is a publicly listed company limited by shares.
<strong>AJ</strong> <strong>Lucas</strong> group limitedSydneyHyundai Building394 Lane Cove RoadMacquarie Park NSW 2113Locked Bag 2113North Ryde BC NSW 1670Tel +61 2 9490 4000Fax +61 2 9490 4200MelbourneLevel 8, 160 Queen StreetMelbourne Victoria 3000Tel +61 3 8615 7800Fax +61 3 8615 7888BrisbaneLevel 10, Waterfront Place1 Eagle StreetBrisbane QLD 4000Tel +61 7 3235 8100Fax +61 7 3235 8111Drilling Services112 Ebbern StreetDarra QLD 4076PO Box 869Mt Ommaney QLD 4074Tel +61 7 3363 7333Fax +61 7 3363 7399PerthLevel 4, IBM Building1060 Hay StreetPerth WA 6000from 1 November 2009