GREEN GROWTH: FROM RELIGION TO REALITY - Sustainia
GREEN GROWTH: FROM RELIGION TO REALITY - Sustainia GREEN GROWTH: FROM RELIGION TO REALITY - Sustainia
Chapter 5strands. For reference we have included a chronologicaloverview of relevant state history.2 Three strands of green growth2.1 Energy efficiencyFrom the late 1970s onward electricity use per capita inCalifornia stayed flat, while increasing by 50% nationally.Over the same time period the state experienced longtermeconomic growth—successfully decoupling growthand electricity consumption (Roland-Holst 2008). In thisscenario California was able to successfully capture significantgreen-compatible growth – that is, growth inwhich economic growth is compatible with emissionsreduction or control. (Note, however, that this was anunintended consequence of energy efficiency policy; atthe time, carbon emissions were not a policy focus.)This success was due at least in part to deliberateenergy efficiency policy measures and to a legacy of pioneeringair pollution regulation and infrastructure alreadyin place in California as a response to serious airpollution problems in the 1940s and 1950s. In the laterpart of the 1970s the state put into effect an aggressiveenergy efficiency policy package comprised of buildingand appliance standards and utility programs. In addition,to encourage utilities to adopt energy efficiency technologiesand programs, the state introduced policies todecouple utility profits from total electricity generation.These policies provided a compensatory revenue streamand performance incentives for utilities that met or exceededefficiency savings. Regulators used a new investmentmetric – “cost of conserved energy” – to calculatesavings from avoided use and thus justify the programcosts (Rosenfeld and McAuliffe 2008; Rosenfeld and Poskanzer2009).The political will and successful implementation ofthese policies stemmed from a myriad of inter-connectedfactors, including a history of air pollution problems andthe resulting established regulatory infrastructure andgrants of regulatory latitude to the state by the federalgovernment; the OPEC embargo and rising fuel prices;and an absence of an entrenched fossil fuel sector. In the1940s California began experiencing severe air pollutionproblems in the LA Basin area resulting in an acrid haze.The geography and quickly expanding population in theauto-centric city helped explain the unique severity ofthe pollution. California created a series of administrativebodies to regulate and address this problem, developingfinally into the California Air and Resource Board1967. In conflict with less stringent national air pollutionregulation passed a decade later, California was theonly state awarded the legal right to pass more stringentair pollution regulation that at the national level due tothe state’s “extraordinary conditions” and “pioneering efforts.”These existing regulatory bodies and legal rightsplayed a central role in the later implemented energy efficiencymeasures (Hanemann 2007).Momentum for further clean-air regulation was initiallyunable to overcome Republican and industry objectionuntil the critical juncture of the OPEC oil embargoand resulting rocketing oil prices. An absence of coalPer capita electricity sales(kWh/person) (2006 to 2008 are forecast data)14,00012,00010,0008,000United States2005 Differences= 5,300kWh/yr= $165/capita6,000California4,0001975 2005 % changeUS GDP/capita 16,241 31,442 94%Cal GSP/capita 18,760 33,536 79%Per Capita Income in Constant 2000 $1960196219641966196819701972197419761978198019821984198619881990199219941996199820002002200420062008Figure 1: Per Capita Electricity Sales comparisons between California and the U.S. as a whole over the last 30 years.Source: Rosenfeld 2008.52
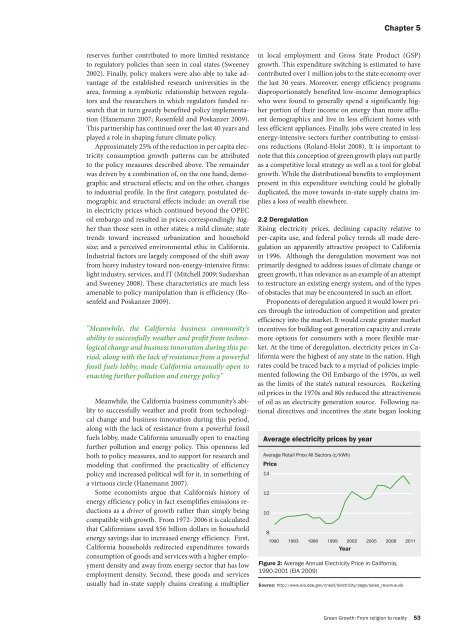
Chapter 5reserves further contributed to more limited resistanceto regulatory policies than seen in coal states (Sweeney2002). Finally, policy makers were also able to take advantageof the established research universities in thearea, forming a symbiotic relationship between regulatorsand the researchers in which regulators funded researchthat in turn greatly benefited policy implementation(Hanemann 2007; Rosenfeld and Poskanzer 2009).This partnership has continued over the last 40 years andplayed a role in shaping future climate policy.Approximately 25% of the reduction in per capita electricityconsumption growth patterns can be attributedto the policy measures described above. The remainderwas driven by a combination of, on the one hand, demographicand structural effects; and on the other, changesto industrial profile. In the first category, postulated demographicand structural effects include: an overall risein electricity prices which continued beyond the OPECoil embargo and resulted in prices correspondingly higherthan those seen in other states; a mild climate; statetrends toward increased urbanization and householdsize; and a perceived environmental ethic in California.Industrial factors are largely composed of the shift awayfrom heavy industry toward non-energy-intensive firms:light industry, services, and IT (Mitchell 2009; Sudarshanand Sweeney 2008). These characteristics are much lessamenable to policy manipulation than is efficiency (Rosenfeldand Poskanzer 2009)."Meanwhile, the California business community’sability to successfully weather and profit from technologicalchange and business innovation during this period,along with the lack of resistance from a powerfulfossil fuels lobby, made California unusually open toenacting further pollution and energy policy"Meanwhile, the California business community’s abilityto successfully weather and profit from technologicalchange and business innovation during this period,along with the lack of resistance from a powerful fossilfuels lobby, made California unusually open to enactingfurther pollution and energy policy. This openness ledboth to policy measures, and to support for research andmodeling that confirmed the practicality of efficiencypolicy and increased political will for it, in something ofa virtuous circle (Hanemann 2007).Some economists argue that California’s history ofenergy efficiency policy in fact exemplifies emissions reductionsas a driver of growth rather than simply beingcompatible with growth. From 1972- 2006 it is calculatedthat Californians saved $56 billion dollars in householdenergy savings due to increased energy efficiency. First,California households redirected expenditures towardsconsumption of goods and services with a higher employmentdensity and away from energy sector that has lowemployment density. Second, these goods and servicesusually had in-state supply chains creating a multiplierin local employment and Gross State Product (GSP)growth. This expenditure switching is estimated to havecontributed over 1 million jobs to the state economy overthe last 30 years. Moreover, energy efficiency programsdisproportionately benefited low-income demographicswho were found to generally spend a significantly higherportion of their income on energy than more affluentdemographics and live in less efficient homes withless efficient appliances. Finally, jobs were created in lessenergy-intensive sectors further contributing to emissionsreductions (Roland-Holst 2008). It is important tonote that this conception of green growth plays out partlyas a competitive local strategy as well as a tool for globalgrowth. While the distributional benefits to employmentpresent in this expenditure switching could be globallyduplicated, the move towards in-state supply chains impliesa loss of wealth elsewhere.2.2 DeregulationRising electricity prices, declining capacity relative toper-capita use, and federal policy trends all made deregulationan apparently attractive prospect to Californiain 1996. Although the deregulation movement was notprimarily designed to address issues of climate change orgreen growth, it has relevance as an example of an attemptto restructure an existing energy system, and of the typesof obstacles that may be encountered in such an effort.Proponents of deregulation argued it would lower pricesthrough the introduction of competition and greaterefficiency into the market. It would create greater marketincentives for building out generation capacity and createmore options for consumers with a more flexible market.At the time of deregulation, electricity prices in Californiawere the highest of any state in the nation. Highrates could be traced back to a myriad of policies implementedfollowing the Oil Embargo of the 1970s, as wellas the limits of the state’s natural resources. Rocketingoil prices in the 1970s and 80s reduced the attractivenessof oil as an electricity generation source. Following nationaldirectives and incentives the state began lookingAverage electricity prices by yearAverage Retail Price All Sectors (c/kWh)Price14121081990 1993 1996 1999 2002 2005 2008 2011YearFigure 2: Average Annual Electricity Price in California,1990-2001 (EIA 2009)Source: http://www.eia.doe.gov/cneaf/electricity/page/sales_revenue.xlsGreen Growth: From religion to reality 53
- Page 4: Chapter xxxFROM RELIGIONTO REALITY:
- Page 8 and 9: Chapter 1possibility of this outcom
- Page 10: Chapter 1for new innovation and inv
- Page 15 and 16: Chapter 134 Ibid.35 Information bas
- Page 17 and 18: Chapter 1Hughes, Thomas. 1983. Netw
- Page 19 and 20: Chapter 21 Overview: The country ca
- Page 21 and 22: Chapter xxxEUROPEAN UNION:GREEN GRO
- Page 23 and 24: Chapter 32 See, for instance Jacobs
- Page 25 and 26: Chapter 313 Germany and Poland both
- Page 27 and 28: Chapter 317 This, of course, is lim
- Page 29: Chapter 321 This problem is unique
- Page 34 and 35: Chapter 4imports significantly more
- Page 36 and 37: Chapter 4such the policies in the n
- Page 38 and 39: Chapter 4concept became a central t
- Page 40: Chapter 4Gross energy consumption b
- Page 43 and 44: objectives." In Climate Change and
- Page 45 and 46: Chapter 51 In fact, the story is so
- Page 47 and 48: Chapter 5tion of funds seems to rei
- Page 49 and 50: Chapter 5political structure that a
- Page 51: Chapter 51 IntroductionCalifornia
- Page 55 and 56: Chapter 5ting regulatory infrastruc
- Page 57 and 58: Chapter 5world, standards set for t
- Page 59 and 60: Chapter 5take a more traditional co
- Page 61 and 62: Chapter xxxCOLORADOSTATE CASE ANALY
- Page 63 and 64: Chapter 53.1 Public advocacyPublic
- Page 65 and 66: Chapter 53.4.1 Energy industryGiven
- Page 67 and 68: Chapter xxxKOREAA COUNTRY CASE ANAL
- Page 70 and 71: Chapter 6from 2012 to 2016 (MKE, 20
- Page 72 and 73: Chapter 6Current subsidies for elec
- Page 75 and 76: Chapter xxxCHINAA COUNTRY CASE ANAL
- Page 77 and 78: Chapter 72 In his investigation of
- Page 79 and 80: Chapter 7which caused temporary shu
- Page 81 and 82: Chapter 77 Recent explorations show
- Page 83 and 84: Chapter 7ence/earth/02copenhagen.ht
- Page 85 and 86: Chapter xxxBRAZILA COUNTRY CASE ANA
- Page 87 and 88: Chapter 86 INPE counts Amazon defor
- Page 89 and 90: Chapter 817 This program is controv
- Page 91 and 92: Chapter 8off of its current track o
- Page 93 and 94: Chapter 823 Rosa et al. (2009, 16)
- Page 95 and 96: Chapter 829 For a detailed historic
- Page 97 and 98: Chapter 8(IPEA 26 May 2010, 16).34
- Page 100: TAKE LEAD, OCTOBER 12-13 TH ,2011 C
Chapter 5reserves further contributed to more limited resistanceto regulatory policies than seen in coal states (Sweeney2002). Finally, policy makers were also able to take advantageof the established research universities in thearea, forming a symbiotic relationship between regulatorsand the researchers in which regulators funded researchthat in turn greatly benefited policy implementation(Hanemann 2007; Rosenfeld and Poskanzer 2009).This partnership has continued over the last 40 years andplayed a role in shaping future climate policy.Approximately 25% of the reduction in per capita electricityconsumption growth patterns can be attributedto the policy measures described above. The remainderwas driven by a combination of, on the one hand, demographicand structural effects; and on the other, changesto industrial profile. In the first category, postulated demographicand structural effects include: an overall risein electricity prices which continued beyond the OPECoil embargo and resulted in prices correspondingly higherthan those seen in other states; a mild climate; statetrends toward increased urbanization and householdsize; and a perceived environmental ethic in California.Industrial factors are largely composed of the shift awayfrom heavy industry toward non-energy-intensive firms:light industry, services, and IT (Mitchell 2009; Sudarshanand Sweeney 2008). These characteristics are much lessamenable to policy manipulation than is efficiency (Rosenfeldand Poskanzer 2009)."Meanwhile, the California business community’sability to successfully weather and profit from technologicalchange and business innovation during this period,along with the lack of resistance from a powerfulfossil fuels lobby, made California unusually open toenacting further pollution and energy policy"Meanwhile, the California business community’s abilityto successfully weather and profit from technologicalchange and business innovation during this period,along with the lack of resistance from a powerful fossilfuels lobby, made California unusually open to enactingfurther pollution and energy policy. This openness ledboth to policy measures, and to support for research andmodeling that confirmed the practicality of efficiencypolicy and increased political will for it, in something ofa virtuous circle (Hanemann 2007).Some economists argue that California’s history ofenergy efficiency policy in fact exemplifies emissions reductionsas a driver of growth rather than simply beingcompatible with growth. From 1972- 2006 it is calculatedthat Californians saved $56 billion dollars in householdenergy savings due to increased energy efficiency. First,California households redirected expenditures towardsconsumption of goods and services with a higher employmentdensity and away from energy sector that has lowemployment density. Second, these goods and servicesusually had in-state supply chains creating a multiplierin local employment and Gross State Product (GSP)growth. This expenditure switching is estimated to havecontributed over 1 million jobs to the state economy overthe last 30 years. Moreover, energy efficiency programsdisproportionately benefited low-income demographicswho were found to generally spend a significantly higherportion of their income on energy than more affluentdemographics and live in less efficient homes withless efficient appliances. Finally, jobs were created in lessenergy-intensive sectors further contributing to emissionsreductions (Roland-Holst 2008). It is important tonote that this conception of green growth plays out partlyas a competitive local strategy as well as a tool for globalgrowth. While the distributional benefits to employmentpresent in this expenditure switching could be globallyduplicated, the move towards in-state supply chains impliesa loss of wealth elsewhere.2.2 DeregulationRising electricity prices, declining capacity relative toper-capita use, and federal policy trends all made deregulationan apparently attractive prospect to Californiain 1996. Although the deregulation movement was notprimarily designed to address issues of climate change orgreen growth, it has relevance as an example of an attemptto restructure an existing energy system, and of the typesof obstacles that may be encountered in such an effort.Proponents of deregulation argued it would lower pricesthrough the introduction of competition and greaterefficiency into the market. It would create greater marketincentives for building out generation capacity and createmore options for consumers with a more flexible market.At the time of deregulation, electricity prices in Californiawere the highest of any state in the nation. Highrates could be traced back to a myriad of policies implementedfollowing the Oil Embargo of the 1970s, as wellas the limits of the state’s natural resources. Rocketingoil prices in the 1970s and 80s reduced the attractivenessof oil as an electricity generation source. Following nationaldirectives and incentives the state began lookingAverage electricity prices by yearAverage Retail Price All Sectors (c/kWh)Price14121081990 1993 1996 1999 2002 2005 2008 2011YearFigure 2: Average Annual Electricity Price in California,1990-2001 (EIA 2009)Source: http://www.eia.doe.gov/cneaf/electricity/page/sales_revenue.xlsGreen Growth: From religion to reality 53


