Photonic crystal nanocavity arrays - IEEE Photonics Society
Photonic crystal nanocavity arrays - IEEE Photonics Society
Photonic crystal nanocavity arrays - IEEE Photonics Society

You also want an ePaper? Increase the reach of your titles
YUMPU automatically turns print PDFs into web optimized ePapers that Google loves.
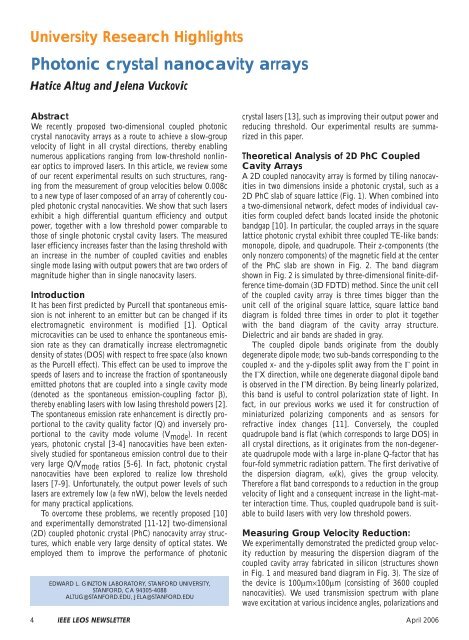
University Research Highlights<strong>Photonic</strong> <strong>crystal</strong> <strong>nanocavity</strong> <strong>arrays</strong>Hatice Altug and Jelena VuckovicAbstractWe recently proposed two-dimensional coupled photonic<strong>crystal</strong> <strong>nanocavity</strong> <strong>arrays</strong> as a route to achieve a slow-groupvelocity of light in all <strong>crystal</strong> directions, thereby enablingnumerous applications ranging from low-threshold nonlinearoptics to improved lasers. In this article, we review someof our recent experimental results on such structures, rangingfrom the measurement of group velocities below 0.008cto a new type of laser composed of an array of coherently coupledphotonic <strong>crystal</strong> nanocavities. We show that such lasersexhibit a high differential quantum efficiency and outputpower, together with a low threshold power comparable tothose of single photonic <strong>crystal</strong> cavity lasers. The measuredlaser efficiency increases faster than the lasing threshold withan increase in the number of coupled cavities and enablessingle mode lasing with output powers that are two orders ofmagnitude higher than in single <strong>nanocavity</strong> lasers.IntroductionIt has been first predicted by Purcell that spontaneous emissionis not inherent to an emitter but can be changed if itselectromagnetic environment is modified [1]. Opticalmicrocavities can be used to enhance the spontaneous emissionrate as they can dramatically increase electromagneticdensity of states (DOS) with respect to free space (also knownas the Purcell effect). This effect can be used to improve thespeeds of lasers and to increase the fraction of spontaneouslyemitted photons that are coupled into a single cavity mode(denoted as the spontaneous emission-coupling factor β),thereby enabling lasers with low lasing threshold powers [2].The spontaneous emission rate enhancement is directly proportionalto the cavity quality factor (Q) and inversely proportionalto the cavity mode volume (V mode ). In recentyears, photonic <strong>crystal</strong> [3-4] nanocavities have been extensivelystudied for spontaneous emission control due to theirvery large Q/V mode ratios [5-6]. In fact, photonic <strong>crystal</strong>nanocavities have been explored to realize low thresholdlasers [7-9]. Unfortunately, the output power levels of suchlasers are extremely low (a few nW), below the levels neededfor many practical applications.To overcome these problems, we recently proposed [10]and experimentally demonstrated [11-12] two-dimensional(2D) coupled photonic <strong>crystal</strong> (PhC) <strong>nanocavity</strong> array structures,which enable very large density of optical states. Weemployed them to improve the performance of photonicEDWARD L. GINZTON LABORATORY, STANFORD UNIVERSITY,STANFORD, CA 94305-4088ALTUG@STANFORD.EDU, JELA@STANFORD.EDU<strong>crystal</strong> lasers [13], such as improving their output power andreducing threshold. Our experimental results are summarizedin this paper.Theoretical Analysis of 2D PhC CoupledCavity ArraysA 2D coupled <strong>nanocavity</strong> array is formed by tiling nanocavitiesin two dimensions inside a photonic <strong>crystal</strong>, such as a2D PhC slab of square lattice (Fig. 1). When combined intoa two-dimensional network, defect modes of individual cavitiesform coupled defect bands located inside the photonicbandgap [10]. In particular, the coupled <strong>arrays</strong> in the squarelattice photonic <strong>crystal</strong> exhibit three coupled TE-like bands:monopole, dipole, and quadrupole. Their z-components (theonly nonzero components) of the magnetic field at the centerof the PhC slab are shown in Fig. 2. The band diagramshown in Fig. 2 is simulated by three-dimensional finite-differencetime-domain (3D FDTD) method. Since the unit cellof the coupled cavity array is three times bigger than theunit cell of the original square lattice, square lattice banddiagram is folded three times in order to plot it togetherwith the band diagram of the cavity array structure.Dielectric and air bands are shaded in gray.The coupled dipole bands originate from the doublydegenerate dipole mode; two sub-bands corresponding to thecoupled x- and the y-dipoles split away from the Γ point inthe ΓX direction, while one degenerate diagonal dipole bandis observed in the ΓM direction. By being linearly polarized,this band is useful to control polarization state of light. Infact, in our previous works we used it for construction ofminiaturized polarizing components and as sensors forrefractive index changes [11]. Conversely, the coupledquadrupole band is flat (which corresponds to large DOS) inall <strong>crystal</strong> directions, as it originates from the non-degeneratequadrupole mode with a large in-plane Q-factor that hasfour-fold symmetric radiation pattern. The first derivative ofthe dispersion diagram, ω(k), gives the group velocity.Therefore a flat band corresponds to a reduction in the groupvelocity of light and a consequent increase in the light-matterinteraction time. Thus, coupled quadrupole band is suitableto build lasers with very low threshold powers.Measuring Group Velocity Reduction:We experimentally demonstrated the predicted group velocityreduction by measuring the dispersion diagram of thecoupled cavity array fabricated in silicon (structures shownin Fig. 1 and measured band diagram in Fig. 3). The size ofthe device is 100µm×100µm (consisting of 3600 couplednanocavities). We used transmission spectrum with planewave excitation at various incidence angles, polarizations and4 <strong>IEEE</strong> LEOS NEWSLETTER April 2006
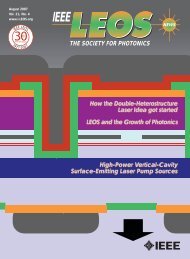
wavelengths to determine band diagram, and were able toprobe half of the ΓX and ΓM directions shown in Fig. 2[12]. Figs. 3a and 3b represent the measured band diagramsin the ΓX directions for x- and y-dipoles, respectively. Thedark blue stripes located between 1545-1565nm in thesefigures correspond to the positions of the coupled dipolebands. As expected from theory (Fig. 2), we obtained the flatx-dipole band and the non-flat y-dipole band in the ΓXdirection. The coupled quadrupole band has not beenobserved because its overlap with the plane-wave excitationis zero (but we have been able to observe it by non-planewave excitation [12]).Once we obtained the band diagram, we could estimatethe group velocity reduction from its first derivative. As itcan be seen from the measured band diagrams, the locationof the x-dipole mode is not changing at different k-points(tilt angles), which indicates that the group velocity shouldbe very small. However, based on our experimental resolutionin the tilt angle and frequency we set an upper limit forit in all directions to be below:V g|max = ωk = λ 1λ θ ≤ 8 × 10⁻³ cwhere ∆θ=π/180 is the tilt step in radians, ∆λ=0.2nm iswavelength resolution, λ=1564nm is the resonance wavelengthand c is the speed of light in vacuum.Coupled Nanocavity Array LasersBy fabricating same structures in an active material, we canbuild lasers with significantly improved output powers(resulting from coherent cavity coupling) compared to singlephotonic <strong>crystal</strong> cavity lasers, but with comparable thresholdvalues. An illustration of such a laser is shown in Fig. 4a. Todemonstrate lasing, we fabricated <strong>nanocavity</strong> <strong>arrays</strong> in InPlaser material system [13]. The active region contains fourInGaAsP quantum wells (QWs) with a peak photoluminescenceemission wavelength of 1560nm (Fig. 5). PhC parametersare the free-standing membrane thickness (d) of280nm, periodicity (a) of 500nm, and the hole radius (r)tuned from 160nm to 230nm to change the resonance frequencyof cavities. For comparison, single cavity lasers arealso fabricated on the same chip, with the same parameterrange (Fig. 4c). With these parameters, the quadrupole modefrequency calculated by FDTD falls within the gainlinewidth.The coupled PhC <strong>nanocavity</strong> array lasers with sizes~15µm are optically pumped at room temperature using aconfocal microscope with 0.6 NA objective lens. The pumpis a pulsed diode laser at 808nm (20ns long with 1% dutycycle) with 15-20µm spot size. Emitted light is coupled toan optical spectrum analyzer. To compare the performance ofthe coupled cavity array lasers to that of single <strong>nanocavity</strong>lasers (with size ~4µm), a similar setup with a beam spotsize of ~5µm is used. Single mode lasing is observed fromcoupled <strong>nanocavity</strong> array lasers (spectrum is shown in Fig.5). The lasing wavelength matches that of the phase-coupledquadrupole mode at the Γ-point calculated by FDTD.The profile of the lasing modes from a single cavity takenApril 2006 <strong>IEEE</strong> LEOS NEWSLETTER 5
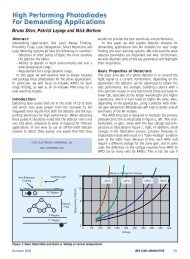
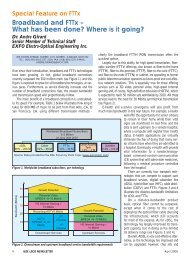
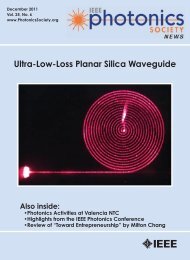
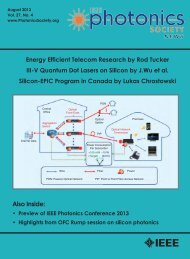
Acc. V Spot Magn WD5.00 kV 3.0 3500x 5.9 SIS XL. TIF5 µmAcc. V Spot Magn WD5.00 kV 3.0 3500x 5.9 SIS XL. TIF2 µmFigure 1. SEM pictures of the coupled <strong>nanocavity</strong> array structure fabricated in silicon on insulator. The parameters of the fabricated structuresare: the PhC periodicity a = 490 nm, the hole radius r = 190nm, the slab thickness d = 275 nm, and the coupled cavity array unitcell dimensions A×A = 3a×3a (i.e., two PhC layers are inserted between tiled nanocavities).a/λ0.360.340.320.30.280.260.240.220.2ΓΓ(a) (b) (c)MXXFigure 2. Band diagram of 2D coupled cavity array structure (shown in Fig. 1) for TElikemodes. Dielectric and air bands of the original square lattice are folded three timesseparately in ΓX, XM and ΓM and shaded in gray. Magnetic field pattern along the z-direction for: (a) quadrupole mode at X point; (b) quadrupole mode at M point; (c) monopolemode at Γ point; (d) x-dipole mode at X point. Unit cell in real space and location ofhigh symmetry points in the reciprocal space are also shown in the inset.(d)MQuadrupolex-Dipoley-DipoleDiagonal DipoleMonopoleBandedgewith an infrared-camera is shown in Fig.6a. It clearly shows the four-fold symmetryof the quadrupole mode. At the centerof the square, there is a strong field localization,corresponding to the location ofthe single defect. The radiation profile issimulated by the FDTD method, by calculatingthe time averaged Poynting vectorin the vertical direction. The radiationpatterns at a plane ~1µm above the structureis very similar to the experimentallymeasured field patterns. Due to poor sensitivityof the IR-camera, it was difficultto observe far field emission pattern of thelasers made in InP. However with samelaser structures fabricated in GaAs (withemission wavelength at 940nm) we havebeen able to capture far field pattern withhighly sensitive silicon camera (Fig. 6b).The pattern clearly demonstrated coherentlycoupled lasing action. Here, the lasingoccurred from dipole mode due to betteroverlap of dipole band with the gainmedium.Coupled <strong>nanocavity</strong> array lasers withdifferent r/a ratios have been tested andFig. 7a shows the measured lightout/light-in(LL) curve of one of them(blue). We have observed single-modelasing at 1534nm with a thresholdpeak pump power of ~2.4mW. Severalsingle cavity structures with differentr/a have also been tested. The LL-curveof one of them (with r/a≈0.4) is shown6 <strong>IEEE</strong> LEOS NEWSLETTER April 2006Γ
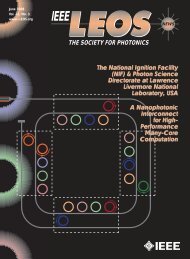
1565156515451545λ [nm]15251505Transmission [a.u.]λ [nm]15251505148514651460 148015001520 1540156015801600λ [nm]0 1 2 3 4 5 6 7 8 9 10 11 12 130 1 2 3 4 5 6 7 8 9 10tilt [°] tilt [°](a)14851465(b)Figure 3. (a) The measured coupled x-dipole band diagram in the ΓX direction (from the transmission spectrum) of the cavity array structurefrom Fig. 1. The dark blue stripe is the location of the coupled band. The horizontal axis is the tilt angle of the sample relative to excitationbeam, which corresponds to different k x -values; the vertical axis is the wavelength. The insets show the transmission spectrum at 0 ° tilt(at the Γ point), and the magnetic field (B z ) pattern of the coupled x-dipole mode at the X-point. (b) The measured band diagram for the coupledy-dipole band. The inset shows the magnetic field (B z ) pattern at the X point.QuantumWellsNanocavities2µm2µm(a)(b)Figure 4. (a) Schematic configuration of the coupled photonic <strong>crystal</strong> <strong>nanocavity</strong> array laser structure. (b) SEM pictures of a fabricated singlePhC cavity laser and a coupled PhC cavity array laser in InGaAsP-based material. The coupled array consists of 81 cavities (9x9) withtwo layers of photonic <strong>crystal</strong> in between.in Fig. 7 (red). The parameters of this cavity and thereforethe emission wavelength at 1543nm are quite similar tothe coupled cavity array laser. The threshold peak pumppower of the single cavity laser is around ~320µW. Themeasured lasing threshold of coupled photonic <strong>crystal</strong><strong>nanocavity</strong> <strong>arrays</strong> is about 10 times larger than for a singlecavity. On the other hand, the measured 20-foldincrease in differential quantum efficiency (DQE, definedas the slope of the LL-curve above threshold [14]) of thecavity array is larger than the increase in threshold,implying that a higher output power can be extracted per<strong>nanocavity</strong> in a coupled cavity array laser in comparisonto a single <strong>nanocavity</strong> laser. In fact, the maximum powerachieved from our coupled cavity array laser is greaterthan 12 µW, which is about 100 times larger than a singlecavity laser (Fig. 7a).Coherent coupling of VCSELs has also been previouslyinvestigated to improve laser output powers [15-17].However, since it is very challenging to control the uniformityof the VCSEL <strong>arrays</strong> and the coupling between individuallasers, phase-locked lasing is only observed from smallnumber of coupled VCSELs [16]. With photonic <strong>crystal</strong><strong>nanocavity</strong> <strong>arrays</strong>, we can control both the uniformity andthe coupling very precisely. As we indicated above, in silicon8 <strong>IEEE</strong> LEOS NEWSLETTER April 2006
AUTOMATICALLY-GENERATED CODE FLYING AT MACH 9.8.THAT’S MODEL-BASED DESIGN.When NASA made history bylaunching the X-43A,automatically-generated flight codewas at the controls for the vehicle’spropulsion and stability systems.Engineers developed the autopilotwithin a radically reduced timeframeusing Model-Based Design andSimulink. To learn more, go tomathworks.com/mbdAccelerating the pace of engineering and science©2006 THE MATHWORKS, INC.
Intensity [a.u.]43.532.521.510.50Intensity [a.u.]32.521.510.501533.5 1534 1534.5 1535λ [nm]1470 1490 1510 1530 1550 1570 1590 1610Figure 5. Spectrum of the coupled cavity array laser with a peak at 1534nm. The inset onthe left shows the zoomed-in portion of the spectrum fitted with a Lorentzian (green dashedcurve) of 0.23nm linewidth. The inset on the right shows the QW photoluminescence fromunprocessed wafer (QWs shown on the SEM image).(a)Collected Output Power [a.u.]45004000350030002500200015001000500λ [nm]Collected Output Power [a.u.]90807060504030201000.20.4 0.6 0.8 1 1.2 1.41.61.8Peak Pump Power [mW]we have able to construct very uniform structures consistingof 3600 coupled PhC nanocavities [12]. Moreover, in ourlaser each cavity occupies an area of only 1.5µm 2 (muchsmaller than a typical VCSEL), implying that an ultra-densepacking is achievable with coupled PC nanocavities lasers,which can also enable higher output powers.By fitting laser rate equations with the typical bulkInGaAsP QW parameters [18] to the measured LL-curves(Fig. 7b), we obtain a range of β values [0.09-0.15] and[0.05-0.09] for single and coupled cavity array laser, respectively.These values are already two orders of magnitude higherthan those of VCSELs, which is typically less than 10 -3 ,Intensity [a.u.]8765432101300 1350 1400 1450 1500 1550 1600 1650λ [nm]—100nm10 <strong>IEEE</strong> LEOS NEWSLETTER April 2006Output Power [a.u.]indicating that the cavity effects in photonic<strong>crystal</strong> are significant [14].Laser Differential QuantumEfficiency ImprovementAlthough we have 81 available cavitiesin the array, it is expected that not all ofthem are lasing together, due to fabricationimperfections. In order to estimatethe number of coherently coupled cavities,n c , we have solved rate equations[14] for n c changing from 10, 40 to 70and compare them with the solution fora single cavity laser (Fig. 7b). In equations,we set the ratio of pumped activevolume (V a ) of the cavity array to that ofa single cavity as 10, which is estimatedfrom the size of the pumping beam.When we compare the experimental andtheoretical curves shown in Fig. 7a and7b, respectively, we estimate that amajority of available 81 cavities is actuallycoherently coupled.The reason for the DQE improvementin coupled cavity array lasercomes from two effects [13]. First oneis due to cavity effects. Because of nonnegligibleβ values, an increase inV mode reduces the loss and thusincreases DQE. Second effect comesfrom more efficient pumping. In PhC<strong>nanocavity</strong> array lasers, the pumped76active volume V a increases slower thanthe mode volume V5mode with anincrease in the number of cavities.4Hence, the ratio V mode /V a is larger for3<strong>nanocavity</strong> array laser than for a singlePC cavity laser, leading an increase in2DQE. This gives a better overlap(b)Single Cavity1between the pumped area and the cavitymode. In a single PC cavity laser, itCoupled Cavity Arrayis extremely difficult to pump only thecentral cavity region, and the pumpalso generates carriers inside the mirrors,which do not couple to the lasingmode; hence PhC cavity laser is notpumped efficiently. On the other hand, in a coupled PhCcavity array laser one can pack larger number of lasersmore efficiently by reducing the space used as mirrors,and the overlap between the pumped region and the cavitymode is better.000 1 2 3 4 5 6 0 1 2 3 4 5 6Figure 6. (a) The IR-camera image (left) and the simulated Peak Pump time-averaged Power [mW] Poynting vectorin the vertical direction (right) of the lasing mode for a single cavity laser. The size ofInput Power [mW]the structure is indicated by the dashed square. (b) Far field image of a coherently coupled<strong>nanocavity</strong> array laser. The size of the cavity array laser is indicated by dashed square.ConclusionIn conclusion, we have proposed 2D coupled photonic<strong>crystal</strong> <strong>nanocavity</strong> <strong>arrays</strong>, and experimentally demonstratedtheir band diagram, confirming flat, coupled defectbands with group velocities below 0.008c. We have usedthis structure to improve the output power of photonic
<strong>crystal</strong> lasers. By coherently coupling photonic <strong>crystal</strong><strong>nanocavity</strong> lasers in ultra-dense <strong>arrays</strong>, we have shownthat the differential quantum efficiencies can be improveddramatically, without sacrificing the low lasing thresholdsof single PhC <strong>nanocavity</strong> lasers. We have measuredpeak output powers from the PhC laser array that aremore than two orders of magnitude higher than in a singlePhC cavity laser. Output powers comparable to conventionalsingle mode VCSELs, but at much lower thresholdpump powers, can be achieved by coupling even largernumbers of PhC cavities. We expect that such structurescan also be directly modulated at high speeds, as aresult of a strong localization of light [2], implying thatcoupled <strong>nanocavity</strong> <strong>arrays</strong> can be an effective way toachieve high power and high-speed single mode lasersources.AcknowledgmentsThis work has been supported by the MARCOInterconnect Focus Center, NSF ECS-04-24080, andMURI Center for <strong>Photonic</strong> Quantum InformationSystems. The authors would like to thank Dirk Englundfor help with measuring the radiation pattern of the coupledcavity array.982-984 (2005)[12] Altug, H. & Vuckovic, J. Experimental demonstrationof the slow group velocity of light in twodimensionalcoupled photonic <strong>crystal</strong> microcavity<strong>arrays</strong>, Appl. Phys. Lett. 86, 111102 (2005)[13] Altug, H. & Vuckovic, J. <strong>Photonic</strong> <strong>crystal</strong> <strong>nanocavity</strong>array laser. Optics Express 13, 8820-8828 (2005).[14] Coldren, L. A. & Corzine S. W. Diode Lasers and<strong>Photonic</strong> Integrated Circuits. New York: Wiley,1995[15] Deppe, D. G., et al. Phase-coupled two-dimensionalAl x Ga 1–x As-GaAs vertical-cavity surface-emittinglaser array, Appl. Phys. Lett. 56, 2089-2091 (1990)[16] Warren, M. E., et al. On-axis far-field emission fromtwo-dimensional phase-locked vertical cavity surface-emittinglaser <strong>arrays</strong> with an integrated phasecorrector,Appl. Phys. Lett., 61, 1484-1486 (1992)[17] Raftery, J. J., et al. Coherent coupling of two-dimensional<strong>arrays</strong> of defect cavities in photonic <strong>crystal</strong>vertical cavity surface-emitting lasers, Appl. Phys.Lett. 86, 201104- (2005)[18] Baba, T. <strong>Photonic</strong> <strong>crystal</strong>s and microdisk cavitiesbased on GaInAsP-InP system, <strong>IEEE</strong> J. Select. TopicsQuantum Electron., 3, 808-811 (1997)References[1] Purcell, E. Spontaneous emission Probabilities atRadio Frequencies. Phys. Rev. 69, 681 (1946).[2] Yamamoto, Y. et al. Microcavity semiconductor laserwith enhanced spontaneous emission, Phys. Rev. A44, 657-668 (1991)[3] Yablonovitch, E., Inhibited spontaneous emission insolid-state physics and electronics. Phys. Rev. Lett.58, 2059-2062 (1987)[4] John, S. Strong localization of photons in certain disordereddielectric superlattices. Phys. Rev. Lett. 58,2486-2489 (1987).[5] Englund, D., et al. Controlling the SpontaneousEmission rate of Single Quantum Dots in a 2D<strong>Photonic</strong> Crystal. Phys. Rev. Lett. 95, 013904(2005).[6] Song, B. S., et al. Ultra-high-Q photonic double-heterostructure<strong>nanocavity</strong>. Nature materials 4, 207-210 (2005)[7] Painter, O., et al. Two-dimensional photonic bandgapdefect mode laser. Science 284, 1819–1821(1999).[8] Loncar, M., et al. Low-threshold photonic <strong>crystal</strong>laser. Appl. Phys. Lett. 81, 2680-2682 (2002).[9] Park, H. G., et. al. Electrically Driven Single-Cell<strong>Photonic</strong> Crystal Laser. Science 305, 1444-14447(2004).[10] Altug, H. & Vuckovic, J. Two-dimensional coupledphotonic <strong>crystal</strong> resonator <strong>arrays</strong>. Appl. Phys. Lett.84, 161-163 (2004).[11]Altug, H. & Vuckovic, J. Polarization controland sensing with two-dimensional coupled photonic<strong>crystal</strong> microcavity <strong>arrays</strong>. Opt. Lett. 30,April 2006 <strong>IEEE</strong> LEOS NEWSLETTER 11