PDF (714.6 KB) - Oil & Gas Science and Technology - IFP Energies ...
PDF (714.6 KB) - Oil & Gas Science and Technology - IFP Energies ...
PDF (714.6 KB) - Oil & Gas Science and Technology - IFP Energies ...
- No tags were found...

You also want an ePaper? Increase the reach of your titles
YUMPU automatically turns print PDFs into web optimized ePapers that Google loves.
<strong>Oil</strong> & <strong>Gas</strong> <strong>Science</strong> <strong>and</strong> <strong>Technology</strong> – Rev. <strong>IFP</strong> <strong>Energies</strong> nouvelles, Vol. 67 (2012), No. 3, pp. 379-385Copyright © 2012, <strong>IFP</strong> <strong>Energies</strong> nouvellesDOI: 10.2516/ogst/2011175Mathematical Model <strong>and</strong> Simulation of <strong>Gas</strong> HydrateReservoir Decomposition by DepressurizationJ. Zhao*, D. Shi <strong>and</strong> Y. ZhaoMining <strong>Technology</strong> Institute, Taiyuan University of <strong>Technology</strong>, Taiyuan 030024 - PR Chinae-mail: zjz1104@163.com - Dingxian_shi@yahoo.com - y-s-zhao@263.net* Corresponding authorRésumé — Modèle mathématique et simulation de dépressurisation et de décompression d’unréservoir d’hydrates de méthane — Le modèle numérique présenté ici simule la dépressurisationd’hydrates de méthane dans un réservoir confiné ; il se base sur le principe de conservation de la masseen milieu poreux, en intégrant la théorie de l’écoulement polyphasique et la cinétique de dissociation deshydrates de méthane. La méthode implicite et universelle des différences finies est utilisée et leprogramme informatique qui s’y rapporte est développé. Lors de l’exploitation du réservoir d’hydrates deméthane, la répartition et les changements physiques sont analysés et les lois sur la dissociation deshydrates de méthane et la production de gaz sont étudiées à partir des calculs. Une simulation numériquemontre que la pression dans le réservoir diminue lentement, ce qui permet au réservoir de se stabiliser etdiminue inévitablement le rendement de l’exploitation d’hydrates de méthane lors du processus dedépressurisation. Le rythme de production du gaz est contrôlé par la pression au puits. Les résultatsprésentés montrent comment ce modèle peut être utilisé pour proposer une pression abaissée au fond dupuits afin de récupérer l’hydrate de méthane. De plus, ces résultats démontrent qu’ils dépendent despropriétés des hydrates de méthane et du réservoir.Abstract — Mathematical Model <strong>and</strong> Simulation of <strong>Gas</strong> Hydrate Reservoir Decomposition byDepressurization — The numerical model for the depressurization of methane hydrates in a confinedreservoir is presented based on mass conservation in porous media, incorporating multiphase flowtheory <strong>and</strong> kinetics of gas hydrate dissociation. The universal implicit difference method is adopted, <strong>and</strong>the corresponding computer program is developed. During the production of the hydrate reservoir,distribution <strong>and</strong> the physical changes are analyzed <strong>and</strong> the gas hydrate dissociation <strong>and</strong> gas productionlaw are studied from the computation. A numerical simulation shows that the reservoir pressure isdescending slowly, which benefits the stabilization of the reservoir <strong>and</strong> inevitably decreases the efficiencyin the production of gas hydrates in the depressurizing process. The gas production rate is controlled bythe well pressure. The results are presented to show how this model may be used to estimate a lowerdownhole pressure of the well for hydrate recovery <strong>and</strong> how these results depend on reservoir <strong>and</strong>hydrate properties.
J Zhao et al. / Mathematical Model <strong>and</strong> Simulation of <strong>Gas</strong> Hydrate Reservoir Decomposition by Depressurization 3811 MATHEMATICAL MODEL1.1 Physical Basis ConditionsHydrate reservoir depressurization is a complex physicalchemicalprocess which involves dissociation <strong>and</strong> reformation,heat transfer, deformation of the porous medium, migrationof gas with water <strong>and</strong> other aspects. In order to make themathematical model more accurate <strong>and</strong> simplified, somebasic assumptions are introduced as follows:– the solid hydrate is considered as a part of the pores inconsideration of the gas, water <strong>and</strong> hydrate phase;– the hydrate phase is not participating in flow <strong>and</strong> gas withwater following Darcy’s law;– the gravity <strong>and</strong> capillary forces are not considered;– the reformation of hydrate after dissociation at suitabletemperature <strong>and</strong> pressure, <strong>and</strong> thermal effects of dissociationare not considered;– the Thomson throttling effect in the flow process isignored.1.2 Basic Governing EquationsHydrates constantly reduce as dissociation of the gas hydratereservoir while gas with water as the products of dissociationare also changing thanks to seepage. By the continuity at Δttime steps, the cumulative unit body mass of each phaseshould be equal to its dissociation <strong>and</strong> incremental quality ofinflow <strong>and</strong> outflow. So, the mass balance equations for gas,water <strong>and</strong> hydrate flow through the porous medium can bewritten as:⎧ ⎛ kk ⎞rg⎪∇⎜ρg∇p qg mg ρφgSg⎪ ⎝ μg ⎠t⎪ ⎛ kk ⎞rw⎨∇⎜ρw∇p q m ρφS⎪ ⎝ μw⎠t⎪⎪− mH = ∂ ( ρHφS) H⎪ ∂ t⎩The equations consider the compressibility <strong>and</strong> therelative permeability of fluid, hydrate <strong>and</strong> porous media.Each parameter in the equation is the function of unknownssuch as density, porosity <strong>and</strong> relative permeability. Hence,the equations are significantly nonlinear. Each parametersatisfies the following relationship:⎧ρα= ρα( p)⎪μα= μα( p)⎨⎪krα= krα( Sw)⎩⎪φ=φ( p)⎟ + + = ∂ ∂ ( )⎟+ + = ∂ ∂ ( )w w w w(1)(α = w, g) (2)In addition, the pores are filled with hydrate, gas <strong>and</strong>water based on assumption (2). So, the saturation satisfies thefollowing equation:S g + S w + S H = 1 (3)where S g , S w , <strong>and</strong> S H are saturation of gas, water <strong>and</strong> hydratephases, respectively.Energy balance at the dissociation front is given by:∂q C T q C T K T KT 121ρ1−2ρ2−12Hm∂ x+ ∂=Δ∂xg g p g g p hwhere K n is the heat conductivity in the gas <strong>and</strong> hydrate zone,ρ g is the density of natural gas in the dissociation zone, m h isthe hydrate dissociation rate per unit area <strong>and</strong> C P is the heatcapacity of natural gas. In Equation (4), the first term on theleft h<strong>and</strong> side is the convective heat flux out of the dissociationfront into the gas zone; the second term is the convectiveheat flux from the hydrate zone into the dissociation front.The third term is conductive heat flux from the dissociationfront to the gas zone. The fourth term is the conductive heatflux from the hydrate zone into the dissociation front. Theterm on the right side is the rate of heat supplied for hydratedissociation per unit time <strong>and</strong> area.The governing equations of hydrate reservoir productionare combined from Equation (1) to Equation (4), in which thenumber of unknowns is equal to the number of equations, sothey can be solved.1.3 Auxiliary EquationThe hydrate dissociation can be represented by the reaction:(4)M(g) + N H H 2 O(l) ⇔ Μ ·N H H 2 O(s) (5)where M is the guest molecule in hydrate formation <strong>and</strong> N H(commonly known as the hydrate number) is the number ofwater molecules required per gas molecule to form a gashydrate. The hydrate number for methane is approximately 6(Sloan et al., 2008). The rate of gas generation caused byhydrate dissociation is given by the Kim–Bishnoi model(Kim et al., 1987):m H = K d A s (p e – p) (6)According to the principle of mass conservation, i.e.:where (Amyx et al., 1960):Asm H = m w + m g (7)wg= ⎛ ⎝ ⎜ φ ⎞2k⎟⎠The hydrate itself as a solid phase is not involved in flow<strong>and</strong> mobile spaces constantly grow during the dissociationprocess of the hydrate reservoir. Here, k is the absolute12(8)
382<strong>Oil</strong> & <strong>Gas</strong> <strong>Science</strong> <strong>and</strong> <strong>Technology</strong> – Rev. <strong>IFP</strong> <strong>Energies</strong> nouvelles, Vol. 67 (2012), No. 3permeability of the media <strong>and</strong> is modeled as (Masuda et al.,2005):k = k D0 (1 – S H ) N (9)where k D0 is the absolute permeability at zero hydratesaturation <strong>and</strong> N is the permeability reduction index, whichdepends on the pore structure of the medium. Note thatEquation (9) satisfies the expected limit at S H = 0 or 1 <strong>and</strong> thevalue of the permeability index N is determinedexperimentally.In this study, the relative permeability functions k rg (S w , S g )<strong>and</strong> k rw (S w , S g ) are evaluated with Corey’s model (Moridiset al., 2007):mk k S Sm 212 /rw=⎡1/rwo w1−( 1−⎤⎣⎢w ) ⎦⎥(10)1/ 2 1/m2mk = k S 1− S wHOf which:SSwgrg rgo gSw− SwrS + S −S=; SwH=1−S−S1−S−Swr1.4 Boundary ConditionsThe initial conditions of the model are:( ) = ( )⎧0p x, y, t |t=0p x,y⎪0⎪Sg( x, y, t) |t=0= Sg( x,y)⎨0⎪Sw( xyt , , ) |t=0= Sw( xy , )⎪0⎩SH ( x, y, t) |t=0= SH( x,yBoundary conditions of the model– internal boundary conditions:( )= () ( )( )⎧0⎪qα x, y, t qα t δ x,y⎨0⎩⎪ pwf( x, y,t)= pwf() t δ xy ,– outer boundary conditions:⎧⎪pxyt ( , , ) = p xytxy e( , , )( , ) ∈Γ⎨⎩⎪ ∂p∂ n = 0xy , ∈Γ2 NUMERICAL METHOD OF SOLUTIONgr= 1 − S − S − S1−S−Sw H wrwr( )grw H wr(11)(12)(13)(14)The governing equations of hydrate reservoir production area set of highly nonlinear equations. ρ, ϕ, μ <strong>and</strong> k r are functionsof the unknown variables in which k r has stronger nonlinearity.In the traditional IMPES, i.e. implicit pressurewr)grorexplicit saturation solution method, the adopted linearizationmethod is an explicit approach which takes a uniform valueof the upper time step. In addition to items of Darcy’s flow,the items of production <strong>and</strong> dissociation themselves are functionsof solved variables. So, the IMPES method undoubtedlycauses a very considerable error of mass balance <strong>and</strong> thenmay sometimes not be solved due to divergence of solutions.In this work, the universal implications difference methodis adopted to deal with the nonlinear nature of the equations.δp, δS w , <strong>and</strong> δS H are considered as unknown variables tocouple equations <strong>and</strong> to be solved. The implicit itemprocessing is undertaken on the flow coefficient, source-sinkof wells, dissociation items <strong>and</strong> cumulative values. From theTaylor expansion, the first-order infinitesimal quantity isobtained. The first derivative takes the original order valuerather than the values of the upper stage. Universalimplication discretization equations are solved as follows:k( gg gw wg g )k+ 1 k+1k k∇ T ∇ δP+ ρ λ’ δS ∇ P + λ ρ’δP∇P⎛+ ∂ qg+ ∂ m⎞g 1 k 1 k+1 k⎜ −∂ ∂ Δ( φSg) ρ’ g− ρgSgϕ’ ⎟δP⎝ P P tΔ t ⎠⎛q+ ⎜∂ ⎜⎝∂Sgw⎛q+ ⎜∂ ⎜⎝∂SgH∇⎡k+ 1 k+1kk k⎣T ∇ P+ ∇ P + P ∇P⎤wδ ρwλ’ wwρ’wδ λw⎦⎡+ ∂ qwmwkk k+ ∂ 1 1 + 1 ⎤− ( Sw) w−wSw′ P⎣⎢φ ρ’ρ ϕ∂P∂PΔ tΔ t ⎦⎥δ⎧+ ∂ q+ ∂ ⎫wmw1 k+1⎨ − ( φρw) ⎬δSw⎩∂Sw∂SwΔ t ⎭⎛+ ∂ qw+ ∂ m ⎞w⎜ ⎟δSH⎝∂S∂S⎠H1 ⎡Δt⎣m+ ∂ ∂Sk= ( φρ S ) − ( φρ S )w⎡∂m⎤H1 k 1 k+1 k− ( ) − ′⎣⎢ φSHρ’HρHSHϕ∂ Δ Δ ⎦⎥δPP tt⎛+ ∂ m ⎞ ⎡wmHk⎜ ⎟ Sw+ ∂ 1 + 1⎤δ ⎢ − ( φρH) ⎥δSH⎝ ∂S⎠ ⎣ ∂SΔ t ⎦w( )k+1φρg g+wm+ ∂ ∂S1 ⎡φρgSΔt⎣HHwΔt( )k+1φρg g+Δt1= ⎡ ( knφρHS ) HφρHSHmΔt ⎣− ( ) ⎤⎦ −w⎞⎟δS⎟⎠Hwnw⎞⎟δS⎟⎠kn k k= ( g)− ( φρ ⎤g g)⎦ − − −∇ ∇g g gHS q m T P⎤⎦ − k kqw−mw− Tw∇P(15)(16)(17)Among which: T α = ρ α·λ α , λ α = kk rα /μ α , (α = w, g) (18)kH( )( )kk
J Zhao et al. / Mathematical Model <strong>and</strong> Simulation of <strong>Gas</strong> Hydrate Reservoir Decomposition by Depressurization 383Coupling (15-17) a set of algebraic equations can betaken. For the calculation domain containing NEL nodes, alllinear equations of the first k iterations can be written in thefollowing matrix form:J k·δX = B k (19)Among which J is a 3 × NEL order b<strong>and</strong>ed sparse matrixcontaining five blocks of diagonal structures, which contain aNEL × NEL three-dimensional non-symmetric sub-matrix.δX is the unknown columns’ vector of increment betweenadjacency iterations in the all independent variables in which:δX i = {δp δS w δS H }, i = 1, 2, ..., NEL (20)B is the known column vector of the right end. The Gauss-Jordan elimination method of the pivoting element is adoptedto solve the sparse matrix equation since the diagonalelements are different by several orders of magnitude.After calculation, the solving variable is replaced, <strong>and</strong> J k+1<strong>and</strong> B k+1 are re-calculated according to δX. Then, the k+1iteration step of the calculation begins until iteration toδX→ 0. Hence, the iteration is implicitly deeper, the solutionprocess is more stable <strong>and</strong> more accurate results areachieved.3 NUMERICAL SIMULATIONAccording to the actual geological conditions of a hydratereservoir (Klauda et al., 2005; Sloan et al., 2008), thecalculation model is shown in Figure 1. The center of themodel is the production well, which is a constant downholepressure well. The well index is as follows:qg2πkkrgh= Pij,−PreμΔgV lnrw( wf)(21)The 1/4 X-Y cross-section is selected for the calculation,taking into account the symmetry of the model. Theboundaries of the model are set to be fixed conditionsaccording to the geological conditions <strong>and</strong> the symmetry (seeFig. 1).According to the actual situation, the porosity is set to be0.25, initial hydrate saturation to be 0.4, gas saturation to be0.6, the absolute permeability without the presence of hydrateto be 1.0 μm 2 <strong>and</strong> the decrease index to be 5. Relativepermeability of the gas-water is calculated according toEquation (8) in which water saturation is 0.2, critical saturationof gas is 0.1, the fitting parameter m is 0.6 <strong>and</strong> the initialviscosity of water <strong>and</strong> gas is 1.0 MPa⋅s <strong>and</strong> 0.018 MPa⋅s,respectively. Compressed coefficients of porosity, hydrate <strong>and</strong>water are obtained to be 1.0 × 10 -4 MPa -1 , 2.0 × 10 -4 MPa -1 <strong>and</strong>4.0 × 10 -4 MPa -1 , respectively. Original formation pressure is4.0 MPa <strong>and</strong> the method of production in gas wells isconstant pressure in the downhole; <strong>and</strong> the pressure of thedownhole of the well is 3.0 MPa. The initial temperature ofthe hydrate reservoir is 4.5°C (the corresponding hydratephase equilibrium pressure is 3.875 MPa) (Sloan et al., 2008),hydrate reservoir thickness is 10 m <strong>and</strong> the dissociationconstant (Lijun Yan et al., 2005) is 0.124 × 10 -13 kg/m 2 ⋅Pa⋅s.The hydrate number is 6.The initial flow vector field distribution of production isshown in Figure 2. The pressure gradient drives high-pressuregas filling the pores to flow. The flow speed is faster <strong>and</strong> thepressure drop is more noticeable to the well of the large pressuregradient. When the pressure is reduced to below hydratedissociation pressure, the phase equilibrium condition of thehydrate is shifted in the pore <strong>and</strong> hydrate dissociation occurs.The gas <strong>and</strong> water of hydrate dissociation as output isinvolved in the flow moving to the well <strong>and</strong> output from theproducing wells. The gas flow is not yet started. The pressureremains constant <strong>and</strong> the hydrate in the pores does not500ZProduct wellY500 m500 mY-coordinate400300200OX100OFigure 1Schematic diagram of numerical model.X00 100 200 300X-coordinateFigure 2Vector of seepage at 60 days.400 500
384<strong>Oil</strong> & <strong>Gas</strong> <strong>Science</strong> <strong>and</strong> <strong>Technology</strong> – Rev. <strong>IFP</strong> <strong>Energies</strong> nouvelles, Vol. 67 (2012), No. 3500400 3.803.76 3.753.733.673.683.72 3.705004001.503.003.50Y-coordinate3002001003.843.863.78Y (m)300 1.202002.502.502.502.0000Figure 31003.83 3.81200 300X-coordinate400 5001004.0000Figure 42.503.501001.501.20 1.202.00200 300X (m)400 500Pressure distribution at 120 days.Temperature distribution at 120 days.Y-coordinate5004003000.6850.6820.6880.6870.6862000.6360.680100 0.618 0.6450.6760.6090.627 0.6530.6620.67100 100 200 300 400 500X-coordinateFigure 5<strong>Gas</strong> saturation distribution at 120 days.Y-coordinate50040030020010000Figure 60.0400.24 0.16 0.120.32 0.200.36 0.28100Hydrates saturation distribution at 120 days.0.0100.00500.0200.080200 300 400 500X-coordinatedissociate due to the pressure gradient being zero far awayfrom the wellbore.Figures 3 <strong>and</strong> 4 show the evolution of the P <strong>and</strong> Tdistributions, respectively, after 120 days of the hydratereservoir dissociation. The reservoir pressure drop is not large(the initial pressure is 4.0 MPa) <strong>and</strong> the spatial variations ofthe pressure gradient are also small. As gas hydratedissociation is accompanied by the water output, the pressuredrop is no doubt slower in the hydrate reservoir than in aconventional gas reservoir during gas production. Ofparticular interest is the T distribution in Figure 4, whichexhibits a minimum at the edge of the dissociation front <strong>and</strong>confirms the earlier statement (based on knowledge of theCH 4 –hydrate phase diagram) that no ice evolves during thedissociation process. At the front of hydrate dissociation, thetemperature of the hydrate reservoir decreased rapidly. Withthe vector of fluid seepage increases the temperature graduallyincreased close to the wall hole. The temperature is close tothe initial temperature of the reservoir near the wall hole.Figures 5 <strong>and</strong> 6 are gas <strong>and</strong> gas hydrate saturationdistribution, respectively. It can be seen that the gas hydratedissociation is completed in the areas of rapidly decreasedpressure around the well after production of 120 days. Thedissociation front (where hydrate saturation is equal to theinitial value) is gradually moving away from the well <strong>and</strong> thescope of dissociation is further exp<strong>and</strong>ing. The numericalresults show that the hydrate dissociation is fully completedwithin the model <strong>and</strong> the residual gas <strong>and</strong> water in pores willcontinue to flow under a pressure gradient in the direction ofthe well after production of 10 months.
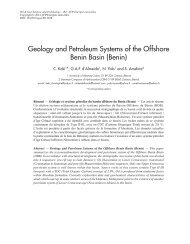
J Zhao et al. / Mathematical Model <strong>and</strong> Simulation of <strong>Gas</strong> Hydrate Reservoir Decomposition by Depressurization 385Dissociated hydrate percent (%)10080604020P wf = 1.0P wf = 2.0P wf = 3.0lengthy production process of the hydrate reservoir. So, asuitable wellbore pressure can effectively improve thedissociation rate <strong>and</strong> access to balance between productionspeed with the reservoir stability.ACKNOWLEDGMENTSProject 51074111, 2011011005 supported by the NationalNatural <strong>Science</strong> Foundation of China <strong>and</strong> Shanxi Natural<strong>Science</strong> Foundation.REFERENCES00 50 100 150 200Times (day)Figure 7Hydrate dissociation at different product well pressure.250The total amount of hydrates dissociated in relation to theproduction time is shown in Figure 7 at different downholepressures. It can be seen from the figure that the lower thedownhole pressure, the faster the hydrate dissociation. Thereason is that the formation of the gas flow gradient is largerto speed up the reservoir pressure drops which promotehydrate dissociation <strong>and</strong> the movement of the dissociationfront is significantly accelerated at the lower downholepressure.CONCLUSIONThe production mathematical model of gas hydrate reservoirdepressurization is established <strong>and</strong> the nonlinear equationsare solved by the introduction of a fully implicit finitedifference method. The calculation method has goodnumerical stability <strong>and</strong> high accuracy. A correspondingnumerical calculation program is prepared. The fieldvariables in the spatial distribution with the time, dissociationfront movement <strong>and</strong> transport law of gas with water can beaccurately obtained from the calculation program.The pressure drop of the hydrate reservoir is sloweddown, which is helpful for controlling the reservoir pressureto ensure the security <strong>and</strong> stability of the production processaccording to the results of depressurizing the process.However, on the other h<strong>and</strong>, it will undoubtedly lead to aAmyx J.W., Bass D.M., Whiting R.L. (1960) Petroleum ReservoirEngineering-Physical Properties, McGraw-Hill Book Co.,New-York.Ayhan D. (2010) Methane hydrates as potential energy resource:Part 2 – Methane production processes from gas hydrates, EnergyConvers. Manage. 51, 7, 1562-1571.Clarke M.A., Bishnoi P.R. (2001) Determination of the intrinsicrate of ethane gas hydrate decomposition, Chem. Eng. Sci. 55, 21,4869-4883.Clarke M.A., Bishnoi P.R. (2005) Determination of the intrinsickinetics of CO 2 gas hydrate formation using in situ particle sizeanalysis, Chem. Eng. Sci. 60, 3, 695-709.Kehua S., Changyu S., Xin Y., Guangjin C., Shuanshi F. (2010)Experimental investigation of methane hydrate decomposition bydepressurizing in porous media with 3-Dimension device, J. Nat.<strong>Gas</strong> Chem. 19, 3, 210-216.Kim H.C., Bishnoi P.R., Heidemann R.A., Rizvi S.S.H. (1987)Kinetics of methane hydrate decomposition, Chem. Eng. Sci. 42, 7,1645-1653.Klauda J.B., S<strong>and</strong>ler S.I. (2005) Global distribution of methanehydrate in ocean sediment, Energy Fuels 19, 2, 459-470.Lijun Y., Guangjin C., Weixin P., Jiang L. (2005) Experimental <strong>and</strong>Modeling Study on Hydrate Formation in Wet Activated Carbon,J. Phys. Chem. B 109, 12, 6025-6030.Makogon Y.F., Holditch S.A. (2001) Experiments illustrate hydratemorphology <strong>and</strong> kinetics, <strong>Gas</strong> <strong>Oil</strong> J. 99, 7, 45-50.Makogon Y.F. (2010) Natural gas hydrates – A promising source ofenergy, J. Nat. <strong>Gas</strong> Sci. Eng. 2, 1, 49-59.Masuda Y., Konno Y., Kurihara M., Ouchi H., Kamata Y.,Ebinuma T., Narita H. (2005) Validation study of numericalsimulator predicting gas production performance from sedimentscontaining methane hydrates, Proceedings of the 5th InternationalConference on <strong>Gas</strong> Hydrates, Trondheim, Norway, June 12-16.Moridis G.J., Sloan E.D. (2007) <strong>Gas</strong> production potential ofdisperse low-saturation hydrate accumulations in oceanic sediments,Energy Convers. Manage. 48, 6, 1834-1849.Sloan E.D., Carolyn A.K. (2008) Clathrate Hydrates of Natural<strong>Gas</strong>, 3rd ed., CRC Press, New York.Final manuscript received in October 2011Published online in May 2012Copyright © 2012 <strong>IFP</strong> <strong>Energies</strong> nouvellesPermission to make digital or hard copies of part or all of this work for personal or classroom use is granted without fee provided that copies are not madeor distributed for profit or commercial advantage <strong>and</strong> that copies bear this notice <strong>and</strong> the full citation on the first page. Copyrights for components of thiswork owned by others than <strong>IFP</strong> <strong>Energies</strong> nouvelles must be honored. Abstracting with credit is permitted. To copy otherwise, to republish, to post onservers, or to redistribute to lists, requires prior specific permission <strong>and</strong>/or a fee: Request permission from Information Mission, <strong>IFP</strong> <strong>Energies</strong> nouvelles,fax. +33 1 47 52 70 96, or revueogst@ifpen.fr.