RICHARD V. EBERT, CRAIG W. BORDEN, WENDELL H. HALL and ...
RICHARD V. EBERT, CRAIG W. BORDEN, WENDELL H. HALL and ... RICHARD V. EBERT, CRAIG W. BORDEN, WENDELL H. HALL and ...
380 SHOCK DUE TO BACTERIAL TOXIN TABLE 2.—Effect of Hemonhage (10 ml. per Kg.) on Hypotension Produced by Meningococciis Toxin DOE 5 6 S 12 Cardiac Output L./Kg./Min. Before .716 .315 .134 .105 After .060 .077 .065 .071 Total Periphera Mean Arterial Resistance Pressure mm. Hg dynes/seconds/ cm." 1 Before 97 74 S6 75 After 56 55 4S 50 Before 7594 1971 4916 6260 After S623 5957 5658 6595 .factor for the hypotension induced by the toxin. The effect of reduction of blood volume on the hypotension produced by toxin was studied. Four animals were given toxin intravenously. After the maximum decline in arterial pressure had occurred, blood in the amount of one per cent of the body weight was removed. The observations were repeated ten minutes later (table 2). The further decline in arterial pressure was principally associated with a marked further reduction in cardiac output in all four animals consequent to further impairment of venous return by the hemorrhage. Calculation of the T.P.R., which showed a marked increase in one experiment (dog 6), and probably insignificant increases in the three others, supports this contention. A hemorrhage of this magnitude in the normal animal would have relatively little permanent •effect on cardiac output and arterial pressure. Inasmuch as the hypotension and reduction in cardiac output following the administration of toxin was accompanied by a reduction in Don 1 2 4 6 7 10 13 15 16 22 systemic and pulmonary venous pressure, an experiment was performed to determine the effect of increasing the blood volume on the circulation. Hypervolemia was produced by the intravenous infusion of 6 per cent dextran in 0.85 per cent saline. Toxin was first administered to the animals. When a maximum decline in arterial pressure had occurred, dextran solution in the amount of 30 ml. per Kg. was administered. Observations were made immediately before and after the infusion of dextran. The results on 10 animals are given in table 3. The right atrial pressure and the cardiac output increased after dextran infusion to above the control level, while the increase in arterial pressure was of a lesser degree. This was apprently due to the fact that there was a marked decline in total peripheral resistance after administration of dextran in the majority of experiments. The effect of levarterenol on the arterial pressure and cardiac output was studied in eight animals. Observations on the effect of levarterenol prior to the administration of toxin revealed that a moderate pressor response was produced by infusion at the rate of 20 tig. per min. A marked pressor response was produced by infusion at the rate of 40 ^g- per min. Following administration of toxin and development of hypotension, a larger quantity of levarterenol was required to produce a pressor response in some of the animals. The course of a typical experiment is shown in figure 1. The amount of levarterenol required to produce a rise in arterial pressure of 20 TABLE 3.—Effect of Dextran (SO ml. per Kg.) on Hypotension Produced by Meningococciis Toxin Mean Arterial Pressure mm. Hg Before 76 73 53 74 64 42 55 65 55 78 After 129 130 102 S2 6S 63 125 104 91 107 Right Atr al Pressure mm Hg Before -0.2 -1.5 -2.0 -2.5 -0.5 -0.2 -2.6 -0.6 -4.0 -3.S After +0.5 + 14.3 +2.0 +0.2 0 0 -0.2 +0.5 +0.5 +0.7 Before .116 .128 .144 .315 .077 .063 .OSO .057 .045 .128 Cardiac output L./Kg /min. After .218 .410 .318 .274 .103 .200 .280 .322 .364 .305 Total Peripheral Resistance dynes/ seconds/cm."* Before 5475 7113 4196 1971 6647 6274 504S 7113 10723 5874 Downloaded from http://circres.ahajournals.org/ by guest on November 28, 2012 After 4955 3969 3650 2504 5275 2997 3290 2025 21S5 3423
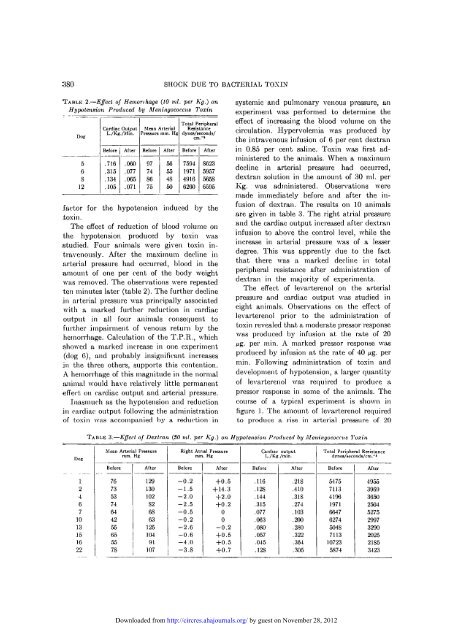
Arterial Pratsure Heart Rate per rain. Cardiac Output l./mln. tAQ iao &o too too 4 Atrial Pressure 4 mm. Hq t - ml. Procedure Tirao minutei .1 : I • || | : • t t ft' III EBERT, BORDEN, HALL AND GOLD 381 I • Mil Illl . 1 • • | t t to 1 s. s FIG. 1. Graphic representation of the course of a typical experiment (dog No. 15) showing response of the mean arterial pressure, heart rate, cardiac output, effective right atriul pressure and blood volume to injoctions of meningococcus toxin, levarterenol and doxtrun. mm. Hg or more was 20 ng. per min. in two animals, 40 jug- per min. in two animals, 80 fig. per min. in two animals and 320 fig. per min. in two animals. The average increase in arterial pressure in these 8 animals was 38 mm. Hg. The average increase in cardiac output was 29.5 ml./min./Kg. The cardiac output increased in six of the eight animals. The increase was statistically significant for the group (p < .02). Because of the relationship of the adrenal cortex to the integrity of the vascular system, the effect of cortisone on the response of the circulation to meningococcus toxin was studied. The animals were given cortisone acetate 10 mg. per Kg. intramuscularly. One half of the total dose was given 12 hours prior to the administration of the toxin and the remainder one-half hour before injection of the toxin. Because of the variation in potency of various lots of toxin, 7 pail's of animals were studied. These received the same dose of the same lot of toxin on the same day. The results are given in table 4. The average mean arterial pressure was 184 mm. Hg in the cortisonetreated animals prior to the administration of toxin. This was significantly higher than the average pressure in the control group of 142 mm. Hg (p < .05). The average cardiac output was also slightly higher in the cortisonetreated animals but this was not statistically significant. The values were .253 L. per Kg. per minute for the cortisone group and .223 L. per Kg. per minute for the controls. Following administration of toxin, the arterial pressure fell in all animals and was lower in 4 of the cortisone-treated dogs than in their untreated controls (pairs 1, 4, 5, 7). Although the percentage decrease in cardiac output in the cortisone-treated dogs was less than in the untreated controls with two exceptions (pairs 1 and 4), this was not significant. The average mean arterial pressure for the cortisone-treated group of dogs after the administration of toxin was 85 mm. Hg and for the control group it was 81 mm. Hg. Corresponding average values for cardiac output were .111 L. per Kg. per minute and .103 L. per Kg. per minute respectively. It is evident that cortisone therapy did not protect the animals from the hypotensive effect of toxin. This is TABLE 4.—Effect of Previous Administration of Cortisone on Arterial Pressure and Cardiac Output Following Administration of Meningococcus Toxin. Pair 1* No cortisone Cortisone Pair 2 No cortisone Cortisone Pair 3 No cortisone Cortisone Pair 4 No cortisone Cortisone Pair 5 No cortisone Cortisone Pair 6 No cortisone Cortisone Pair 7 No cortisone Cortisone Mean Arterial Pressure mm. HR Before After 121 165 133 163 143 166 143 175 163 156 146 20S 149 234 101 69 7S 104 7S 106 91 75 S5 67 54 97 S3 79 Cardiac Output L./Kd./min. Before .164 .570 .164 .250 .204 .232 .220 .20S .275 .133 .218 .265 .320 .125 After .195 .052 .094 .177 .128 .140 .084 .066 .112 .06S .062 .1S3 .047 .094 * Paired animals received the same lot of toxin and the same dose of toxin per Kg. on the same day. Downloaded from http://circres.ahajournals.org/ by guest on November 28, 2012
- Page 1 and 2: A Study of Hypotension (Shock) Prod
- Page 3: examined at autopsy. Small visceral
- Page 7 and 8: led to an immediate rise in arteria
380 SHOCK DUE TO BACTERIAL TOXIN<br />
TABLE 2.—Effect of Hemonhage (10 ml. per Kg.) on<br />
Hypotension Produced by Meningococciis Toxin<br />
DOE<br />
5<br />
6<br />
S<br />
12<br />
Cardiac Output<br />
L./Kg./Min.<br />
Before<br />
.716<br />
.315<br />
.134<br />
.105<br />
After<br />
.060<br />
.077<br />
.065<br />
.071<br />
Total Periphera<br />
Mean Arterial Resistance<br />
Pressure mm. Hg dynes/seconds/<br />
cm." 1<br />
Before<br />
97<br />
74<br />
S6<br />
75<br />
After<br />
56<br />
55<br />
4S<br />
50<br />
Before<br />
7594<br />
1971<br />
4916<br />
6260<br />
After<br />
S623<br />
5957<br />
5658<br />
6595<br />
.factor for the hypotension induced by the<br />
toxin.<br />
The effect of reduction of blood volume on<br />
the hypotension produced by toxin was<br />
studied. Four animals were given toxin intravenously.<br />
After the maximum decline in<br />
arterial pressure had occurred, blood in the<br />
amount of one per cent of the body weight<br />
was removed. The observations were repeated<br />
ten minutes later (table 2). The further decline<br />
in arterial pressure was principally associated<br />
with a marked further reduction in cardiac<br />
output in all four animals consequent to<br />
further impairment of venous return by the<br />
hemorrhage. Calculation of the T.P.R., which<br />
showed a marked increase in one experiment<br />
(dog 6), <strong>and</strong> probably insignificant increases<br />
in the three others, supports this contention.<br />
A hemorrhage of this magnitude in the normal<br />
animal would have relatively little permanent<br />
•effect on cardiac output <strong>and</strong> arterial pressure.<br />
Inasmuch as the hypotension <strong>and</strong> reduction<br />
in cardiac output following the administration<br />
of toxin was accompanied by a reduction in<br />
Don<br />
1<br />
2<br />
4<br />
6<br />
7<br />
10<br />
13<br />
15<br />
16<br />
22<br />
systemic <strong>and</strong> pulmonary venous pressure, an<br />
experiment was performed to determine the<br />
effect of increasing the blood volume on the<br />
circulation. Hypervolemia was produced by<br />
the intravenous infusion of 6 per cent dextran<br />
in 0.85 per cent saline. Toxin was first administered<br />
to the animals. When a maximum<br />
decline in arterial pressure had occurred,<br />
dextran solution in the amount of 30 ml. per<br />
Kg. was administered. Observations were<br />
made immediately before <strong>and</strong> after the infusion<br />
of dextran. The results on 10 animals<br />
are given in table 3. The right atrial pressure<br />
<strong>and</strong> the cardiac output increased after dextran<br />
infusion to above the control level, while the<br />
increase in arterial pressure was of a lesser<br />
degree. This was apprently due to the fact<br />
that there was a marked decline in total<br />
peripheral resistance after administration of<br />
dextran in the majority of experiments.<br />
The effect of levarterenol on the arterial<br />
pressure <strong>and</strong> cardiac output was studied in<br />
eight animals. Observations on the effect of<br />
levarterenol prior to the administration of<br />
toxin revealed that a moderate pressor response<br />
was produced by infusion at the rate of 20<br />
tig. per min. A marked pressor response was<br />
produced by infusion at the rate of 40 ^g- per<br />
min. Following administration of toxin <strong>and</strong><br />
development of hypotension, a larger quantity<br />
of levarterenol was required to produce a<br />
pressor response in some of the animals. The<br />
course of a typical experiment is shown in<br />
figure 1. The amount of levarterenol required<br />
to produce a rise in arterial pressure of 20<br />
TABLE 3.—Effect of Dextran (SO ml. per Kg.) on Hypotension Produced by Meningococciis Toxin<br />
Mean Arterial Pressure<br />
mm. Hg<br />
Before<br />
76<br />
73<br />
53<br />
74<br />
64<br />
42<br />
55<br />
65<br />
55<br />
78<br />
After<br />
129<br />
130<br />
102<br />
S2<br />
6S<br />
63<br />
125<br />
104<br />
91<br />
107<br />
Right Atr al Pressure<br />
mm Hg<br />
Before<br />
-0.2<br />
-1.5<br />
-2.0<br />
-2.5<br />
-0.5<br />
-0.2<br />
-2.6<br />
-0.6<br />
-4.0<br />
-3.S<br />
After<br />
+0.5<br />
+ 14.3<br />
+2.0<br />
+0.2<br />
0<br />
0<br />
-0.2<br />
+0.5<br />
+0.5<br />
+0.7<br />
Before<br />
.116<br />
.128<br />
.144<br />
.315<br />
.077<br />
.063<br />
.OSO<br />
.057<br />
.045<br />
.128<br />
Cardiac output<br />
L./Kg /min.<br />
After<br />
.218<br />
.410<br />
.318<br />
.274<br />
.103<br />
.200<br />
.280<br />
.322<br />
.364<br />
.305<br />
Total Peripheral Resistance<br />
dynes/ seconds/cm."*<br />
Before<br />
5475<br />
7113<br />
4196<br />
1971<br />
6647<br />
6274<br />
504S<br />
7113<br />
10723<br />
5874<br />
Downloaded from<br />
http://circres.ahajournals.org/ by guest on November 28, 2012<br />
After<br />
4955<br />
3969<br />
3650<br />
2504<br />
5275<br />
2997<br />
3290<br />
2025<br />
21S5<br />
3423


